
GFRP Rebar Market

GFRP Rebar Market by Resin Type (Vinyl Ester, Epoxy), Diameter (< 10 mm, 10�20 mm, > 20 mm), Tensile Strength (Low strength (<1000 MPa), High Strength (> 1000 MPa)), Application (Highway, Bridges & Buildings, Marine Structure & Waterfront, Water Treatment Plants) & Region - Global Forecast to 2030


OVERVIEW
Source: Secondary Research, Interviews with Experts, MarketsandMarkets Analysis
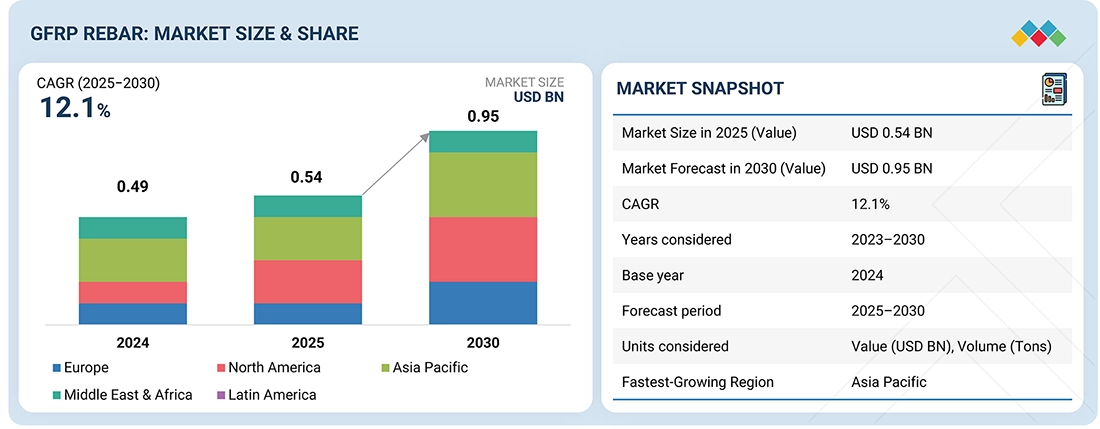
The GFRP rebar market is projected to reach USD 0.95 billion by 2030 from USD 0.54 billion in 2025, at a CAGR of 12.1%. The GFRP rebar market is growing rapidly with the growing need for lightweight and corrosion-resistant reinforcement materials in the construction sector. With conventional steel rebars suffering from rusting and excessive maintenance requirements, GFRP rebars have a strong advantage in terms of high tensile strength, non-corrosive nature, and electromagnetic neutrality, which makes them suitable for infrastructure development in extreme environments.
KEY TAKEAWAYS
-
BY RESIN TYPEThe GFRP rebar market comprises of vinyl ester, epoxy, and other resin types. Among these, vinyl ester holds the largest market share as it provides high corrosion resistance and strong bonding with fibers, making the rebars suitable for long-term structural durability in harsh environments.
-
BY DIAMETERGFRP rebars are available in different diameter ranges, including <10 mm, 10–20 mm, and >20 mm, to meet diverse structural design requirements. The 10–20mm segment is projected to register the highest growth during the forecast period due to its mechanical performance and durability.
-
BY TENSILE STRENGTHGFRP rebars are categorized by tensile strength into low strength (<1000 MPa) and high strength (>1000 MPa) grades. Low-strength rebars holds the largest share in the market due to growing deamnd for small-scale construction projects.
-
BY APPLICATIONThe highways, bridges & buildings application is projected to witness the fastest growth due to the growing need for durable, corrosion-resistant, and sustainable reinforcement materials. GFRP rebars also find applications across marine structures & waterfront, and water treatment plants.
-
BY REGIONThe GFRP rebar market covers Europe, North America, Asia Pacific, Latin America, the Middle East, and Africa. Asia Pacific is the largest market for GFRP rebar due to region's rapid urbanization, robust infrastructure development, and government support for sustainable construction materials especially in countries like China, India, Japan, and South Korea.
-
COMPETITVE LANDSCAPEMajor market players have adopted both organic and inorganic strategies, including partnerships and investments. For instance, Dextra Group (Thailand), Pultron Composites (New Zealand), and Pultrall Inc. (Canada) have entered into a number of agreements and partnerships to cater to the growing demand for GFRP rebar across innovative applications.
The GFRP rebar market is expanding beyond traditional infrastructure projects, fueled by the search for reinforcement solutions that are both corrosion-resistant and lightweight. GFRP rebars are gaining adoption across bridges, marine structures, tunnels, roads, swimming pools, and industrial floors especially where metal corrosion, high humidity, saltwater exposure, or demanding temperature fluctuations occur. Sustainability and cost-effectiveness are boosting demand, as GFRP rebars can significantly lower lifecycle emissions and extend the operating life of reinforced concrete assets.
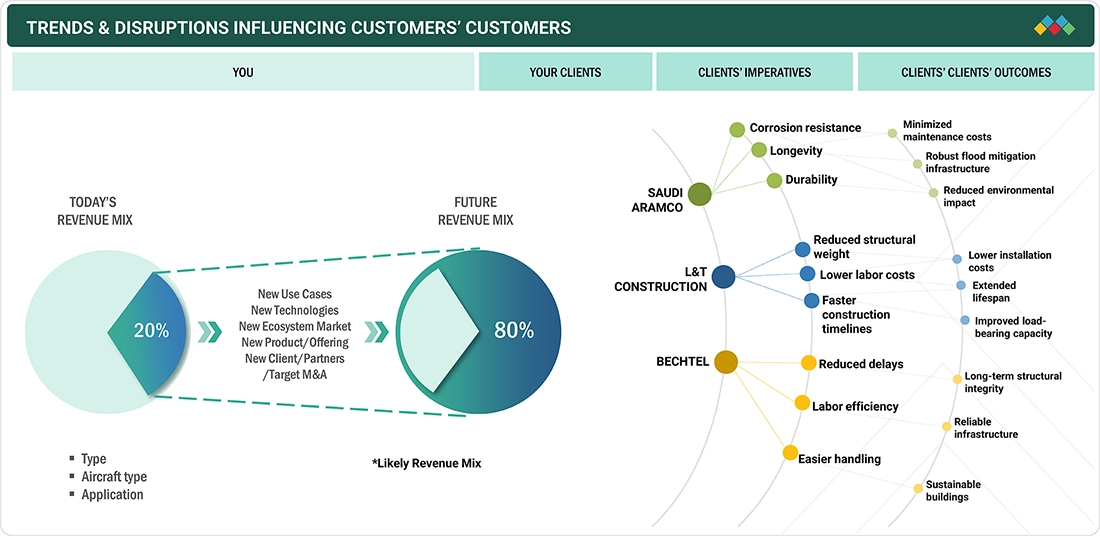
TRENDS & DISRUPTIONS IMPACTING CUSTOMERS' CUSTOMERS
Changes in customer trends or disruptions affect consumers’ businesses. These shifts influence the revenues of end users. As a result, the revenue changes for end users are likely to impact the revenues of GFRP rebar suppliers, which, in turn, affect the revenues of GFRP rebar manufacturers.
Source: Secondary Research, Interviews with Experts, MarketsandMarkets Analysis
MARKET DYNAMICS
Level
-
Increasing application in construction industry

-
Government-led regulations on use of GFRP rebars

Level
-
Availability of substitutes

-
High cost of GFRP rebars

Level
-
Rising investments in large-scale civil engineering projects

-
Growing use in construction of highways and bridges

Level
-
Supply chain and manufacturing constraints

-
Inability to completely replace steel rebar

Source: Secondary Research, Interviews with Experts, MarketsandMarkets Analysis
Driver: Increasing application in construction industry
The demand for GFRP rebar within the construction sector is driven by large infrastructure projects in Asia Pacific, North America, and Europe. Major countries are adopting GFRP rebars for bridges, coastal defense, and seismic retrofitting due to their lightweight, corrosion resistance, and long service life making them a sustainable alternative to steel, reducing lifecycle and maintenance costs. As green building and net-zero targets advance, GFRP rebars are becoming a vital choice for durable, cost-effective, and large-scale construction projects.
Restraint: High cost of GFRP rebars
GFRP rebar faces limited adoption mainly due to its higher upfront cost compared to traditional steel rebar. The use of costly raw materials like epoxy resin and glass fiber roving, along with specialized and less-scaled manufacturing processes, drives up prices. In cost-sensitive markets, steel remains the preferred option despite its susceptibility to corrosion and higher lifecycle maintenance costs. The long-term benefits of GFRP, such as durability and reduced maintenance, are often overlooked in favor of short-term budget considerations and industry familiarity with steel.
Opportunity: Integration of graphene into GFRP rebar for concrete reinforcement
Graphene-enhanced GFRP rebar represents a major advancement in concrete reinforcement, combining graphene’s exceptional strength and lightness with traditional composite benefits. With only 0.1–0.3% graphene by weight, tensile strength can increase by up to 60%, reaching levels of around 2300 MPa while remaining four times lighter than steel. The material offers exceptional corrosion, alkali, UV, and crack resistance, making it ideal for demanding environments like marine or underground infrastructure.
Challenge: Supply chain and manufacturing constraints
GFRP rebar production remains in its early stages, facing major hurdles in scaling to meet rising demand. Unlike the mature steel rebar industry, it lacks decades of investment, global infrastructure, and established logistics. Production is limited to a few specialized manufacturers, restricting consistent supply for large projects and regions without local facilities. The lack of vertical integration across raw materials, fabrication, and distribution further leads to long lead times and potential quality inconsistencies.
GFRP Rebar Market: COMMERCIAL USE CASES ACROSS INDUSTRIES
| COMPANY | USE CASE DESCRIPTION | BENEFITS |
|---|---|---|
 |
Uses GFRP rebar in bridges, tunnels, metro rail, and railway infrastructure projects | Corrosion resistance, longer service life, lightweight for easier installation, reduced maintenance |
 |
Employs GFRP rebars in water treatment plants and chemical containment structures | Chemical resistance, durability in harsh environments, non-magnetic properties |
 |
Utilizes GFRP rebars for marine infrastructure, including docks, piers, and seawalls | Saltwater corrosion resistance, high strength-to-weight ratio, long-lasting performance |
 |
Incorporates GFRP rebar in electrical and medical facility construction for electromagnetic transparency | Non-conductive, corrosion-resistant, signal interference prevention |
 |
Implements GFRP rebars in commercial and residential building foundations, slabs, and walls | Lightweight, ease of handling, enhanced durability, sustainable building solutions |
Logos and trademarks shown above are the property of their respective owners. Their use here is for informational and illustrative purposes only.
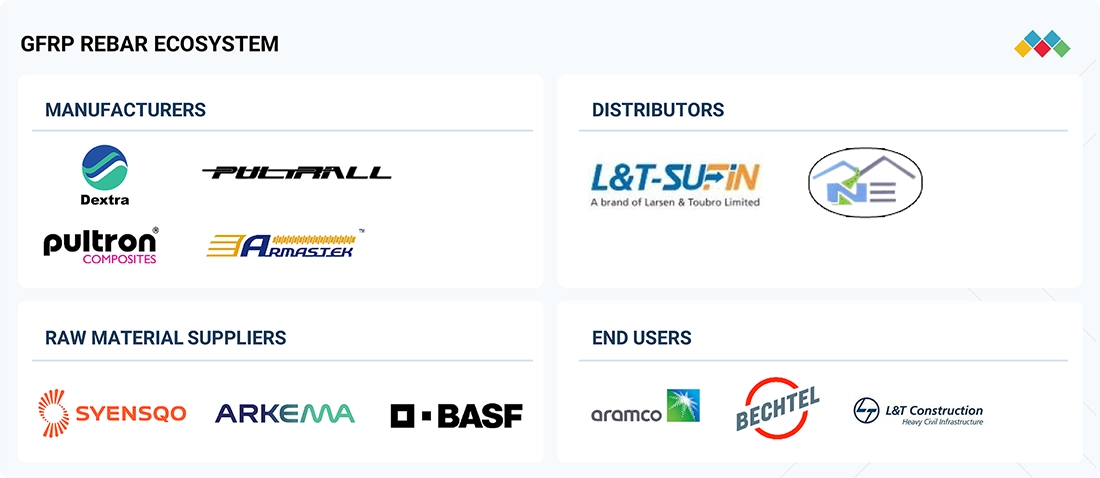
MARKET ECOSYSTEM
The GFRP rebar ecosystem analysis involves identifying and analyzing interconnected relationships among various stakeholders, including raw material suppliers, manufacturers, distributors, and end users. The raw material suppliers provide glass fiber and resins to GFRP rebar manufacturers. The distributors and suppliers establish contact between the manufacturing companies and end users to streamline the supply chain, increasing operational efficiency and profitability.
Logos and trademarks shown above are the property of their respective owners. Their use here is for informational and illustrative purposes only.
MARKET SEGMENTS
Source: Secondary Research, Interviews with Experts, MarketsandMarkets Analysis
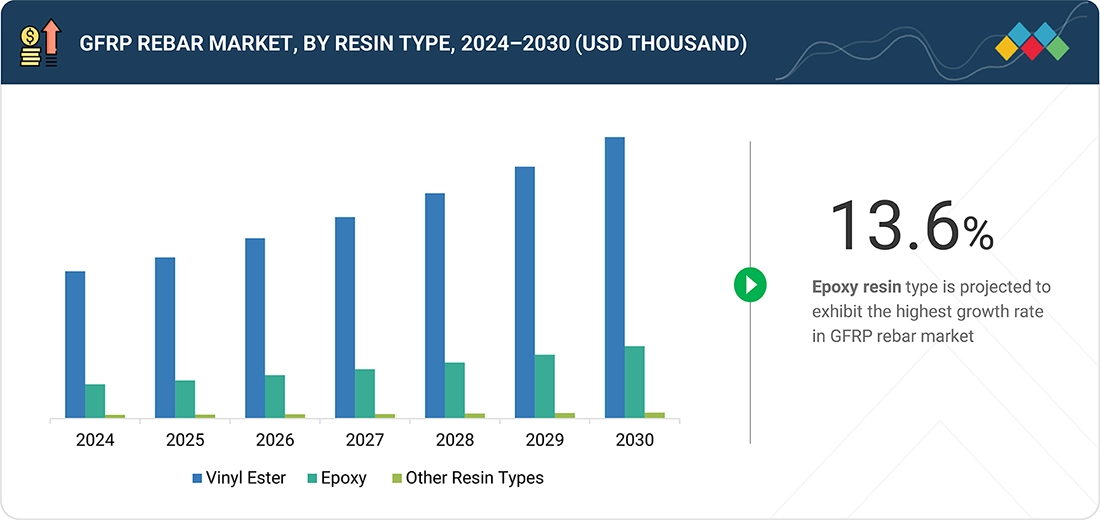
GFRP Rebar Market, By Resin Type
In 2024, vinyl ester accounted for the largest share of the GFRP rebar market, as it offers better corrosion resistance, mechanical strength, and a cost advantage over other resins, such as polyester or epoxy. In severe conditions, such as marine structures, bridges, or chemically aggressive environments, vinyl ester offers superior resistance to moisture and chemical attack, which substantially improves the durability and lifespan of GFRP rebars. It also provides a good balance of performance and cost, which makes it less expensive than epoxy yet superior to polyester in structural use.
GFRP Rebar Market, By Diameter
The 10-20mm diameter range leads the GFRP rebar market because it is the most versatile and widely used size for various construction projects, including highways, bridges, and buildings. This size provides an ideal balance of strength, cost-effectiveness, and compatibility with infrastructure standards, making it a preferred choice for many applications. These rebars offer excellent corrosion resistance and durability, which makes them especially suitable for harsh environments, driving their strong market adoption.
GFRP Rebar Market, By Tensile Strength
Low tensile strength (<1000 MPa) GFRP rebars led the market in 2024, primarily due to a balance between cost, performance, and application suitability. Although higher tensile strengths are achievable, such as with graphene-enhanced GFRP, these come at a higher cost and complexity that limit large-scale adoption. The commonly available GFRP rebars around 1000 MPa tensile strength offer sufficient strength for many infrastructure projects with the key advantage of corrosion resistance, lightweight, and durability, making them cost-effective over their lifecycle.
GFRP Rebar Market, By Application
In 2024, the highways, bridges, and buildings segment dominated the GFRP rebar market due to growing adoption as a sustainable alternative to steel reinforcement. In road construction, GFRP rebar enhances durability in de-icing salt and water-exposed areas like pavements, medians, and retaining walls. For bridges, especially those in coastal or chemically aggressive environments, it offers superior corrosion resistance, reducing maintenance costs and improving safety. In buildings and parking structures, its non-conductive and non-magnetic properties make it suitable for applications sensitive to electromagnetic interference, enabling longer-lasting and cost-effective infrastructure.
REGION
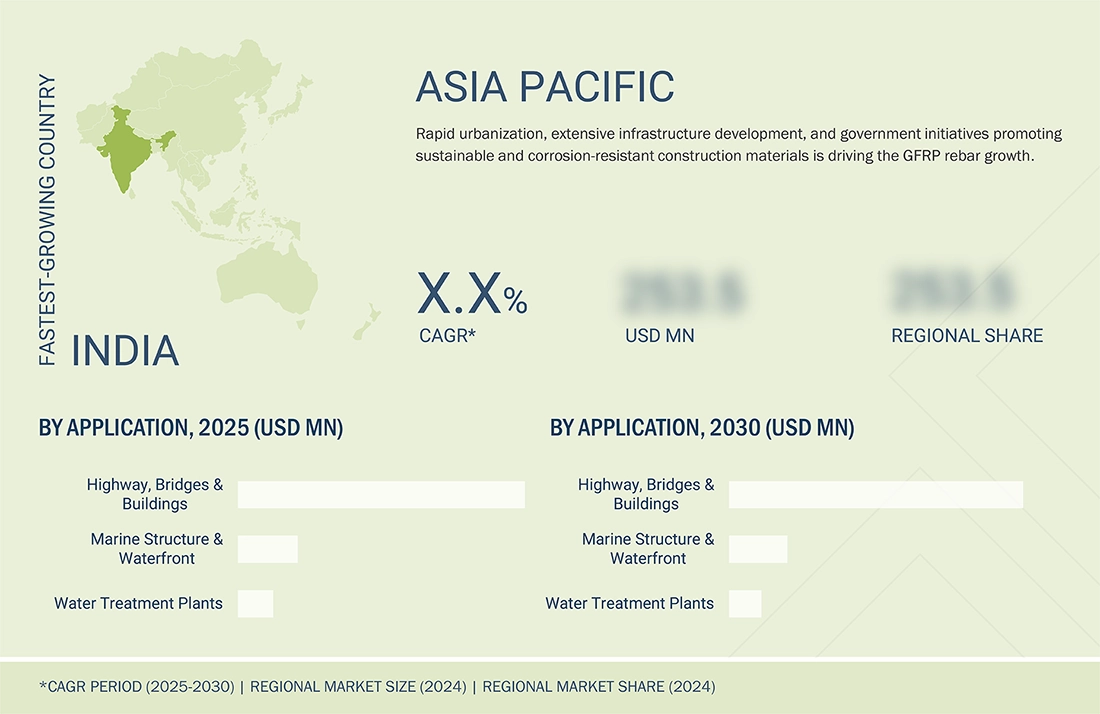
Asia Pacific to be fastest-growing region in global GFRP rebar market during forecast period
Asia Pacific is projected to witness the fastest growth in the GFRP rebar market, driven by expanding infrastructure in China, India, Japan, South Korea, and Southeast Asia. GFRP rebar is increasingly preferred over steel due to its high tensile strength, corrosion resistance, and low maintenance requirements, making it an ideal choice for bridges, tunnels, marine structures, and water facilities. Supportive government policies and green building initiatives are further boosting demand, with advanced economies such as Japan and South Korea focusing on next-gen engineering projects. In April 2025, India’s Olectra Greentech introduced cost-effective GFRP rebar for applications in flooring, pavements, and the marine sector, further boosting demand.
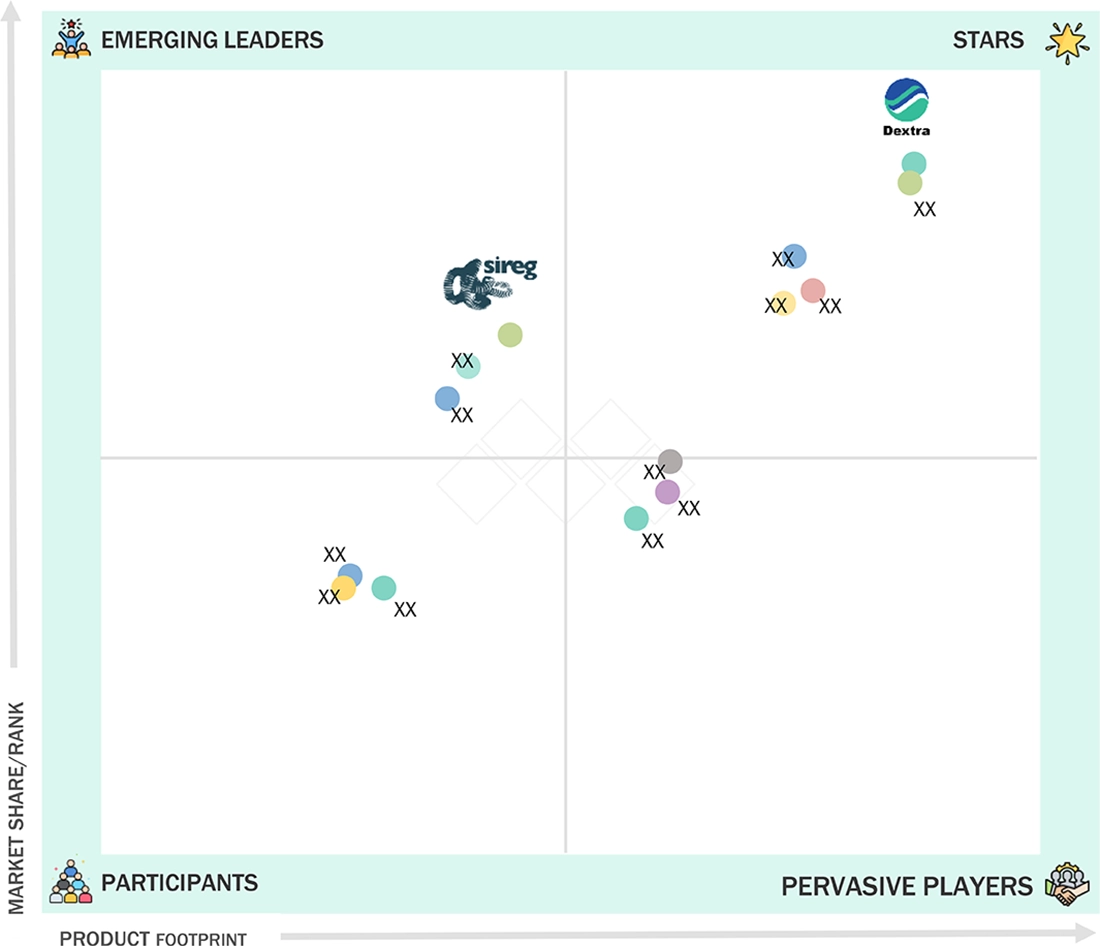
GFRP Rebar Market: COMPANY EVALUATION MATRIX
In the GFRP rebar market matrix, Dextra Group (Star) leads with a strong market share and an extensive product footprint, which is widely adopted in highway, bridge, and building applications. Sireg S.P.A. (Emerging Leader) is gaining visibility as it focuses on innovation, backing this with strong certifications and real infrastructure projects. While Dextra Group dominates through scale and a diverse portfolio, Sireg S.P.A. shows significant potential to move toward the leaders’ quadrant as demand for GFRP rebars continues to rise.
Source: Secondary Research, Interviews with Experts, MarketsandMarkets Analysis
KEY MARKET PLAYERS
MARKET SCOPE
| REPORT METRIC | DETAILS |
|---|---|
| Market Size in 2024 (Value) | USD 0.49 Billion |
| Market Forecast in 2030 (value) | USD 0.95 Billion |
| Growth Rate | CAGR of 12.1% from 2025-2030 |
| Years Considered | 2023-2030 |
| Base Year | 2024 |
| Forecast Period | 2025-2030 |
| Units Considered | Value (USD Billion), Volume (Ton) |
| Report Coverage | Revenue forecast, company ranking, competitive landscape, growth factors, and trends. |
| Segments Covered |
|
| Regions Covered | North America, Asia Pacific, Europe, Latin America, Middle East & Africa |
WHAT IS IN IT FOR YOU: GFRP Rebar Market REPORT CONTENT GUIDE
DELIVERED CUSTOMIZATIONS
We have successfully delivered the following deep-dive customizations:
| CLIENT REQUEST | CUSTOMIZATION DELIVERED | VALUE ADDS |
|---|---|---|
| Asia-Pacific-based GFRP Rebar Manufacturers |
|
|
| Civil Infrastructure Developer / EPC Contractor |
|
|
| Raw Material Distributor |
|
|
| Construction Companies |
|
|
RECENT DEVELOPMENTS
- March 2025 : Dextra Group, in association with its Saudi Arabian GFRP manufacturing partner, Industrial Control Solutions Company (ICSC), joined as a Bronze Supporting Member of NEx, an ACI Center of Excellence for Nonmetallic Building Materials. The association is dedicated to the promotion of nonmetallic material use, especially GFRP rebars, within the construction sector.
- March 2025 : Pultron Composites of New Zealand reported the successful application of its Mateenbar glass GFRP rebar in building a strengthened concrete breakwater for Tauranga Bridge Marina. Bellingham Marine designed and constructed the project to safeguard the marina against severe weather.
- January 2025 : Dextra Group (Thailand) and Normet International Ltd. (Finland) entered into a Memorandum of Understanding (MoU) for cooperation on the worldwide development and supply of next-generation GFRP reinforcing products.
Table of Contents
 Exclusive indicates content/data unique to MarketsandMarkets and not available with any competitors.
Methodology
The study involves two major activities in estimating the current market size for the GFRP rebar market. Exhaustive secondary research was done to collect information on the market, peer market, and parent market. The next step was to validate these findings, assumptions, and sizing with industry experts across the value chain through primary research. Both top-down and bottom-up approaches were employed to estimate the complete market size. After that, market breakdown and data triangulation were used to estimate the market size of segments and subsegments.
Secondary Research
Secondary sources referred to for this research study include financial statements of companies offering GFRP rebar and information from various trade, business, and professional associations. Secondary research has been used to obtain critical information about the industry’s value chain, the total pool of key players, market classification, and segmentation according to industry trends to the bottom-most level and regional markets. The secondary data was collected and analyzed to arrive at the overall size of the GFRP rebar market, which was validated by primary respondents.
Primary Research
Extensive primary research was conducted after obtaining information regarding the GFRP rebar market scenario through secondary research. Several primary interviews were conducted with market experts from both the demand and supply sides across major countries of North America, Europe, Asia Pacific, the Middle East & Africa, and Latin America. Primary data was collected through questionnaires, emails, and telephonic interviews. The primary sources from the supply side included various industry experts, such as chief experience officers (CXOs), vice presidents (VPs), business development/marketing directors, product development/innovation teams, related key executives from the GFRP rebar industry, system integrators, component providers, distributors, and key opinion leaders. Primary interviews were conducted to gather insights such as market statistics, data on revenue collected from the products and services, market breakdowns, market size estimations, market forecasting, and data triangulation. Primary research also helped in understanding the various trends related to resin type, diameter, tensile strength, application, and region. Stakeholders from the demand side, including CIOs, CTOs, CSOs, and installation teams of customers/end users for GFRP rebar services, were interviewed to understand the buyer’s perspective on the suppliers, products, component providers, and their current usage of GFRP rebar and future outlook of their business which will affect the overall market.
Breakup of Primary Research:

To know about the assumptions considered for the study, download the pdf brochure
Market Size Estimation
The research methodology used to estimate the size of the GFRP rebar market includes the following details. The market size was determined from the demand side. The market was upsized based on the demand for GFRP rebar in different applications at the regional level. Such procurements provide information on the demand aspects of the GFRP rebar industry for each application. For each application, all possible segments of the GFRP rebar market were integrated and mapped.

Data Triangulation
After arriving at the overall size from the market size estimation process explained above, the total market was split into several segments and subsegments. The data triangulation and market breakdown procedures explained below were implemented, wherever applicable, to complete the overall market engineering process and arrive at the exact statistics for various market segments and subsegments. The data was triangulated by studying various factors and trends from the demand and supply sides. Along with this, the market size was validated using both the top-down and bottom-up approaches.
Market Definition
GFRP rebar or glass fiber-reinforced polymer rebar is a non-metallic composite material crafted by combining glass fiber with a polymer matrix—often consisting of materials such as epoxy, vinyl ester, or polyester. This innovative combination results in a lightweight yet robust reinforcement solution that is highly resistant to corrosion, making it particularly suitable for challenging environments like coastal areas, chemical plants, or industrial settings where traditional steel rebar is prone to degradation over time. The exceptional tensile strength of GFRP rebar enhances structural integrity and contributes to longer-lasting and more durable construction applications, paving the way for advanced engineering solutions in various sectors.
Stakeholders
- GFRP Rebar Manufacturers
- GFRP Rebar Distributors and Suppliers
- Universities, Governments, and Research Organizations
- Associations and Industrial Bodies
- R&D Institutes
- Environmental Support Agencies
- Investment Banks and Private Equity Firms
- Research and Consulting Firms
Report Objectives
- To define, describe, and forecast the GFRP rebar market size in terms of volume and value
- To provide detailed information regarding the key factors, such as drivers, restraints, opportunities, and challenges influencing market growth
- To analyze and project the global GFRP rebar market by resin type, tensile strength, diameter, application, and region
- To forecast the market size concerning five main regions (along with country-level data), namely, North America, Europe, Asia Pacific, the Middle East & Africa, and Latin America, and analyze the significant region-specific trends
- To strategically analyze micromarkets with respect to individual growth trends, prospects, and contributions of the submarkets to the overall market
- To analyze the market opportunities and the competitive landscape for stakeholders and market leaders
- To assess recent market developments and competitive strategies, such as agreements, contracts, acquisitions, and product developments/product launches, to draw the competitive landscape
- To strategically profile the key market players and comprehensively analyze their core competencies
Key Questions Addressed by the Report
Who are the major companies in the GFRP rebar market? What key strategies have market players adopted to strengthen their market presence?
Major players include Dextra Group (Thailand), Schöck Bauteile GmbH (Germany), Pultron Composites (New Zealand), Sireg S.P.A. (Italy), Pultrall Inc. (Canada), Kodiak Fiberglass Rebar (US), Neuvokas Corporation (US), Röchling (Germany), ARC Insulations & Insulator Ltd. (India), Jindal Advanced Materials (India), SKD Composites (India), Galen LLC (Russia), Fibrolux (Germany), FRT TUF-BAR (Canada), and Armastek (Russia). Strategies such as product launches, acquisitions, and expansions have been widely adopted to enhance market presence.
What are the drivers and opportunities for the GFRP rebar market?
Growing demand from the construction industry and rising investments in large civil engineering projects are major drivers and opportunities for the GFRP rebar market.
Which region is expected to hold the largest market share?
Asia Pacific is projected to lead the market due to rapid industrialization, urbanization, and the presence of numerous small-scale manufacturers.
What is the projected growth rate of the GFRP rebar market over the next five years?
The market is expected to grow at a CAGR of 12.1% during the forecast period.
How is the GFRP rebar market aligned for future growth?
The market is well-positioned for growth due to increasing adoption in the construction sector, driven by longer lifespan and corrosion resistance of GFRP rebars, making them a viable alternative to steel in high-end infrastructure projects.
Need a Tailored Report?
Customize this report to your needs
Get 10% FREE Customization
Customize This ReportPersonalize This Research
- Triangulate with your Own Data
- Get Data as per your Format and Definition
- Gain a Deeper Dive on a Specific Application, Geography, Customer or Competitor
- Any level of Personalization
Let Us Help You
- What are the Known and Unknown Adjacencies Impacting the GFRP Rebar Market
- What will your New Revenue Sources be?
- Who will be your Top Customer; what will make them switch?
- Defend your Market Share or Win Competitors
- Get a Scorecard for Target Partners

Custom Market Research Services
We Will Customise The Research For You, In Case The Report Listed Above Does Not Meet With Your Requirements
Get 10% Free CustomisationTESTIMONIALS

We at Nissan Chemicals Corporation have been clients of MarketsandMarkets for more than a year now. We recently consulted MarketsandMarkets for a study, the team at MarketsandMarkets was extremely professional and organized. The business insights were very detailed and aligned well with our expectations that really helped us formulate the Business Plans and device new strategies for development themes. MarketsandMarkets offers a unique combination of expertise and dedicated engagement model. Their research findings have helped us in designing our Pricing Strategy which will make it easier for us to predict the future sales and profits for the next ten years. We look forward to working with MarketsandMarkets in the future.
VP of Strategy & New Business Development
Leading Specialty Chemical Company
The MarketsandMarkets Engagement Model, composed of both the Knowledge Store and advisory custom research, has greatly helped us in understanding our markets and making strategic decisions. The Knowledge Store is a fast way to allow everyone in our organization to understand more about most any market they are interested in. The ability to then get custom research done and get answers to specific strategic questions and market insight has been spectacular. The Markets and Markets team feel more like colleagues than vendors and their services have helped us change our culture where statements of things like growth opportunities and competitive position are always backed by industry research.

Rich Gibson,
Director, Corporate Strategy
Milliken & Company,
Leading Industrial Manufacturer of specialty chemical, floor covering, performance and protective textile materials, and healthcaremilliken.com
MarketsandMarkets is a trusted resource that helps us to better understand markets that are near-adjacencies-whether its technology, value chain or geography. Their Knowledge Store platform provides a dashboard of markets and their characteristics which is easy to use and saves us time.
Adam Shaw,
Market Development and Strategy Manager
AdvanSix Inc. USA,
An American Leader in Chemicalswww.advansix.com
The Knowledge Store from MarketsandMarkets is a valuable tool which has helped my team acquire greater insight in to the end markets that our business serves. This has enabled us to help our company build stronger strategies throughout our planning process.
TOSHIO KINOSHITA
Senior Chif Consultion Research & Consulting Division
Mitsubishi Chemical Research Corporation,
Leading Manufacturer of Chemical Productswww.mitsubishichem-res.co.jp/en/

We recently engaged with MarketsandMarkets for a study, the team not only clearly understood our business objectives but was also extremely professional in the way they handled the entire project. The study was efficiently conducted in a phase-wise manner, and the engagement model furnished us with high-quality business insights that far exceeded our expectations at each phase. We were especially happy that MarketsandMarkets could provide us with both, an English as well as a Japanese version of the study. A special thanks to the Analyst Team and Client Services Team, whose fluency in Japanese enhanced our comfort level, as we could converse with them in our preferred language.
Independent entrepreneurs
Arrow Precision
We approached MarketsandMarkets for study on Proppants Market, and their work exceeded our expectations. The study conducted was comprehensive and enabled us to view the market through the various dimensions. In addition, the team was extraordinarily responsive throughout the process and resolved our queries on time. I strongly recommend MarketsandMarkets and will certainly consider them for additional market assessments we will need in the future.
Global engineering company, Japan
Deputy Manager,
Strategic Planning OfficeThe high-quality insights shared by the MarketsandMarkets team helped us understand the pharmaceutical plant designers in a specific geography. It also captured the risks that we may likely face in communicating with our potential partners. The study would enable us identify partners, which would impact our future growth.


Growth opportunities and latent adjacency in GFRP Rebar Market