
GFRP Composites Market

GFRP Composites Market by Resin Type (Polyester, Vinyl Ester, Epoxy, Polyurethane, Thermoplastics, and Other resins), Manufacturing Process [Compression & Injection Molding, Filament Winding, Layup, Pultrusion, Resin Transfer Molding (RTM), Other Manufacturing Processes], End-use Industry (Transportation, Construction & Infrastructure, Electrical & Electronics, Pipes & Tanks, Marine, Aerospace & Defense, Wind Energy, and Other End-use Industries), Region - Global Forecast to 2030


OVERVIEW
Source: Secondary Research, Interviews with Experts, MarketsandMarkets Analysis
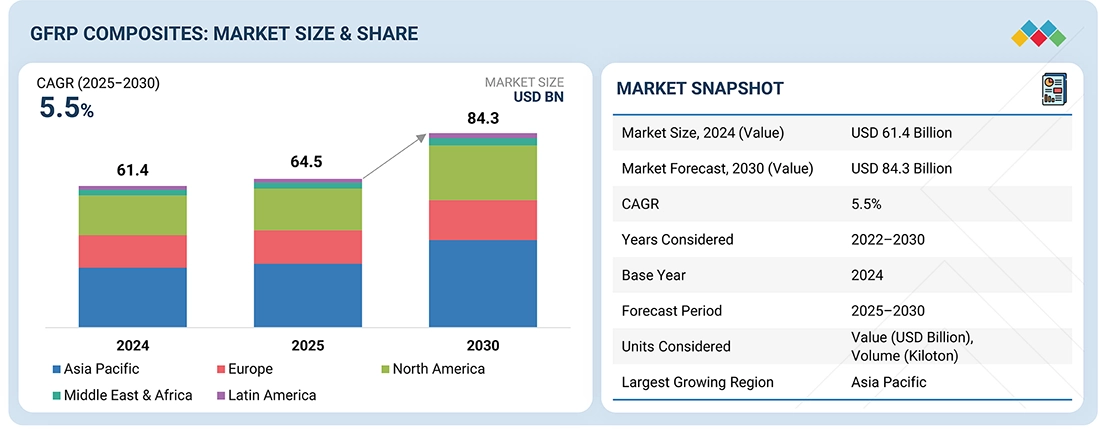
The GFRP composites market is projected to reach USD 84.3 billion by 2030 from USD 64.5 billion in 2025, at a CAGR of 5.5%. GFRP composites comprise thermoset or thermoplastic polymer reinforced with fine glass fibers. Glass fiber is produced by melting glass in a furnace and then transferring the molten glass into superfine holes to create thin glass filaments/fibers. GFRP composites are created by embedding high-strength glass fibers within a polymer resin, resulting in a material that boasts remarkable strength and durability. The glass fibers in GFRP composites can be made from various types of glass, including E-glass, S-glass, and others, each with distinct properties suitable for specific applications. The polymer resin matrix can consist of thermosetting or thermoplastic resins, which provide different characteristics like enhanced strength, flexibility, and chemical resistance. The combination of these materials leads to a lightweight, corrosion-resistant, and high-strength material that can be customized to meet the specific requirements of diverse industries.
KEY TAKEAWAYS
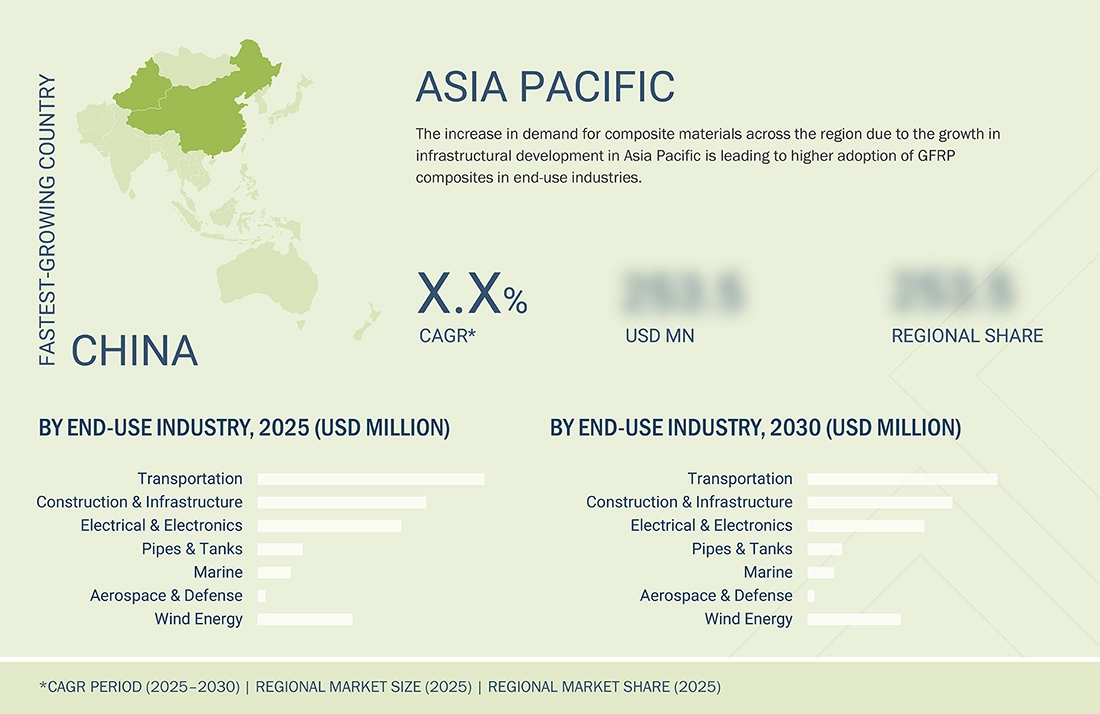
- The Asia Pacific region accounted for 42.3% market share in terms of value in 2024.
- The polyester resin type accounted for 35.7% market share in 2024, in terms of value.
- The compression molding & injection molding process is expected to grow at the highest CAGR of 6.4% during 2025-2030.
- The transportation industry dominated the GFRP composites market.
- Reliance Industries Limited (Reliance Composites Solutions), Asahi Yukizai Corporation, JPS Composite Materials, Mateenbar Composite Reinforcements, and CQDJ Composites among others, have distinguished themselves among startups and SMEs by securing strong footholds in specialized niche areas, underscoring their potential as market leaders.
The GFRP composites market is poised for strong growth, driven by robust demand across construction, automotive, wind energy, and other key industrial sectors. Demand from the automotive and aerospace sectors is increasing as manufacturers adopt lightweight materials to improve fuel efficiency.
TRENDS & DISRUPTIONS IMPACTING CUSTOMERS' CUSTOMERS
The GFRP composites market is being disrupted by several key trends, particularly in response to technological innovation, regulatory shifts, and sustainability demands. There is a strong industry focus on eco-friendly manufacturing, fully recyclable GFRP composites, circular economy approaches, and the development of bio-based resins and reinforcement fibers to reduce environmental impact. Adoption of 3D printing for GFRP components allows custom, complex shapes with less material waste, while automated fiber placement (AFP) and real-time quality tracking further boost efficiency.
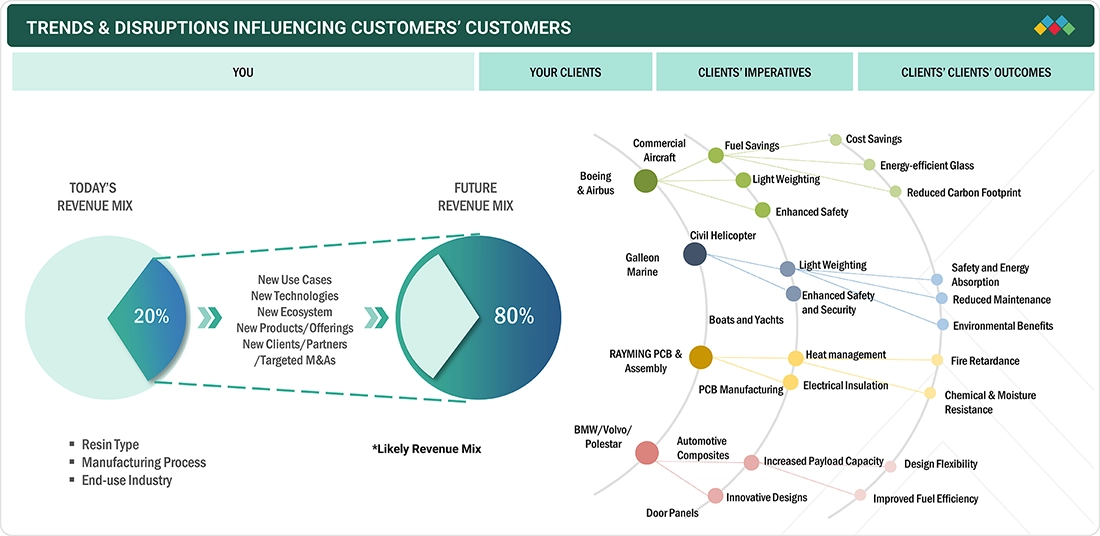
Source: Secondary Research, Interviews with Experts, MarketsandMarkets Analysis
MARKET DYNAMICS
Level
-
Increasing number of wind energy capacity installations

-
Increasing adoption of GFRP composites in the transportation industry

Level
-
Issues related to recycling

-
High processing and manufacturing costs

Level
-
High demand for GFRP composite pipes in the emerging economies

-
Increasing demand for GFRP composites from construction & infrastructure industry in Middle East & Africa

Level
-
Developing low-cost technologies

-
Standardization and regulation

Source: Secondary Research, Interviews with Experts, MarketsandMarkets Analysis
Driver: Increasing number of wind energy capacity installations
GFRP composites are used in wind turbine blades and nacelles. The increasing number of wind energy capacity installations is driving the demand for GFRP composites, as they are economical and provide high performance. Governments and energy planners in various countries are diversifying their energy mix, protecting their economies from volatile fossil fuel prices, and fighting harmful greenhouse gas (GHG) emissions. In addition, many countries are making efforts to restructure their energy systems in favor of renewable sources.
Restraint: Issues related to recycling
Companies are trying to help reduce global warming and explore the potential of composites to reduce greenhouse gas emissions. However, the difficulty in recycling GFRP composites is a stumbling block, especially in the construction and automotive industries, where the pressure to recycle is high. The European Composites Industry Association (EuCIA) states that GFRP and CFRP are recyclable. They comply with EU legislation and stringent regulations in the US. Recycling facilities for composites exist only in Germany; for companies in other countries, it is prohibitively expensive and not environmentally friendly. Hence, the only option that remains is landfill. Advanced recycling techniques like chemical recycling and thermal processes can recover higher quality fibers but involve high energy consumption and expensive equipment, and generate secondary waste, reducing economic attractiveness.
Opportunity: Increasing demand for GFRP composites from construction & infrastructure industry in Middle East & Africa
The GFRP composites industry is mainly concentrated in Asia Pacific, North America, and Europe. However, over the last few years, there has been an increasing use of GFRP composites in the construction and transportation industries in the Middle East & Africa. Moreover, the GFRP composites market in Saudi Arabia, Qatar, and the UAE is expected to be driven by government spending.
Challenge: Developing low-cost technologies
Developing low-cost technologies for GFRP composites remains a significant challenge and acts as a brake on broader market growth. Significant investments in research, equipment, and skilled labor are required to develop and scale new manufacturing methods in GFRP. This makes it difficult for both established firms and new entrants to lower the overall cost structure, particularly in mass production.
GFRP Composites Marke: COMMERCIAL USE CASES ACROSS INDUSTRIES
| COMPANY | USE CASE DESCRIPTION | BENEFITS |
|---|---|---|
 |
Use of GFRP composites in Boeing 707 for radomes, wing leading, and trailing edge panels | Reduction of overall aircraft weight and improving fuel efficiency |
 |
Use of GFRP composites in secondary aircraft structures such as fuselage panels, interior linings, and wing components | Corrosion resistance, making GFRP composites suitable for harsh environmental conditions faced by aircraft |
 |
Extensive use in marine companies for building vessels, hulls, decks, masts, and interior components | Resist deterioration from harsh saltwater, moisture, UV radiation, and chemicals, extending vessel life and reducing maintenance |
 |
GFRP footbridges used by building & construction companies such as Pedelta Structural Engineers to build the GFRP Lleida Pedestrian Bridge | High mechanical strength and impact resistance, providing durability and long service life |
 |
GFRP composites used primarily by Bankai Compositech in the manufacturing of switchgear components made from GFRP composites | Exceptional electrical insulation properties that prevent electrical leakage and galvanic corrosion |
Logos and trademarks shown above are the property of their respective owners. Their use here is for informational and illustrative purposes only.
MARKET ECOSYSTEM
The GFRP composites ecosystem analysis involves identifying and analyzing interconnected relationships among various stakeholders, including raw material suppliers (China Jushi Co., Ltd., Owens Corning, and Saint Gobain), manufacturers (Gurit Services AG, Strongwell Corporation, and Exel Composites), distributors (Pipespain, Barracuda Advanced Composites, and Losi Group), and end users (Tesla, GE Vernova, and ENERCON Global GmbH). The raw material suppliers provide silica, limestone, soda ash, fiberglass, resins, additives, binders, and pigments to GFRP composite manufacturers. The distributors and suppliers establish contact between the manufacturing companies and end users to streamline the supply chain, increasing operational efficiency and profitability.
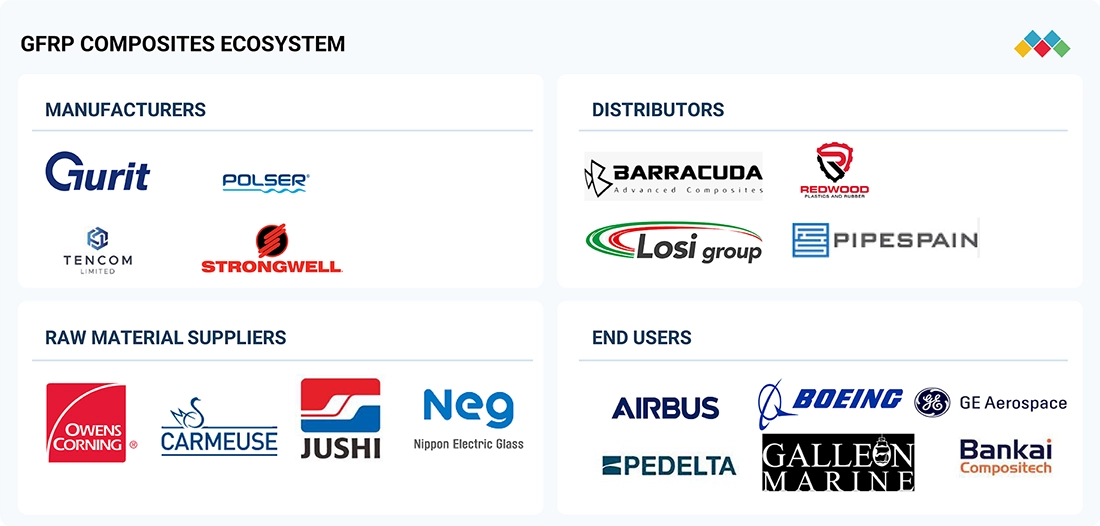
Logos and trademarks shown above are the property of their respective owners. Their use here is for informational and illustrative purposes only.
MARKET SEGMENTS
Source: Secondary Research, Interviews with Experts, MarketsandMarkets Analysis
GFRP Composites Market, By Resin Type
The polyester resin-based GFRP composites market accounted for the largest share in terms of value. Polyester is low-cost and offers properties such as dimensional stability, good mechanical and chemical resistance, and electrical properties. Polyester resins are the cheapest among all the types of resin, thereby providing the most economical way to incorporate resin, filler, and reinforcement. They are primarily used in sheet molding compounds (SMCs) and bulk molding compounds (BMCs).
GFRP Composites Market, By Manufacturing Process
Based on manufacturing process, the GFRP composite market is segmented into Compression & Injection Molding, Filament Winding, Layup, Pultrusion, Resin Transfer Molding, and other manufacturing processes. Compression & injection molding was the largest manufacturing process of GFRP composites in 2024 due to increased demand from the transportation, electrical & electronics, and aerospace & defense industries. Compression & injection molding are mostly used for making complex and intricate parts of vehicles. Layup, due to its low cost, is widely used for manufacturing composite parts for the wind energy, construction & infrastructure, transportation, consumer goods, and marine industries.
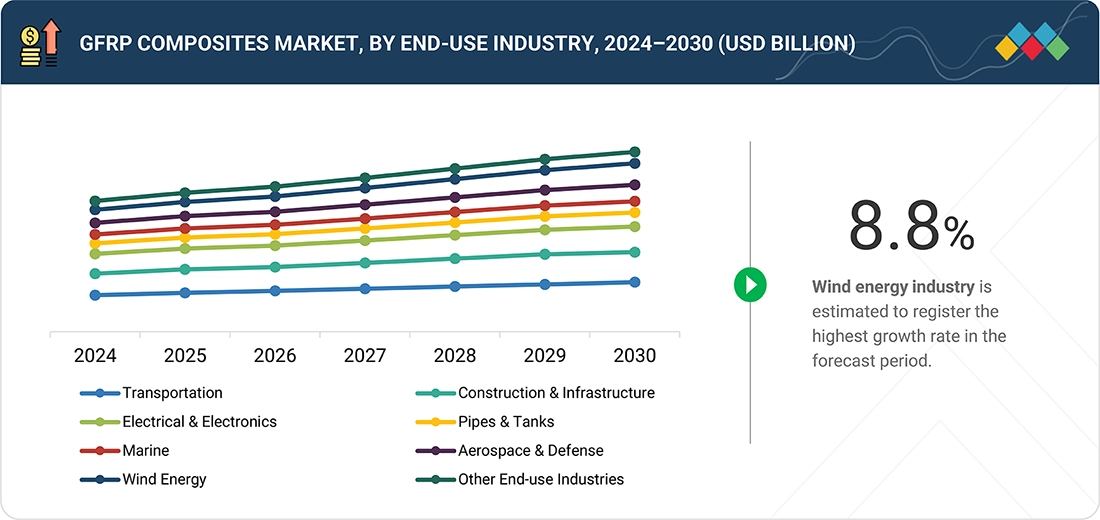
GFRP Composites Market, By End-use Industry
In the GFRP composites market, the transportation end-use industry held the largest market share in 2024, in terms of value. The strength-to-weight ratio of GFRP composites is higher than steel and aluminum. The reduction in weight for a given level of strength makes GFRP composites vital in the transportation industry. The rail sector is focused on reducing weight, increasing efficiency, and exploiting more lightweight and high-performance materials.
REGION
Asia Pacific to be fastest-growing region in global GFRP market during forecast period
The rapid industrial and urban expansion of countries such as China, India, Japan, and those in Southeast Asia is driving demand for GFRP composites in construction, automotive, aerospace, electronics, and renewable energy; the construction and automotive industries, in particular, illustrate greater boosts in industry development and market growth. New initiatives such as China's "Made in China 2025" and India's "Make in India", as well as smart city programs and renewable energy programs, are increasing domestic manufacturing and innovation of GFRP composite materials, as well as government policies that promote sustainable manufacturing and infrastructure developments.
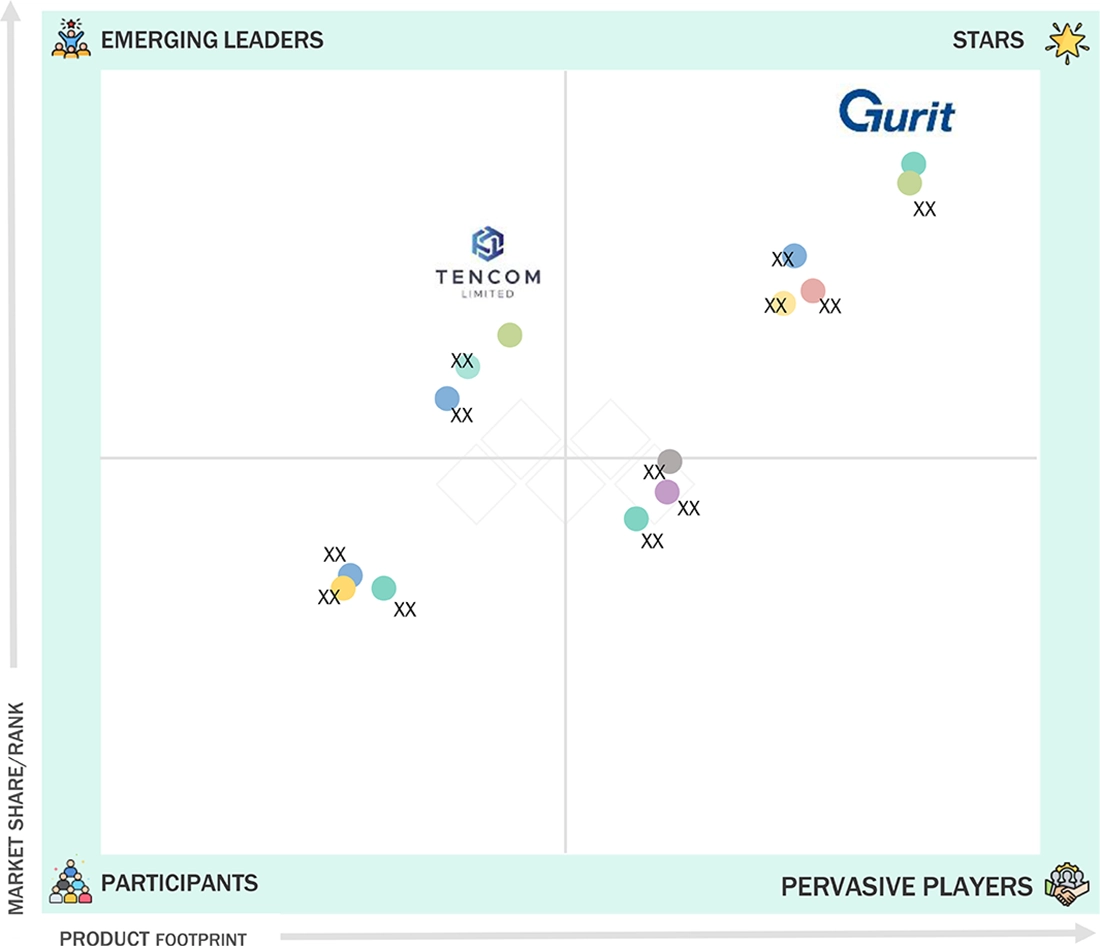
GFRP Composites Marke: COMPANY EVALUATION MATRIX
In the GFRP composite market matrix, Gurit Services AG leads with a strong market share and extensive product footprint, driven by its advanced GFRP composites products and high-performance materials widely adopted in the aerospace and construction & infrastructure industries. Tencom Limited (Emerging Leader) is gaining visibility with its pultruded fiberglass rods, fiberglass channels, poles, angles, and bars for building & construction applications, strengthening its position through innovation and niche product offerings. While Gurit Services AG dominates through scale and a diverse portfolio, Tencom Limited shows significant potential to move toward the leaders’ quadrant as demand for GFRP composites continues to rise.
Source: Secondary Research, Interviews with Experts, MarketsandMarkets Analysis
KEY MARKET PLAYERS
MARKET SCOPE
| REPORT METRIC | DETAILS |
|---|---|
| Market Size, 2024 (Value) | USD 61.4 Billion |
| Market Forecast, 2030 (value) | USD 84.3 Billion |
| Growth Rate | CAGR of 5.5% from 2025 to 2030 |
| Years Considered | 2022–2030 |
| Base Year | 2024 |
| Forecast Period | 2025–2030 |
| Units Considered | Value (USD Million/Billion), Volume (Kiloton) |
| Report Coverage | Revenue forecast, company ranking, competitive landscape, growth factors, and trends |
| Segments Covered |
|
| Regions Covered | North America, Asia Pacific, Europe, South America, Middle East & Africa |
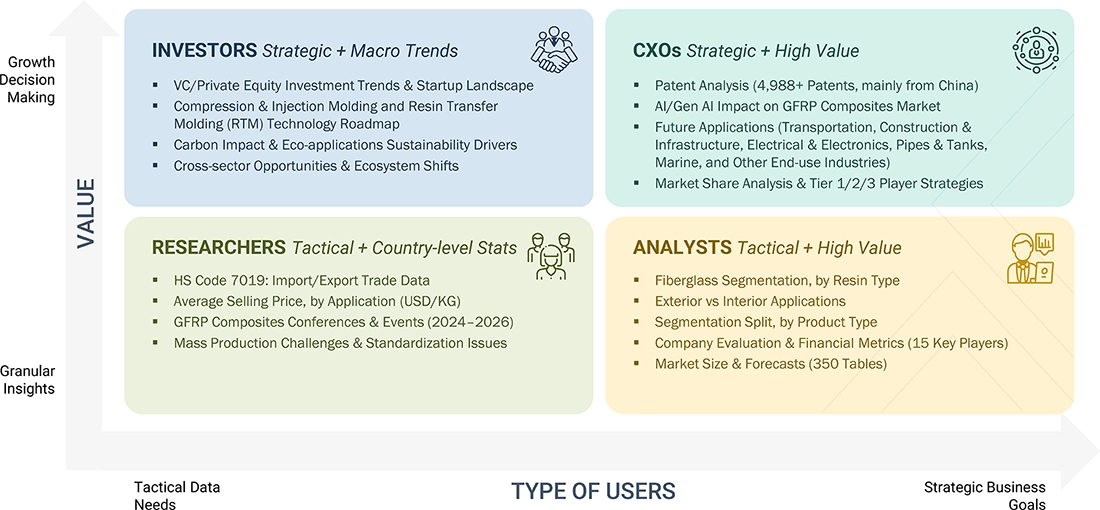
WHAT IS IN IT FOR YOU: GFRP Composites Marke REPORT CONTENT GUIDE
DELIVERED CUSTOMIZATIONS
We have successfully delivered the following deep-dive customizations:
| CLIENT REQUEST | CUSTOMIZATION DELIVERED | VALUE ADDS |
|---|---|---|
| Leading GFRP Composites Suppliers |
|
|
| Composite Material Manufacturer |
|
|
| Automotive Composite manufacturer |
|
|
| Raw Material Supplier |
|
|
| Defense Contractor |
|
|
RECENT DEVELOPMENTS
- March 2025 : Gurit re-signed a long-term materials supply contract for high-performance structures in the defense sector. USMI and Gurit have successfully worked together for many years to build composite products for multiple Government customers. This contract continues the supply of industry-leading products that have made Gurit a global leader in high-performance composite materials.
- March 2024 : Exel Composites and Foton International signed a partnership to supply pultruded glass fiber composite profiles. The agreement, signed in February 2024, saw the glass fiber profiles manufactured locally in China. These reduced both the maintenance requirements and weight of the vehicles, due to composites’ corrosion resistant and lightweight properties.
- October 2023 : Mitsubishi completed the acquisition of CPC Srl, an Italian leader in advanced composites automotive parts, strengthening vertical integration for automotive and industrial composites, with a strategic focus on both carbon and glass fiber composite applications.
Table of Contents
 Exclusive indicates content/data unique to MarketsandMarkets and not available with any competitors.
Methodology
The study involves two major activities in estimating the current market size for the GFRP composites market. Exhaustive secondary research was done to collect information on the market, peer market, and parent market. The next step was to validate these findings, assumptions, and sizing with industry experts across the value chain through primary research. Both top-down and bottom-up approaches were employed to estimate the complete market size. After that, market breakdown and data triangulation were used to estimate the market size of segments and subsegments.
Secondary Research
Secondary sources referred to for this research study include financial statements of companies offering GFRP composites and information from various trade, business, and professional associations. Secondary research has been used to obtain critical information about the industry’s value chain, the total pool of key players, market classification, and segmentation according to industry trends, to the bottom-most level, and regional markets. The secondary data was collected and analyzed to arrive at the overall size of the GFRP composites market, which was validated by primary respondents.
Primary Research
Extensive primary research was conducted after obtaining information regarding the GFRP composites market scenario through secondary research. Several primary interviews were conducted with market experts from both the demand and supply sides across major countries of North America, Europe, Asia Pacific, the Middle East & Africa, and South America. Primary data was collected through questionnaires, emails, and telephonic interviews. The primary sources from the supply side included various industry experts, such as chief experience officers (CXOs), vice presidents (VPs), business development/marketing directors, product development/innovation teams, related key executives from the GFRP composites industry, system integrators, component providers, distributors, and key opinion leaders. Primary interviews were conducted to gather insights such as market statistics, data on revenue collected from the products and services, market breakdowns, market size estimations, market forecasting, and data triangulation. Primary research also helped in understanding the various trends related to product type, end-use industry, and region. Stakeholders from the demand side, such as CIOs, CTOs, CSOs, and installation teams of the customers/end users who are using 3D printing services, were interviewed to understand the buyer’s perspective on the suppliers, products, component providers, and their current usage of GFRP composites and future outlook of their business, which will affect the overall market.
Breakup of Primary Research

To know about the assumptions considered for the study, download the pdf brochure
Market Size Estimation
The research methodology used to estimate the size of the GFRP composites market includes the following details. The market size was determined from the demand side. The market was upsized based on the demand for GFRP composites in different applications at the regional level. Such procurements provide information on the demand aspects of the GFRP composites industry for each end-use industry. For each end-use industry, all possible segments of the GFRP composites market were integrated and mapped.

Data Triangulation
After arriving at the overall size from the market size estimation process explained above, the total market was split into several segments and subsegments. The data triangulation procedure was implemented, wherever applicable, to complete the overall market engineering process and arrive at the exact statistics for various market segments and subsegments. The data was triangulated by studying various factors and trends from the demand and supply sides. Along with this, the market size was validated using both the top-down and bottom-up approaches.
Market Definition
GFRP composites comprise thermoset or thermoplastic polymer reinforced with fine glass fibers. Glass fiber is produced by melting glass in a furnace and then transferring the molten glass into superfine holes to create thin glass filaments/fibers. Glass fiber is available in different diameters according to the requirements of the application. GFRP composites are used for their superior mechanical strength, lightweight, corrosion, and thermal resistance properties, and they are easy to form in complex shapes. GFRP composites are created by embedding high-strength glass fibers within a polymer resin, resulting in a material that boasts remarkable strength and durability. The glass fibers in GFRP composites can be made from various types of glass, including E-glass, S-glass, and others, each with distinct properties suitable for specific applications. The polymer resin matrix can consist of thermosetting or thermoplastic resins, which provide different characteristics like enhanced strength, flexibility, and chemical resistance. The combination of these materials leads to a lightweight, corrosion-resistant, and high-strength material that can be customized to meet the specific requirements of diverse industries.
Stakeholders
- GFRP composites manufacturers
- GFRP Composites distributors and suppliers
- Universities, governments, and research organizations
- Associations and industrial bodies
- R&D institutes
- Environmental support agencies
- Investment banks and private equity firms
- Research and consulting firms
Report Objectives
- To define, describe, and forecast the GFRP composites market size in terms of volume and value
- To provide detailed information regarding the key factors, such as drivers, restraints, opportunities, and challenges influencing market growth
- To analyze and project the global GFRP composites market by source, application, and region
- To forecast the market size concerning five main regions (along with country-level data), namely, North America, Europe, Asia Pacific, the Middle East & Africa, and South America, and analyze the significant region-specific trends
- To strategically analyze micro markets with respect to individual growth trends, prospects, and contributions of the submarkets to the overall market
- To analyze the market opportunities and the competitive landscape for stakeholders and market leaders
- To assess recent market developments and competitive strategies, such as agreements, contracts, acquisitions, and product developments/product launches, to draw the competitive landscape
- To strategically profile the key market players and comprehensively analyze their core competencies
Key Questions Addressed by the Report
Which are the major companies in the GFRP Composites Market?
Key companies in the broader composites market that include GFRP composites are Owens Corning, Toray Industries, Inc., Hexcel Corporation, Mitsubishi Chemical Corporation, and SGL Carbon, among others.
Which end users in the GFRP Composites Market are likely to exhibit the highest CAGR during the forecast period?
Transportation (especially automotive and aerospace), construction & infrastructure, and renewable energy (e.g., wind turbines) are expected to exhibit the highest growth rates due to demand for lightweight and corrosion-resistant materials.
Which offerings in the GFRP Composites Market are likely to drive growth over the coming years?
High-performance glass fiber reinforced polymer composites with advanced resin systems (e.g., epoxy, vinyl ester) designed for structural applications in automotive, wind energy, and infrastructure will drive growth.
What are the drivers and opportunities for the GFRP Composites Market?
Growth is driven by the shift from metals to lightweight composites in transportation, rapid infrastructure expansion, increasing renewable energy installations, and the development of hybrid material systems, offering opportunities for innovation and new applications
What are the restraints and challenges for the players in the GFRP Composites Market?
Challenges include high manufacturing costs, recycling and end-of-life issues for composites, raw material volatility, and the need for advanced processing technologies to meet performance and sustainability requirements.
Need a Tailored Report?
Customize this report to your needs
Get 10% FREE Customization
Customize This ReportPersonalize This Research
- Triangulate with your Own Data
- Get Data as per your Format and Definition
- Gain a Deeper Dive on a Specific Application, Geography, Customer or Competitor
- Any level of Personalization
Let Us Help You
- What are the Known and Unknown Adjacencies Impacting the GFRP Composites Market
- What will your New Revenue Sources be?
- Who will be your Top Customer; what will make them switch?
- Defend your Market Share or Win Competitors
- Get a Scorecard for Target Partners

Custom Market Research Services
We Will Customise The Research For You, In Case The Report Listed Above Does Not Meet With Your Requirements
Get 10% Free CustomisationTESTIMONIALS

We at Nissan Chemicals Corporation have been clients of MarketsandMarkets for more than a year now. We recently consulted MarketsandMarkets for a study, the team at MarketsandMarkets was extremely professional and organized. The business insights were very detailed and aligned well with our expectations that really helped us formulate the Business Plans and device new strategies for development themes. MarketsandMarkets offers a unique combination of expertise and dedicated engagement model. Their research findings have helped us in designing our Pricing Strategy which will make it easier for us to predict the future sales and profits for the next ten years. We look forward to working with MarketsandMarkets in the future.
VP of Strategy & New Business Development
Leading Specialty Chemical Company
The MarketsandMarkets Engagement Model, composed of both the Knowledge Store and advisory custom research, has greatly helped us in understanding our markets and making strategic decisions. The Knowledge Store is a fast way to allow everyone in our organization to understand more about most any market they are interested in. The ability to then get custom research done and get answers to specific strategic questions and market insight has been spectacular. The Markets and Markets team feel more like colleagues than vendors and their services have helped us change our culture where statements of things like growth opportunities and competitive position are always backed by industry research.

Rich Gibson,
Director, Corporate Strategy
Milliken & Company,
Leading Industrial Manufacturer of specialty chemical, floor covering, performance and protective textile materials, and healthcaremilliken.com
MarketsandMarkets is a trusted resource that helps us to better understand markets that are near-adjacencies-whether its technology, value chain or geography. Their Knowledge Store platform provides a dashboard of markets and their characteristics which is easy to use and saves us time.
Adam Shaw,
Market Development and Strategy Manager
AdvanSix Inc. USA,
An American Leader in Chemicalswww.advansix.com
The Knowledge Store from MarketsandMarkets is a valuable tool which has helped my team acquire greater insight in to the end markets that our business serves. This has enabled us to help our company build stronger strategies throughout our planning process.
TOSHIO KINOSHITA
Senior Chif Consultion Research & Consulting Division
Mitsubishi Chemical Research Corporation,
Leading Manufacturer of Chemical Productswww.mitsubishichem-res.co.jp/en/

We recently engaged with MarketsandMarkets for a study, the team not only clearly understood our business objectives but was also extremely professional in the way they handled the entire project. The study was efficiently conducted in a phase-wise manner, and the engagement model furnished us with high-quality business insights that far exceeded our expectations at each phase. We were especially happy that MarketsandMarkets could provide us with both, an English as well as a Japanese version of the study. A special thanks to the Analyst Team and Client Services Team, whose fluency in Japanese enhanced our comfort level, as we could converse with them in our preferred language.
Independent entrepreneurs
Arrow Precision
We approached MarketsandMarkets for study on Proppants Market, and their work exceeded our expectations. The study conducted was comprehensive and enabled us to view the market through the various dimensions. In addition, the team was extraordinarily responsive throughout the process and resolved our queries on time. I strongly recommend MarketsandMarkets and will certainly consider them for additional market assessments we will need in the future.
Global engineering company, Japan
Deputy Manager,
Strategic Planning OfficeThe high-quality insights shared by the MarketsandMarkets team helped us understand the pharmaceutical plant designers in a specific geography. It also captured the risks that we may likely face in communicating with our potential partners. The study would enable us identify partners, which would impact our future growth.
Growth opportunities and latent adjacency in GFRP Composites Market


Bhavesh
Sep, 2016
Need information on FRP market.
Tanya
Dec, 2017
Thermoplastic Bio composites market by manufacturing process .
SURYA
Jul, 2017
Best price for GFRP market report.
jaemyung
Apr, 2014
Data on GFRP market size by semi finished product, End-customer application, Competitor landscape, and their winning strategies in the market..
Dipak
Jun, 2014
Composite market in different sectors.
Mithun
Dec, 2019
Market information on global Polymer composites market.
Oleg
Sep, 2019
Market data on global GFRP market.