
Gold Nanoparticles Market

Gold Nanoparticles Market by Process (Physical, Chemical, Biological), Application (Imaging, Targeted Drug Delivery, Proton Therapy, In-Vitro Assays, Sensors, Probes, Catalysis), End-Use Industry and Region - Global Forecast to 2029
Updated on : November 27, 2025


GOLD NANOPARTICLES MARKET OVERVIEW
Source: Secondary Research, Interviews with Experts, MarketsandMarkets Analysis
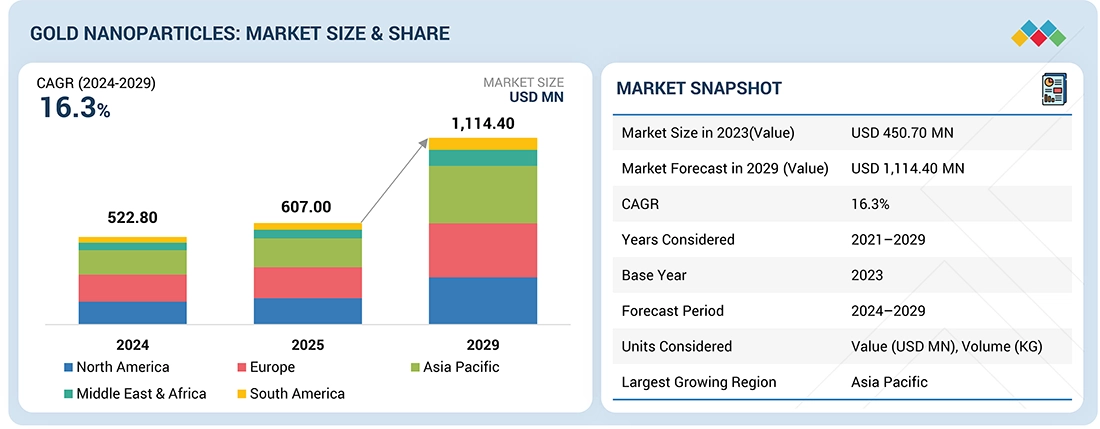
The global gold nanoparticles market was valued at USD 522.8 million in 2024 and is projected to reach USD 1,114.4 million by 2029, growing at 16.3% cagr from 2024 to 2029. Gold nanoparticles are used in various applications for various end-use industries, such as pharmaceutical & healthcare, electrical & electronics, chemical, and personal care & cosmetics. The growth of the gold nanoparticles market is driven by the growing demand for gold nanoparticles in electrical & electronics end use industry.
KEY TAKEAWAYS
-
BY PROCESSBy process includes chemical, physical and biological process. Chemical techniques typically involve reducing gold salts like HAuCl4 with agents such as citrate or sodium borohydride, offering control over nanoparticle size and dispersion, which is ideal for most research and industrial applications. Physical methods, such as laser ablation and sputtering, convert bulk gold into nanoparticles without chemical reactions and yield high-purity products, although they require costly equipment and offer limited scalability. Biological (green) synthesis utilizes extracts from plants, bacteria, or fungi to reduce and stabilize gold ions, resulting in eco-friendly nanoparticles, but these processes face challenges in reproducibility and production scale.
-
BY APPLICATIONThe gold nanoparticles market spans key applications including imaging, targeted drug delivery, proton therapy, in-vitro assays, sensors, probes, catalysis and other applications. In medical imaging, gold nanoparticles serve as powerful contrast agents for techniques like CT, MRI, and fluorescence imaging, enhancing sensitivity and accuracy in disease diagnostics. Their ease of functionalization makes them ideal carriers for targeted drug delivery, allowing precise release of therapeutics at disease sites while minimizing side effects. In in-vitro assays, gold nanoparticles help detect or quantify biomolecules because of their strong surface plasmon resonance and colorimetric properties, enabling rapid and sensitive diagnostics. During proton therapy and as radiotherapeutic adjuvants, gold nanoparticles improve tumor targeting and dose effectiveness through their high atom density and radiation absorption. Engineered as molecular probes, gold nanoparticles amplify signals for imaging or sensing applications, offering specificity and multiplexed detection. In catalysis, their large surface area facilitates numerous chemical reactions, including environmental and industrial processes. As sensors, gold nanoparticles are used to detect ions, molecules, or pathogens with high selectivity by observing changes in optical or electrical signals induced by binding events
-
BY END_USE INDUSTRYThe gold nanoparticles market serves diverse end-use industries including pharmaceutical & healthcare, chemical, electrical & electronics, personal care & cosmetics and other end-use industries. Gold nanoparticles are widely used across pharmaceutical and healthcare fields as drug carriers, diagnostic agents, and therapeutic enhancers due to their biocompatibility and ability to target specific cells, aiding the treatment of cancer, diabetes, heart diseases, and neurological disorders. In electrical and electronics applications, their unique conductivity and optical properties enable the development of sensitive sensors, memory devices, and photovoltaic cells, improving device efficiency and miniaturization. Chemically, gold nanoparticles serve as efficient catalysts for environmental and industrial reactions, accelerating processes such as oxidation and reduction while operating under mild conditions. In personal care and cosmetics, their stability and antibacterial properties contribute to advanced formulations in creams, lotions, and skin treatments, offering benefits ranging from improved product texture to skin rejuvenation.
-
BY REGIONAsia Pacific is expected to grow fastest, with a CAGR of 18.6%, primarily driven by rapid technological advancements, expanding healthcare infrastructure, and increasing R&D investments in nanotechnology. Countries such as China, Japan, South Korea, and India are leading in biomedical research and electronics manufacturing, where gold nanoparticles are essential for targeted drug delivery, diagnostics, imaging, and high-performance sensors. Strong government support through national nanotechnology initiatives, rising demand for precision medicine, and the growing electronics and semiconductor industries are further accelerating market adoption.
-
COMPETITIVE LANDSCAPEThe market is driven by strategic collaborations, capacity expansions, and technological innovations from leading players such as BBI Solutions (UK), Cytodiagnostics Inc (Canada), Fortis Life Sciences, LLC. (US), Meliorum Technologies, Inc (US), TANAKA PRECIOUS METAL GROUP Co., Ltd. (Japan). These companies are advancing nanoparticles and broadening end-use adoption, reflecting the growing demand for gold nanoparticles productions in various applications
Gold nanoparticles are gold particles with a size of 1-100 nanometres. These gold nanoparticles exhibit unique optical, electronic and chemical properties due to their nanoscale dimensions making them highly valuable in various applications. These particles have distinctive colors depending on their size and shape which is due to localized surface plasmon resonance, which makes it useful in sensors & imaging. The synthesis of gold nanoparticles can be achieved through various methods which includes chemical reduction, laser ablation, & electrochemical approaches.
TRENDS & DISRUPTIONS IMPACTING CUSTOMERS' CUSTOMERS
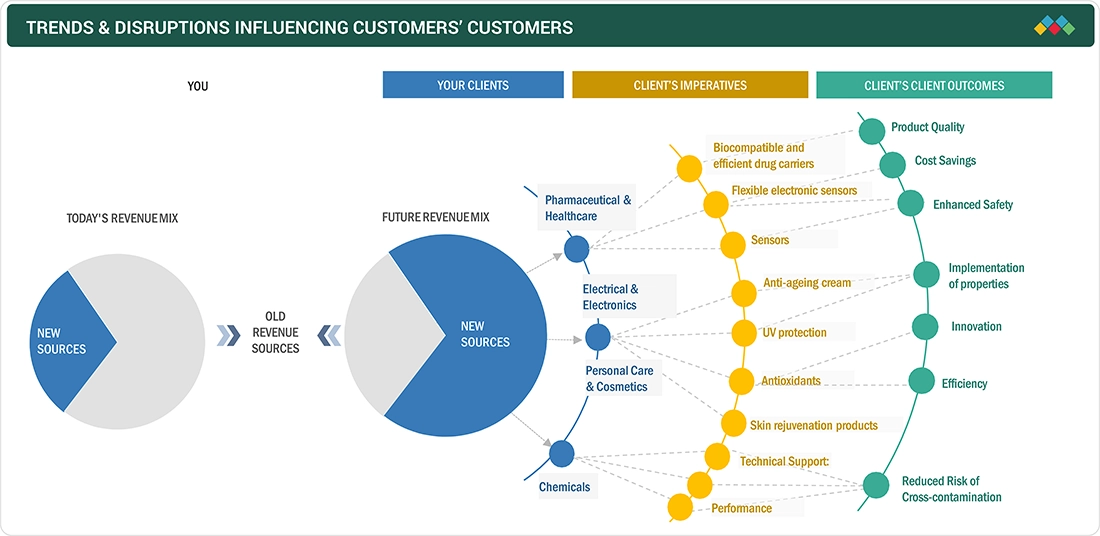
Emerging trends and disruptions in the gold nanoparticles market are reshaping its commercial and scientific landscape. A key trend is the shift toward green synthesis methods, replacing toxic chemicals with plant-based or microbial processes to improve sustainability. In healthcare, AI-driven nanoparticle design and personalized nanomedicine are enabling more precise drug delivery and diagnostic tools. The integration of gold nanoparticles in flexible and wearable electronics is also disrupting traditional materials in sensors and energy devices. Moreover, the rising use of plasmonic nanoparticles in cancer therapy and rapid diagnostics is accelerating clinical adoption. Collaborations between nanotech startups, academic institutions, and large corporations are fast-tracking commercialization, positioning gold nanoparticles as a cornerstone in next-generation biomedical, electronic, and environmental technologies.
Source: Secondary Research, Interviews with Experts, MarketsandMarkets Analysis
GOLD NANOPARTICLES MARKET DYNAMICS
Level
-
High demand for gold nanoparticles in electrical & electronics end-use industry

-
Unique properties of gold nanoparticles

Level
-
Toxicity concerns of gold nanoparticles

-
Stringent regulations impacting market development

Level
-
Increase in R&D efforts in nanotechnology applications

-
Emerging applications in various end-use industries

Level
-
High time consumption for certain synthesis methods

Source: Secondary Research, Interviews with Experts, MarketsandMarkets Analysis
Driver: High demand for gold nanoparticles in electrical & electronics end-use industry
The increasing application of gold nanoparticles in the electrical and electronics sector is a major factor contributing to increase in the overall gold nanoparticles market. The main reason for the increase in demand of gold nanoparticles is superior electrical conductivity, chemical stability, and nanoscale dimension, which make them suitable for numerous high-end applications. In addition to that gold nanoparticles have high oxidation rate compared to other conventional metals. Gold nanoparticles also play a major role in emerging technologies such as nano-sensors, touchscreens, and photodetectors. The growth of 5G networks, Internet of Things (IoT), and wearable technology has also created a need for high-conductivity and high-efficiency materials, and gold nanoparticles have given excellent performance in these fields. In addition, their use in semiconductor production, chip interconnects, and memory storage devices is on the increase as producers are looking for higher efficiency and resilience. With the continued miniaturization trend and the demand for low-power, high-speed electronic components continuing to rise, gold nanoparticles are poised to experience substantial growth. These unique properties of gold nanoparticles make them a unique product which will tend to increase its demand in electrical & electronics end use industry
Restraint: Toxicity concerns of gold nanoparticles
Toxicity issues related to gold nanoparticles present a major check on the development of the market for gold nanoparticles. Although gold is usually seen as biocompatible, experiments have indicated that gold nanoparticles have the potential for cytotoxicity based on their size, form, surface functionality, and dosage. Their entry into cell membranes and potential to stockpile within cells is problematic from the view of long-term health effects, particularly for drug & healthcare sectors. Issues such as oxidative stress, DNA damage, and inflammation have been noted in some studies, which have raised regulatory and safety issues. The environmental effects of gold nanoparticles are increasingly of concern. Released into the environment by industrial or medical uses, they may remain in ecosystems and, potentially, interfere with biological processes in aquatic and terrestrial organisms. Regulatory agencies, such as U.S. Food and Drug Administration (FDA) and European Medicines Agency (EMA), are laying down regulations for the use of nanoparticles in consumer products, pharmaceuticals, and food packaging, and this can suppress market growth. Although research on the toxicity of nanoparticles is increasing, companies must spend on developing safer formulations and extensive research on the toxicity of nanoparticles to overcome regulatory hurdles.
Opportunity: Increase in R&D efforts in nanotechnology applications
The growing research and development (R&D) in nanotechnology provide a huge chance for the market of gold nanoparticles, especially within the pharmaceuticals and electrical markets. In pharmaceuticals, the gold nanoparticles are transforming targeted delivery systems for medicines, where the accuracy and potency of cancer medicines are improved by them. For instance, CytImmune Therapeutics has synthesized gold nanoparticle-based drug delivery system named Aurimune, that deliver anti-cancer drugs directly to tumor cells, minimizing side effects. In the field of electronics, R&D is leading to the use of gold nanoparticles in printed and flexible electronics. For instance, conductive inks based on gold nanoparticles are utilized in luxury touch screen displays as well as wearable electronic products to enhance performance and shelf life. Besides, researchers are integrating gold nanoparticles into future semiconductor chips as well as memory storage devices for higher performance and miniaturization. As other industries rely more on nanotechnology for innovation, gold nanoparticles will be a growing industry. Companies that capitalize on these R&D advances will be well-positioned to capitalize on new high-tech applications, spurring market expansion. With increased investment in nanotechnology by private industry and governments, the market for gold nanoparticles is expected to grow. Companies that capitalize on R&D-driven innovations will have a competitive edge, putting gold nanoparticles at the forefront of future high-tech applications.
Challenge: High time consumption for certain synthesis methods
The time-intensive aspect of some synthesis techniques is a major challenge for the gold nanoparticles market, especially in industries that require high-volume production with precision. In the pharmaceutical industry, gold nanoparticle synthesis in drug delivery and imaging processes tends to necessitate complicated procedures like citrate reduction or seed-mediated growth. These techniques can be time-consuming owing to numerous purification steps and the requirement of exact size and shape control. For instance, in cancer treatment, gold nanoparticles need to be synthesized with uniformity to allow for efficient drug delivery targeting, thus prolonging the overall manufacturing time and cost. This holdup can decelerate commercialization of nanoparticle-based drugs, affecting drug companies that desire large-scale clinical deployment. Likewise, in the electrical sector, making gold nanoparticles for use in conductive inks and nanoelectronics involves controlled synthesis to ensure conductivity and stability. Techniques like chemical vapor deposition (CVD) and electrochemical synthesis may take hours or days to optimize particle size and dispersion. Such prolonged production time restricts scalability of gold nanoparticles in high-volume applications such as printed electronics, flexible displays, and semiconductor fabrication. In response to this, scientists are striving to create methods of synthesis that are quicker, more efficient, like microwave-based or green syntheses, to enhance production velocity without compromising on the quality of nanoparticles.
Gold Nanoparticles Market: COMMERCIAL USE CASES ACROSS INDUSTRIES
| COMPANY | USE CASE DESCRIPTION | BENEFITS |
|---|---|---|
 |
Specializes in high-quality colloidal gold nanoparticles used in lateral flow assays and immunodiagnostics for accurate, rapid medical testing.. | Ensures exceptional particle consistency and conjugation stability, enhancing assay sensitivity and reliability in large-scale diagnostics manufacturing. |
 |
Develops functionalized gold nanoparticles for biosensing, molecular diagnostics, and advanced life science research applications. | Provides tailored surface chemistry solutions that improve assay performance, reproducibility, and integration in next-generation diagnostics. |
 |
Manufactures gold nanoparticle formulations for biomedical research, catalysis, and electronic applications under its Sigma-Aldrich brand. | Offers high-purity, research-grade nanoparticles with global supply reliability, regulatory compliance, and scalable production support. |
|
|
Focuses on precision-engineered gold nanoparticles for immunolabeling, microscopy, and nanomedicine research. | Delivers monodisperse particles with tunable optical and surface properties, enabling high reproducibility in analytical and imaging assays. |
 |
Produces customized gold nanoparticles and nanoconjugates for targeted drug delivery, imaging, and biosensor development. | Enables flexible design with controlled particle size and surface functionality, supporting personalized medicine and innovative nanobiotech solutions. |
Logos and trademarks shown above are the property of their respective owners. Their use here is for informational and illustrative purposes only.
GOLD NANOPARTICLES MARKET ECOSYSTEM
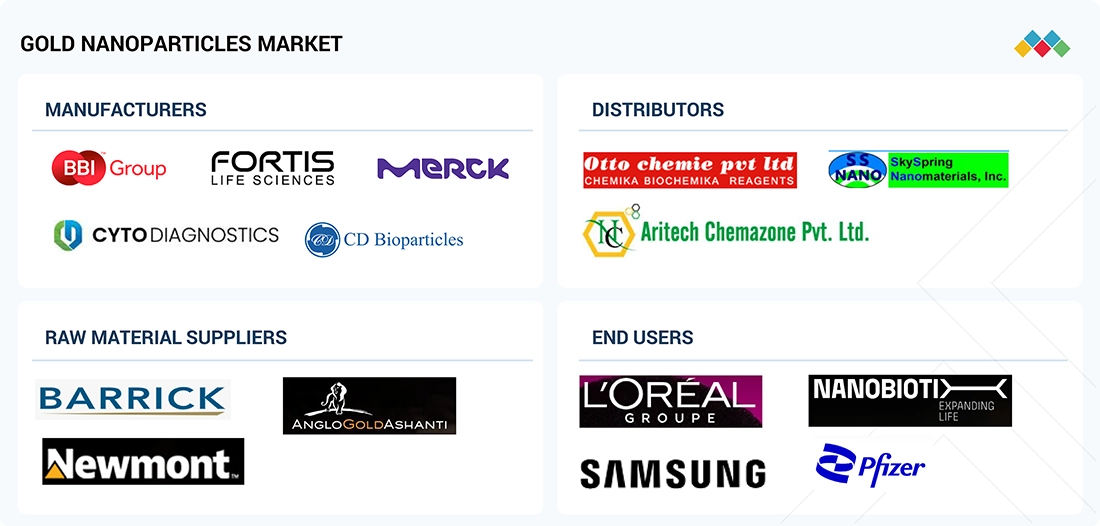
The ecosystem of the gold nanoparticles market is a well-structured value chain connecting raw material suppliers, manufacturers, distributors, and end users. Raw material suppliers provide high-purity gold salts and reducing agents essential for nanoparticle synthesis. Manufacturers including specialized nanomaterial producers and research-based chemical firms focus on tailoring particle size, surface chemistry, and functionality for specific applications. These products are then channeled through distributors and chemical suppliers, who cater to diverse industrial and academic clients. Finally, end users span multiple sectors: the healthcare and life sciences industry for drug delivery, diagnostics, and imaging; the electronics and semiconductor industry for conductive inks and sensors; and the chemical and environmental sectors for catalysis and detection applications.
Logos and trademarks shown above are the property of their respective owners. Their use here is for informational and illustrative purposes only.
GOLD NANOPARTICLES MARKET SEGMENTS
Source: Secondary Research, Interviews with Experts, MarketsandMarkets Analysis
Gold Nanoparticles Market, By Process
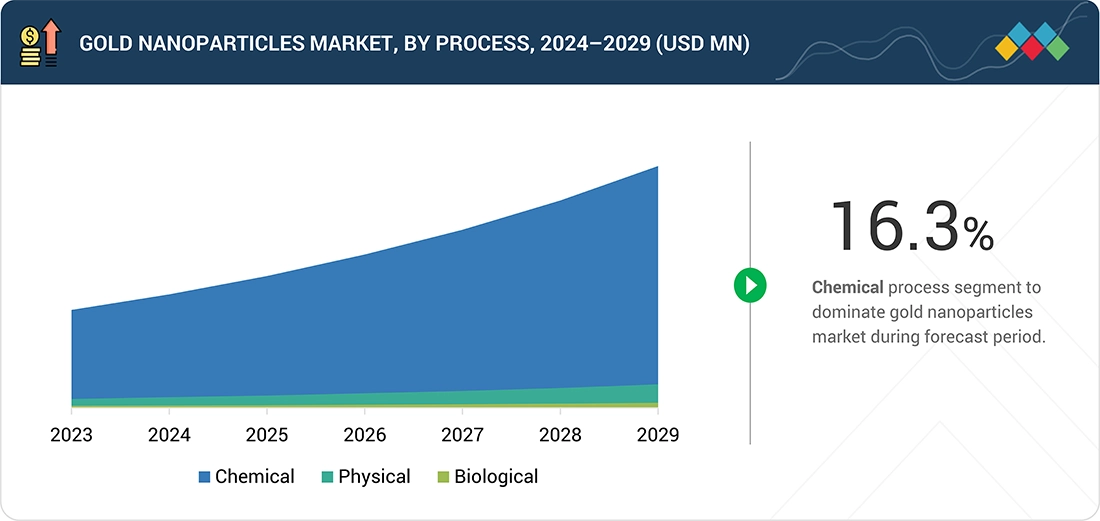
Chemically synthesized gold nanoparticles have the largest market share in terms of value and volume, The control of shape, stability, and functionalization control makes them extremely suitable for a wide range of high-performance applications. Chemical synthesis methods such as the Turkevich method, Brust-Schiffrin method, and seed-mediated growth can be used to engineer nanoparticles with defined surface properties, which is critical for many industries including biomedicine, electronics, and catalysis. In comparison to biological or physical synthesis, chemical approaches are more scalable, reproducible, and yield-high, hence the best option when commercial production is needed. Chemically synthesized gold nanoparticles, which are used extensively in biosensors, drug delivery, and diagnostic imaging in the pharmaceutical sector, include Cytodiagnostics and Nanopartz functionalized gold nanoparticles that are utilized for rapid disease diagnosis and targeted cancer treatments. For electronics end use industry, companies like Strem Chemicals distribute high-purity gold nanoparticles used in printed electronics, conductive inks, and nano-sensors, for which uniform particle size is a must to ensure maximum conductivity. Nanopartz, Cytodiagnostics, Strem Chemicals, and Meliorum Technologies are some of the leading manufacturers of chemically synthesized gold nanoparticles. They distribute their products to industry that requires high-performance, custom gold nanoparticles, confirming the pre-eminence of chemically processed types in international markets.
Gold Nanoparticles Market, By Application
Proton therapy application is projected to be the highest market share holding application in the gold nanoparticles market. Proton therapy is one of the groundbreaking advancements in cancer radiotherapy. Despite its advancements proton therapy faces challenges in precision and efficacy, but recent research has highlighted the potential of gold nanoparticles to enhance proton therapy outcomes. Gold nanoparticles have high atomic number and favourable biological properties through which it acts as a radiosensitizers by amplifying generation of secondary electrons and reactive oxygen species upon proton irradiation. This enhances DNA damage in tumor cells while preserving healthy tissues. Thus gold nanoparticles act as a backbone for enhancing proton therapy.
Gold Nanoparticles Market, By End-Use Industry
The pharmaceuticals & healthcare industry is expected to have the highest market share in end-use industry in the gold nanoparticles market. The demand for gold nanoparticles is rising in pharmaceuticals & healthacre industry due to its superior performance characteristics, including biocompatibility, optical properties, surface properties and others. Top leading pharmaceutical manufactures such as Gilead Sciences, Inc., and GSK plc. have already adopted gold nanoparticles for vaccine development and kits. Pharmaceuticals & healthcare end use industry is tend to grow with high rate and which will increase the consumption of gold nanoparticles.
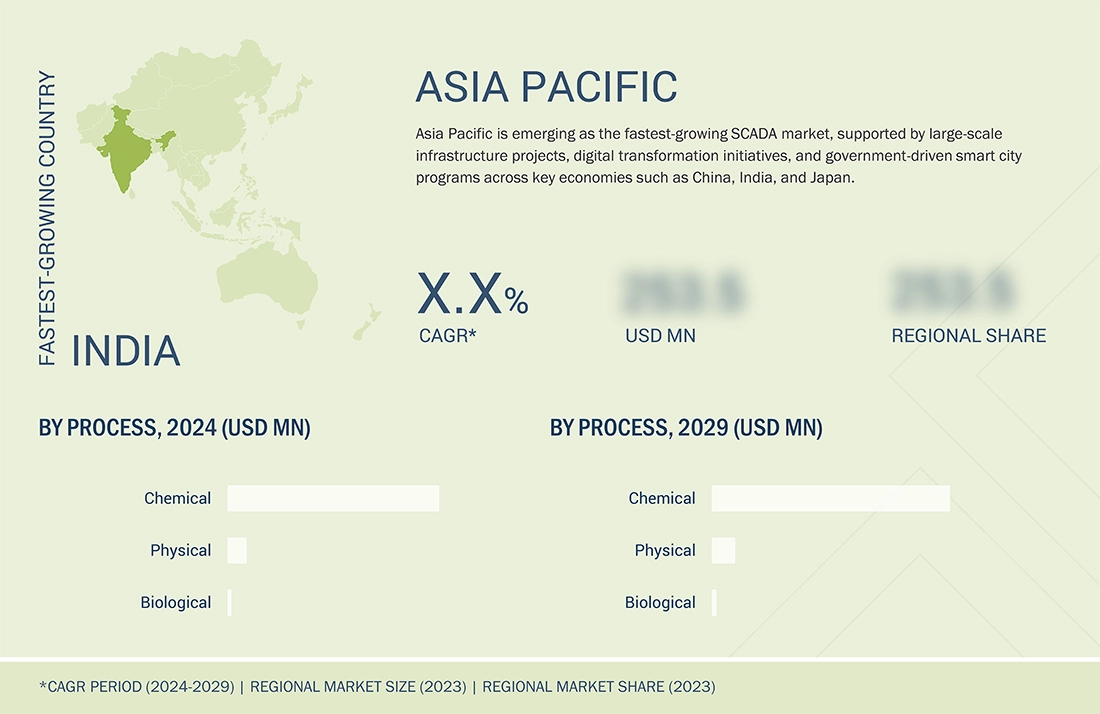
REGION
Asia Pacific to be fastest-growing region in global gold nanoparticles market during forecast period
Asia Pacific is the fastest growing market for gold nanoparticles because of its strong demand from pharmaceuticals & healthcare, which is a driving factor for high-performance materials such as gold nanoparticles. The region is dominated by large pharmaceuticals manufacturers, Sun Pharmaceutical Industries Ltd., Sapien Biosciences, which have comprehensive use of gold nanoparticles in various applications. Asia Pacific region has major countries such as India, China which has highest population in the world, and which will tend to increase the demand for pharmaceuticals & healthcare needs. Second, Asia Pacific region is home to various gold nanoparticles manufacturers such as ARITECH CHEMAZONE PVT LTD., Oparin Biotech Pvt Ltd and others.
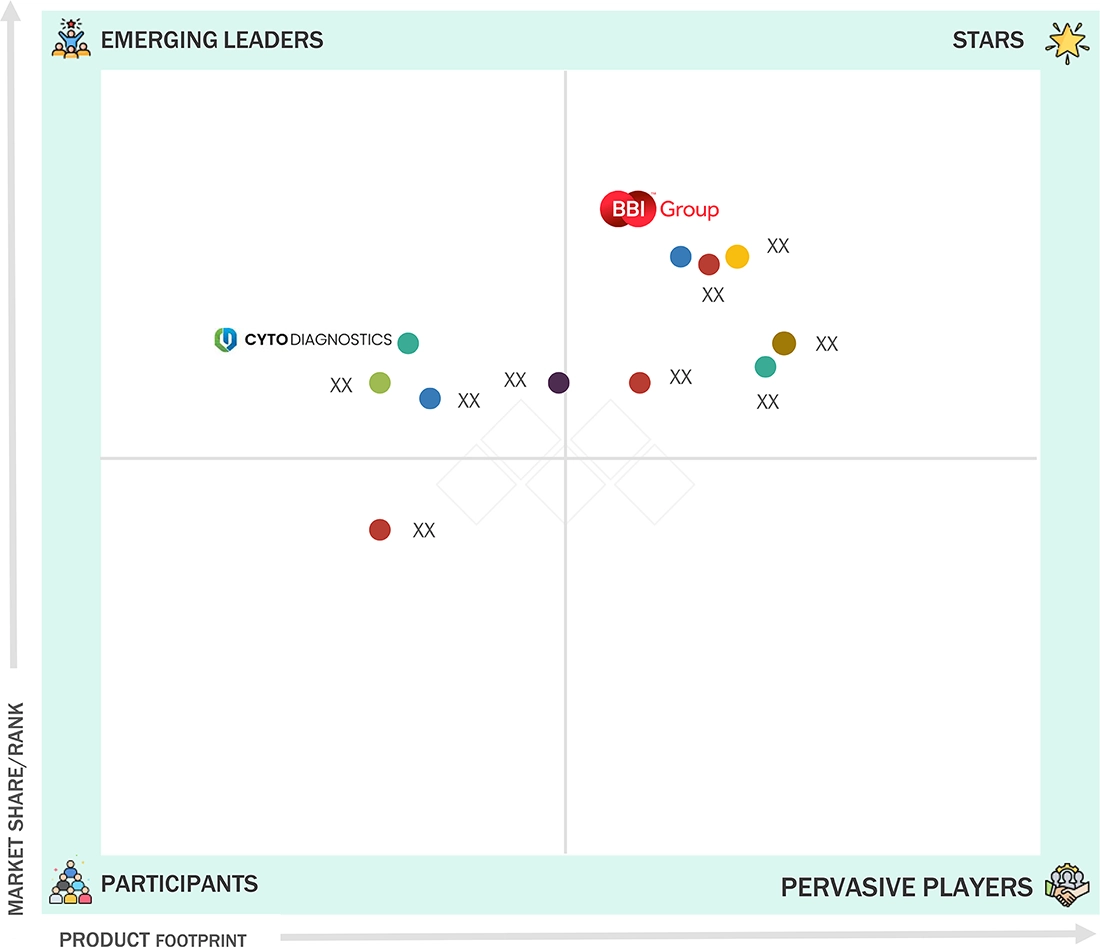
Gold Nanoparticles Market: COMPANY EVALUATION MATRIX
In the gold nanoparticles market matrix, BBI Solutions (Star), a UK company, leads the market through its manufacturing and distribution of gold nanoparticles. The company has established itself as a pioneer in colloidal gold nanoparticle synthesis, offering highly uniform and customizable nanoparticles that cater to the demanding needs of lateral flow assays, immunodiagnostics, and biosensors. Its commitment to consistent quality, large-scale production capability, and regulatory compliance has made it a preferred supplier for major healthcare and biotechnology firms worldwide. Moreover, BBI’s emphasis on innovation in nanoparticle stabilization, surface modification, and conjugation chemistry enables superior performance in diagnostic sensitivity and assay reproducibility.
Source: Secondary Research, Interviews with Experts, MarketsandMarkets Analysis
GOLD NANOPARTICLES MARKET PLAYERS
MARKET SCOPE
| REPORT METRIC | DETAILS |
|---|---|
| Market Size in 2023 (Value) | USD 450.7 Million |
| Market Forecast in 2029 (value) | USD 1,114.4 Million |
| Growth Rate | CAGR of 16.3% from 2025–2029 |
| Years Considered | 2021–2029 |
| Base Year | 2023 |
| Forecast Period | 2024–2029 |
| Units Considered | Value (USD Million), Volume (KG) |
| Report Coverage | Revenue forecast, company ranking, competitive landscape, growth factors, and trends. |
| Segments Covered |
|
| Regions Covered | North America, Asia Pacific, Europe, South America, Middle East & Africa |
WHAT IS IN IT FOR YOU: Gold Nanoparticles Market REPORT CONTENT GUIDE
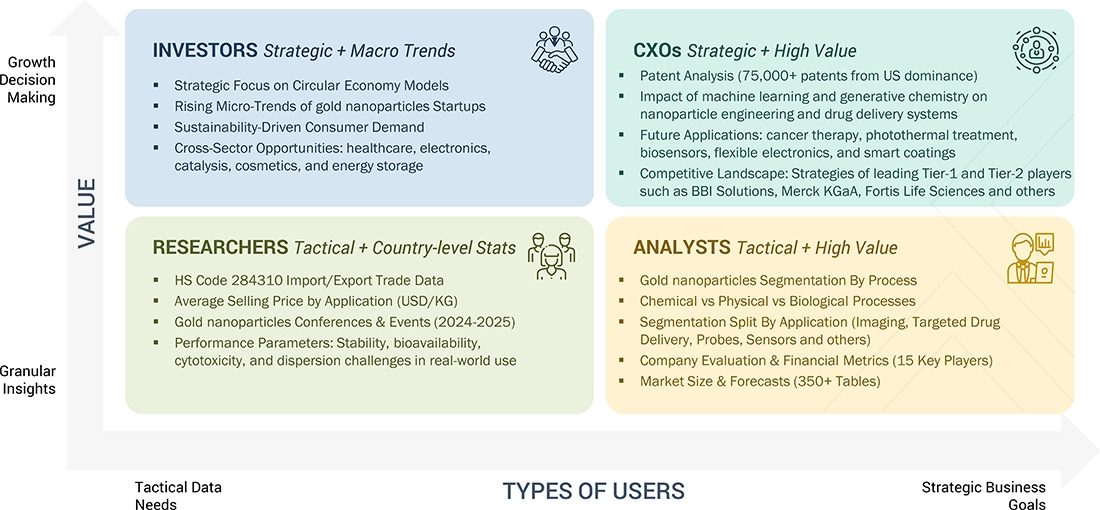
DELIVERED CUSTOMIZATIONS
We have successfully delivered the following deep-dive customizations:
| CLIENT REQUEST | CUSTOMIZATION DELIVERED | VALUE ADDS |
|---|---|---|
| Biotech & Diagnostic Device Manufacturer | • Competitive profiling of gold nanoparticles producers by size uniformity, surface chemistry, and conjugation expertise • Mapping applications across immunoassays, biosensors, and imaging • Cost benchmarking vs. quantum dots and silver nanoparticles | • Identify high-performance suppliers for diagnostic reagents • Detect shifts in assay technology preferences • Highlight partnerships for precision nanodiagnostic innovation |
| Pharmaceutical Company | • Evaluation of gold nanoparticles in targeted drug delivery, photothermal therapy, and vaccine adjuvants • Clinical pipeline and regulatory landscape mapping • Assessment of GMP-grade nanoparticle suppliers | • Support adoption of nanomedicine strategies • Uncover cost and performance benefits vs. polymeric carriers • Strengthen IP and clinical positioning in precision oncology |
| Electronics & Semiconductor OEM | • Analysis of conductive gold nanomaterials for printed electronics, flexible circuits, and sensors • Benchmarking performance vs. silver nanowires and graphene inks • Supplier landscape by purity, dispersion, and conductivity | • Enable integration of gold nanoparticles into high-performance electronic systems • Identify cost–efficiency trade-offs in miniaturization • Accelerate product innovation in flexible and wearable electronics |
| Academic & Research Institutions | • Mapping of gold nanoparticles synthesis techniques (chemical reduction, seed-mediated, green synthesis) • Comparison of particle stability and biocompatibility • Funding and patent trend analysis by application area | • Reveal emerging research opportunities and funding hotspots • Facilitate collaboration with commercial nanoparticle producers • Guide focus on scalable, sustainable synthesis methods |
RECENT DEVELOPMENTS
- June 2024 : Merck had announced a significant investment of USD 67 million to establish a new quality control facility at its headquarters in Darmstadt, Germany, which is set to enhance its Life Science business.
- June 2024 : Atomo Diagnostics and BBI Solutions have formed a strategic partnership to enhance rapid diagnostics by integrating Atomo’s innovative rapid test platforms with BBI’s expertise in lateral flow assay development and digital app solutions
- July 2023 : Fortis Life Sciences acquired International Point of Care (IPOC) which expanded Fortis's capabilities in providing customizable, end-to-end solutions for the diagnostics industry, which could potentially enhance the development and manufacturing of diagnostic tests that utilize gold nanoparticles for detection.
Table of Contents
 Exclusive indicates content/data unique to MarketsandMarkets and not available with any competitors.
Methodology
The study involves two major activities in estimating the current market size for the gold nanoparticles market. Exhaustive secondary research was done to collect information on the market, peer market, and parent market. The next step was to validate these findings, assumptions, and sizing with industry experts across the value chain through primary research. Both top-down and bottom-up approaches were employed to estimate the complete market size. After that, market breakdown and data triangulation were used to estimate the market size of segments and subsegments.
Secondary Research
Secondary sources referred to for this research study include financial statements of companies offering gold nanoparticles and information from various trade, business, and professional associations. Secondary research has been used to obtain critical information about the industry’s value chain, the total pool of key players, market classification, and segmentation according to industry trends to the bottom-most level and regional markets. The secondary data was collected and analyzed to arrive at the overall size of the gold nanoparticles market, which was validated by primary respondents.
Primary Research
Extensive primary research was conducted after obtaining information regarding the gold nanoaprticles market scenario through secondary research. Several primary interviews were conducted with market experts from both the demand and supply sides across major countries of North America, Europe, Asia Pacific, Middle East & Africa, and Latin America. Primary data was collected through questionnaires, emails, and telephonic interviews. The primary sources from the supply side included various industry experts, such as Chief X Officers (CXOs), Vice Presidents (VPs), Directors from business development, marketing, product development/innovation teams, and related key executives from gold nanoparticles industry vendors; material providers; distributors; and key opinion leaders. Primary interviews were conducted to gather insights such as market statistics, data on revenue collected from the products and services, market breakdowns, market size estimations, market forecasting, and data triangulation. Primary research also helped in understanding the various trends related to process type, application, end-use industry, and region. Stakeholders from the demand side, such as CIOs, CTOs, CSOs, and installation teams of the customer/end users who are seeking gold nanoparticles services, were interviewed to understand the buyer’s perspective on the suppliers, products, component providers, and their current usage of gold nanoparticles and future outlook of their business which will affect the overall market.
The Breakup of Primary Research

To know about the assumptions considered for the study, download the pdf brochure
Market Size Estimation
The research methodology used to estimate the size of the gold nanoparticles market includes the following details. The market sizing of the market was undertaken from the demand side. The market was upsized based on the demand for gold nanoparticles in different end-use industries at a regional level. Such procurements provide information on the demand aspects of the gold nanoparticles industry for each application. For each end-use, all possible segments of the gold nanoparticles market were integrated and mapped.

Data Triangulation
After arriving at the overall size from the market size estimation process explained above, the total market was split into several segments and subsegments. The data triangulation and market breakdown procedures explained below were implemented, wherever applicable, to complete the overall market engineering process and arrive at the exact statistics for various market segments and subsegments. The data was triangulated by studying various factors and trends from the demand and supply sides. Along with this, the market size was validated using both the top-down and bottom-up approaches.
Market Definition
Gold nanoparticles are gold particles with nanoscale dimensions, ranging from 1 to 100 nanometers in size, which possess special optical, electronic, and biological characteristics. They have high surface-area-to-volume ratios, intense surface plasmon resonance (SPR), and superior biocompatibility, and hence are extremely versatile for imaging, targeted drug delivery, proton therapy, in-vitro assays, sensors, probes, catalysis and other uses. Gold nanoparticles are synthesized by chemical, physical, or biological processes and are frequently functionalized with polymers or biomolecules to increase their stability and targeted interactions in certain applications.
Stakeholders
- Gold Nanoparticles Manufacturers
- Gold Nanoparticles Distributors and Suppliers
- End-use Industries
- Universities, Governments, and Research Organizations
- Associations and Industrial Bodies
- R&D Institutes
- Environmental Support Agencies
- Investment Banks and Private Equity Firms
- Research and Consulting Firms
Report Objectives
- To define, describe, and forecast the gold nanoparticles market size in terms of volume and value
- To provide detailed information regarding the key factors, such as drivers, restraints, opportunities, and challenges influencing market growth
- To analyze and project the global gold nanoparticles market, by process, by application, end-use industry, and region
- To forecast the market size concerning five main regions (along with country-level data), namely, North America, Europe, Asia Pacific, Middle East & Africa, and Latin America, and analyze the significant region-specific trends
- To strategically analyze micromarkets with respect to individual growth trends, prospects, and contributions of the submarkets to the overall market
- To analyze the market opportunities and the competitive landscape for stakeholders and market leaders
- To assess recent market developments and competitive strategies, such as agreements, contracts, acquisitions, and new product developments/new product launches, to draw the competitive landscape
- To strategically profile the key market players and comprehensively analyze their core competencies
Key Questions Addressed by the Report
Need a Tailored Report?
Customize this report to your needs
Get 10% FREE Customization
Customize This ReportPersonalize This Research
- Triangulate with your Own Data
- Get Data as per your Format and Definition
- Gain a Deeper Dive on a Specific Application, Geography, Customer or Competitor
- Any level of Personalization
Let Us Help You
- What are the Known and Unknown Adjacencies Impacting the Gold Nanoparticles Market
- What will your New Revenue Sources be?
- Who will be your Top Customer; what will make them switch?
- Defend your Market Share or Win Competitors
- Get a Scorecard for Target Partners

Custom Market Research Services
We Will Customise The Research For You, In Case The Report Listed Above Does Not Meet With Your Requirements
Get 10% Free CustomisationTESTIMONIALS

We at Nissan Chemicals Corporation have been clients of MarketsandMarkets for more than a year now. We recently consulted MarketsandMarkets for a study, the team at MarketsandMarkets was extremely professional and organized. The business insights were very detailed and aligned well with our expectations that really helped us formulate the Business Plans and device new strategies for development themes. MarketsandMarkets offers a unique combination of expertise and dedicated engagement model. Their research findings have helped us in designing our Pricing Strategy which will make it easier for us to predict the future sales and profits for the next ten years. We look forward to working with MarketsandMarkets in the future.
VP of Strategy & New Business Development
Leading Specialty Chemical Company
The MarketsandMarkets Engagement Model, composed of both the Knowledge Store and advisory custom research, has greatly helped us in understanding our markets and making strategic decisions. The Knowledge Store is a fast way to allow everyone in our organization to understand more about most any market they are interested in. The ability to then get custom research done and get answers to specific strategic questions and market insight has been spectacular. The Markets and Markets team feel more like colleagues than vendors and their services have helped us change our culture where statements of things like growth opportunities and competitive position are always backed by industry research.

Rich Gibson,
Director, Corporate Strategy
Milliken & Company,
Leading Industrial Manufacturer of specialty chemical, floor covering, performance and protective textile materials, and healthcaremilliken.com
MarketsandMarkets is a trusted resource that helps us to better understand markets that are near-adjacencies-whether its technology, value chain or geography. Their Knowledge Store platform provides a dashboard of markets and their characteristics which is easy to use and saves us time.
Adam Shaw,
Market Development and Strategy Manager
AdvanSix Inc. USA,
An American Leader in Chemicalswww.advansix.com
The Knowledge Store from MarketsandMarkets is a valuable tool which has helped my team acquire greater insight in to the end markets that our business serves. This has enabled us to help our company build stronger strategies throughout our planning process.
TOSHIO KINOSHITA
Senior Chif Consultion Research & Consulting Division
Mitsubishi Chemical Research Corporation,
Leading Manufacturer of Chemical Productswww.mitsubishichem-res.co.jp/en/

We recently engaged with MarketsandMarkets for a study, the team not only clearly understood our business objectives but was also extremely professional in the way they handled the entire project. The study was efficiently conducted in a phase-wise manner, and the engagement model furnished us with high-quality business insights that far exceeded our expectations at each phase. We were especially happy that MarketsandMarkets could provide us with both, an English as well as a Japanese version of the study. A special thanks to the Analyst Team and Client Services Team, whose fluency in Japanese enhanced our comfort level, as we could converse with them in our preferred language.
Independent entrepreneurs
Arrow Precision
We approached MarketsandMarkets for study on Proppants Market, and their work exceeded our expectations. The study conducted was comprehensive and enabled us to view the market through the various dimensions. In addition, the team was extraordinarily responsive throughout the process and resolved our queries on time. I strongly recommend MarketsandMarkets and will certainly consider them for additional market assessments we will need in the future.
Global engineering company, Japan
Deputy Manager,
Strategic Planning OfficeThe high-quality insights shared by the MarketsandMarkets team helped us understand the pharmaceutical plant designers in a specific geography. It also captured the risks that we may likely face in communicating with our potential partners. The study would enable us identify partners, which would impact our future growth.


Growth opportunities and latent adjacency in Gold Nanoparticles Market