
Green Water Treatment Chemicals Market

Green Water Treatment Chemicals Market by Type (Coagulant & Flocculants, Corrosion & Scale Inhibitors, Biocides & Disinfectants), Source (Plant, Animal, Mineral), Application, End-use Industry (Municipal, Industrial), and Region - Global Forecast to 2029


OVERVIEW
Source: Secondary Research, Interviews with Experts, MarketsandMarkets Analysis
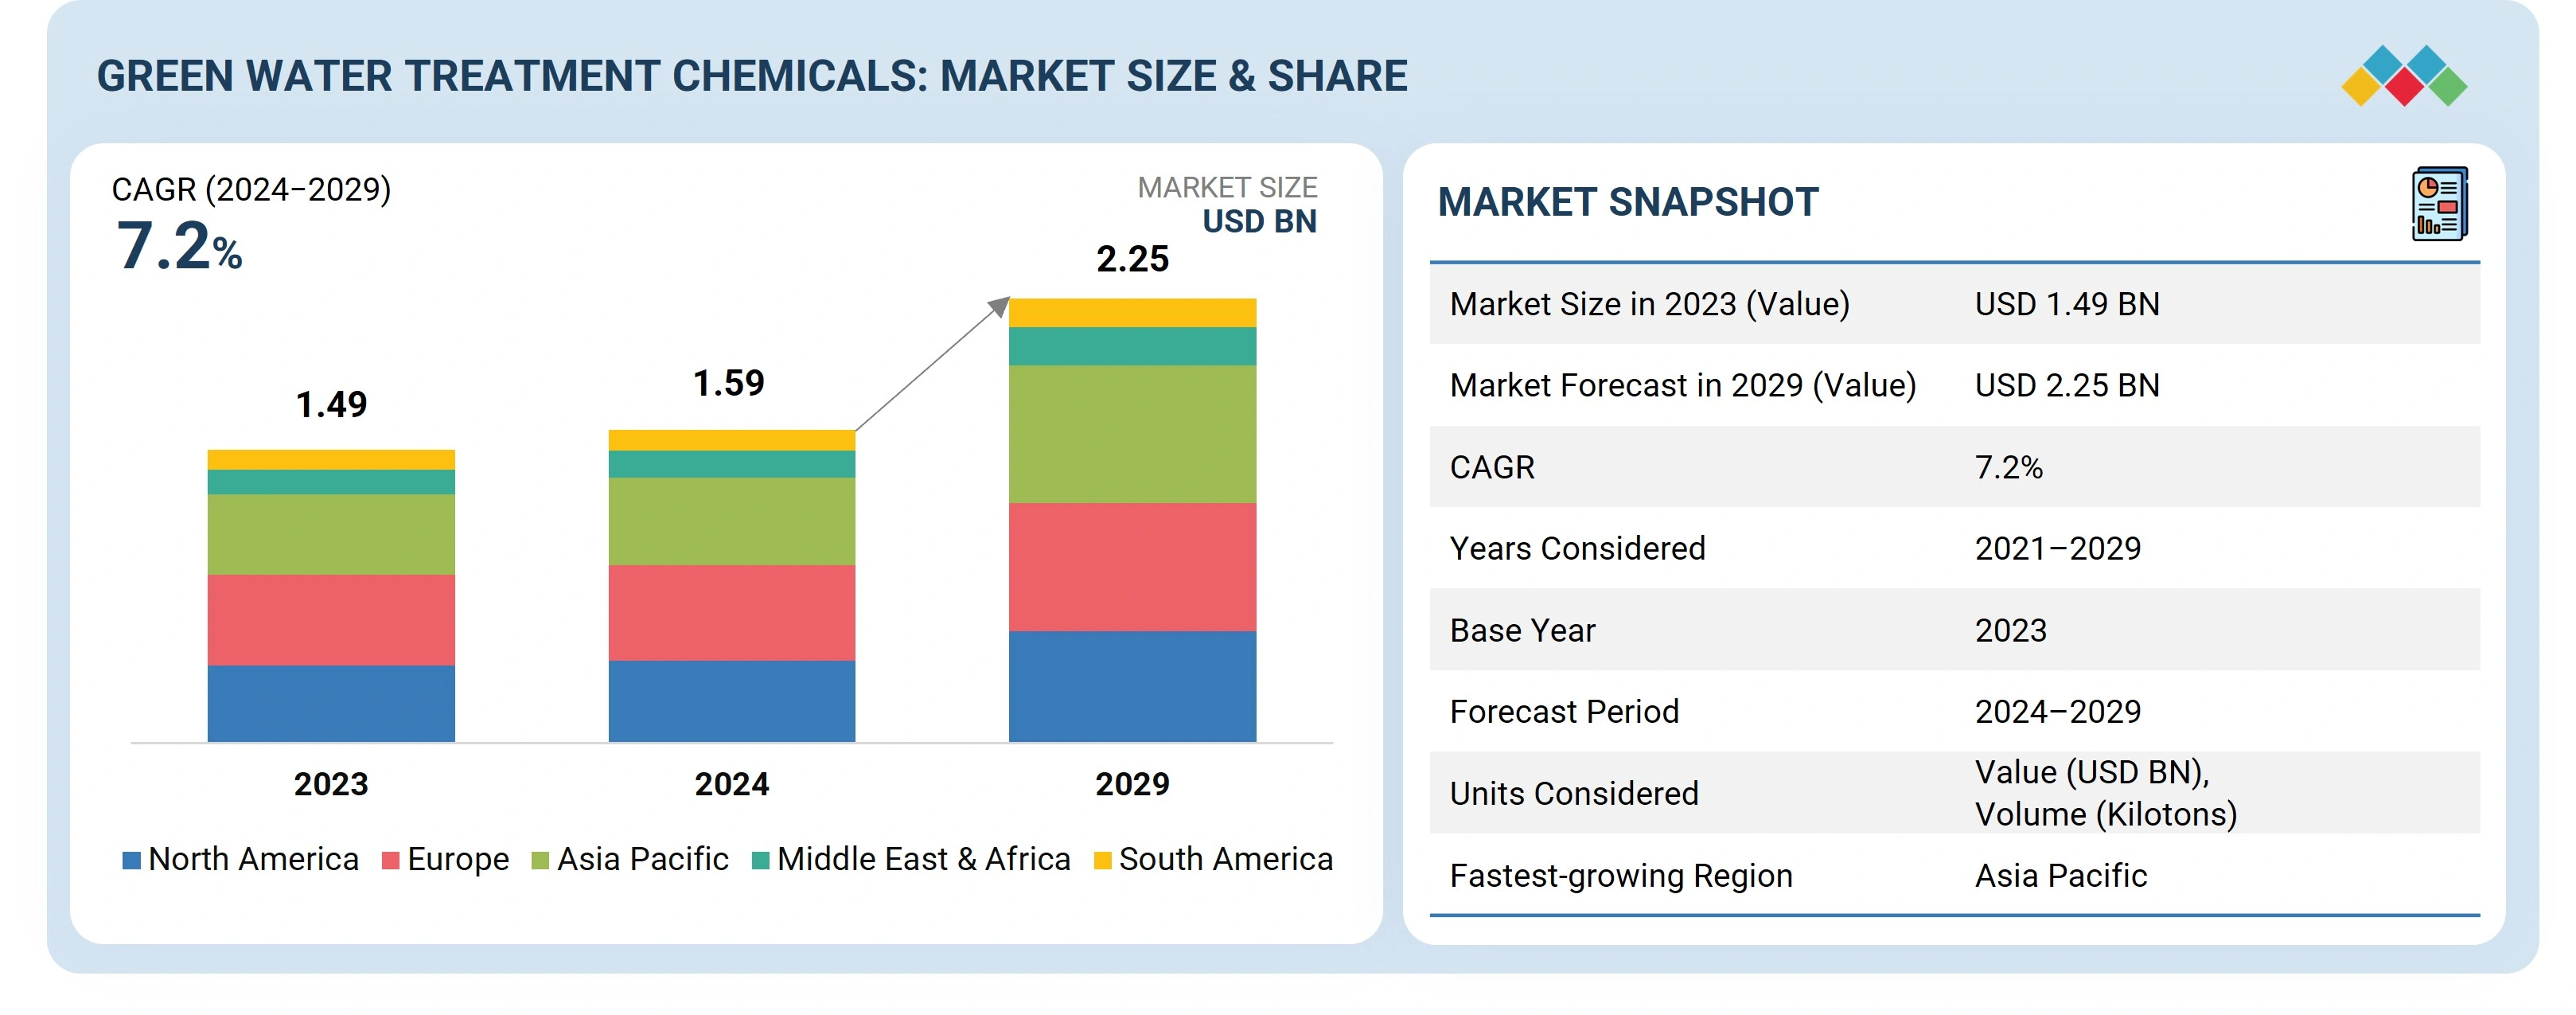
During the forecast period, the green water treatment chemicals market is projected to reach USD 2.25 billion by 2029 from USD 1.59 billion in 2024, at a CAGR of 7.2%. The green water treatment chemicals market will experience substantial expansion because societies are becoming more environmentally conscious, and regulations have tightened as multiple industries demonstrate escalating demands for sustainable water treatment solutions.
KEY TAKEAWAYS
-
BY TYPEThe green water treatment chemicals market type includes Coagulants & Flocculants, Corrosion & Scale Inhibitors, Biocides & Disinfectants, Chelating Agents, and other types of chemicals. Each chemical type provides unique benefits, such as efficient removal of suspended solids, control of microbial growth, prevention of scale and corrosion, and chelation of metal ions. These properties make them suitable for a range of water treatment processes while supporting environmental sustainability goals.
-
BY SOURCEGreen water treatment chemicals are derived from various plant-based sources, animal-based sources, and mineral-based sources. Plant-based sources, such as starch, cellulose, and gums, provide biodegradable and environmentally friendly alternatives for coagulation and flocculation. Animal-based sources, including chitosan from shellfish, offer natural bioactive compounds for water purification. Mineral-based sources, such as zeolites and clays, provide structural and chemical stability for large-scale water treatment applications.
-
BY APPLICATIONGreen water treatment chemicals are used across multiple water treatment applications, including wastewater treatment, drinking water treatment, process water treatment, and other specialized applications. Coagulants and flocculants are widely applied in wastewater treatment plants to remove turbidity and suspended solids. Corrosion and scale inhibitors are used in process water systems to protect equipment. Biocides and disinfectants are applied to control microbial contamination in drinking and industrial water systems. Chelating agents are used to sequester metal ions in both industrial and municipal water systems.
-
BY END-USE INDUSTRYThe end-use industries for green water treatment chemicals include municipal and industrial sectors. Municipal applications focus on supplying safe drinking water and treating urban wastewater, while industrial applications involve water treatment for manufacturing, cooling, power generation, and process operations. The adoption of green water treatment chemicals in both sectors is driven by regulatory compliance, sustainability goals, and the need for efficient, cost-effective water management solutions.
-
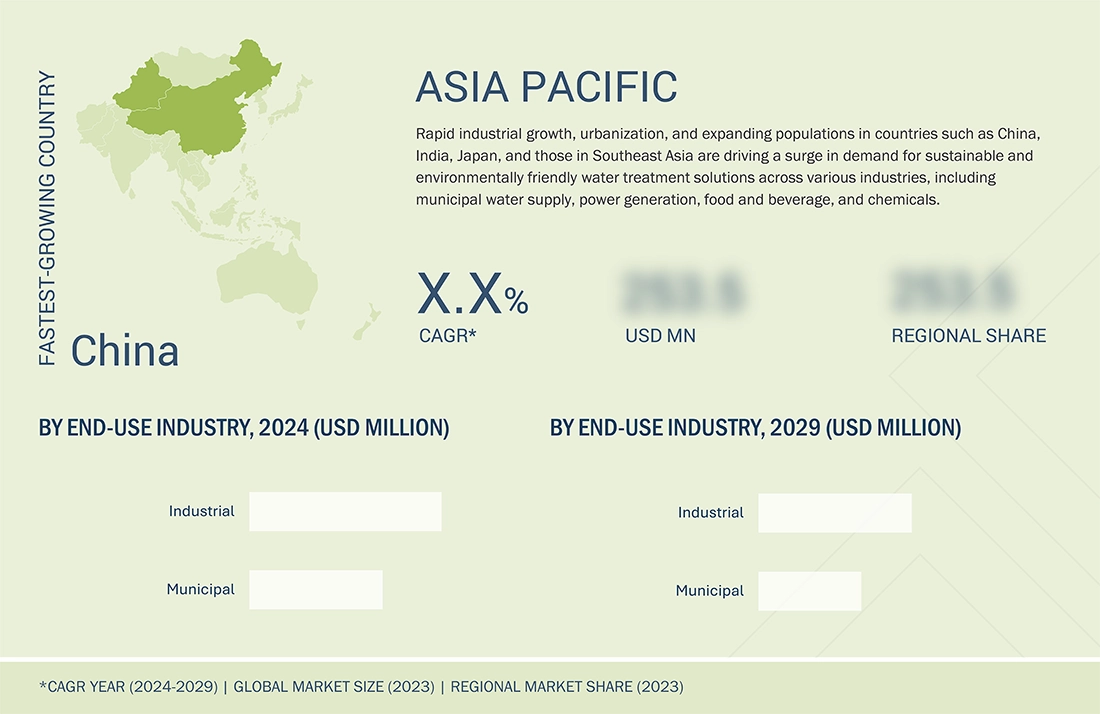
BY REGIONAsia Pacific is projected to be the fastest-growing region in the green water treatment chemicals market, driven by rapid industrialization, urbanization, and increasing regulatory pressure for environmentally sustainable water treatment solutions. Rising municipal water infrastructure investments, expanding industrial wastewater management, and growing awareness of eco-friendly chemical alternatives are boosting market adoption.
-
COMPETITIVE LANDSCAPEMajor players in the green water treatment chemicals market are pursuing both organic and inorganic growth strategies, including acquisitions, partnerships, and development of biodegradable and plant-based water treatment solutions. Companies such as Kemira (Finland), Veolia (France), Ecolab (US), Kurita (Japan), and Solenis (US) are expanding their product portfolios with eco-friendly coagulants, flocculants, antiscalants, and corrosion inhibitors, while also targeting regional expansions to meet increasing demand for sustainable water treatment solutions globally.
Innovations in green chemistry are driven by research and development (R&D), which bring new treatments that yield modern performance standards relevant to water management. R&D is shaping the market trends as it focuses on developing new sustainable green water treatment chemical formulations along with advanced performance technologies. The increasing rate of urbanization and industrialization, is causing the demand for sustainable wastewater management solutions. Market growth is supported by binding international funding streams and technological partnerships that address management for sustainable water resources, even as industries are increasingly using environment-friendly products driven by growing environmental awareness. Regulatory pressure along with market demand for sustainable practices and ongoing innovation supports an expected substantial growth trajectory of the green water treatment chemicals industry through upcoming years.
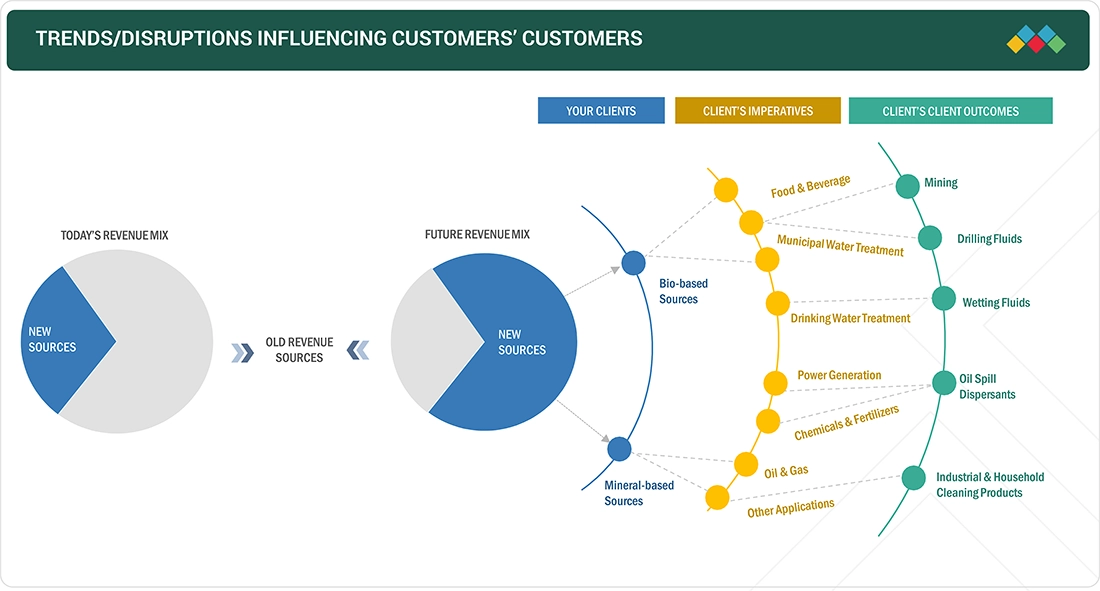
TRENDS & DISRUPTIONS IMPACTING CUSTOMERS' CUSTOMERS
The effects on consumer businesses are derived from customer trends or disruptions. Hotbets are municipal utilities, industrial water users, and manufacturers, and target sectors are end use sectors of municipal wastewater treatment, food & beverage, power generation, and industrial process water management. The impacts of shifts, which are changing trends or disruptions like tighter environmental regulations, increasing demand for sustainability, and the adoption of biodegradable or plant-based chemicals, will impact the revenues of end users. The impact on end user revenues will impact hotbet revenues, and, in turn, the revenues of green water treatment chemical manufacturers.
Source: Secondary Research, Interviews with Experts, MarketsandMarkets Analysis
MARKET DYNAMICS
Level
-
Increasing regulatory pressure on wastewater discharge and chemical usage

-
Growing emphasis on circular water management and resource recovery

Level
-
High production costs and limited economies of scale

-
Performance limitations compared to conventional chemicals

Level
-
Demand for sustainable and eco-friendly alternatives

-
Growing regulations on water quality and pollution control

Level
-
High production costs and scalability issues

Source: Secondary Research, Interviews with Experts, MarketsandMarkets Analysis
Driver: Increasing regulatory pressure on wastewater discharge and chemical usage
The increasing governmental standards designed to address sustainability efforts in both municipal and industrial sectors, contribute to demand for green water treatment chemicals. The global regulatory environment is meaningfully stricter due to the efforts from organizations, such as the Environmental Protection Agency (EPA), the European Chemicals Agency (ECHA), China's Ministry of Ecology and Environment (MEE) to enhance rules around water contamination while enforcing regulations on industrial wastewater effluent and prohibiting high-risk synthetic compounds. The manufacturers of water treatment chemicals are looking to bio-based alternatives, including plant-based coagulants, biodegradable chelants, and bio-enzymatic solutions, moving away from previously used PFAS and heavy metal-based coagulants due to matching regulatory restrictions and phosphate limitations. Companies have increased goals focused on sustainability (ESG) obligations while addressing reductions in environmental impacts and now are looking for low-carbon footprint water treatment chemicals that are non-toxic and readily-degradable if possible. The continuous advancement of bio-based polymers and plant-derived coagulants, enzymatic water treatment solutions, and other green water treatment chemicals will make them the industry standard.
Restraint: High production costs and limited economies of scale
The costs associated with environmentally friendly water treatment chemicals made from bio-resources are still above that of traditional chemical alternatives, which is an obvious barrier to market acceptance. The sustainable production of plant-based coagulants, biopolymers and enzyme-based disinfectants require more sophisticated extraction and purification technologies that add to the manufacturing costs. The production volume of green water treatment chemicals remains lower than synthetic chemicals, so economies of scale remain limited and cost-exacerbating. The biotechnological production methods face two primary limitations: they need advanced complex infrastructure while experiencing both yield variation and seasonal inventory availability that affects product prices and supply stability. The increasing adoption of bio-surfactants and enzyme-based cleaners in industrial wastewater treatment results in higher costs because these products often demand more expensive production facilities and extra procedural steps for functional maintenance. The shelf life of many biodegradable or bio-based chemicals becomes shorter while they remain sensitive to temperature changes and show stability problems which lead to requirements for specialized storage and transportation needs. Therefore, the high cost of green water treatment chemicals will limit their widespread adoption.
Opportunity: Demand for sustainable and eco-friendly alternatives
The increasing global awareness of environmental issues has resulted in an enormous increase in green water treatment chemicals that share favorable environmental characteristics as well as biodegradability and comparatively lower toxicity than conventional chemical agents. Chlorine along with chlorine dioxide and synthetic coagulants remain among the most widely used water sanitization substances, although their application produces hazardous reactions that are harmful to natural ecosystems and human physiology. Manufacturing facilities and municipal bodies have started to seek environmentally sustainable water treatment solutions that yield similar outcomes but can mitigate impact to environmental systems. The change in treatment needs has resulted in an expedited search for bio-based and natural water solutions. Water treatment solution companies are now investigating how to replace chemical water treatment with renewable alternatives, such as coagulants sourced from the plant kingdom and chemical sources from algae-based flocculants and food waste.
Challenge: High production costs and scalability issues
Green water treatment chemicals require source materials from renewable resources which include plant life and algae as well as waste-derived substances. Bio-based materials provide superior sustainability to synthetic chemicals, yet their initial implementation costs end up higher due to multiple requirements. Lead time and costs for finding bio-based chemical raw materials typically exceed the extensive manufacturing scale of petroleum-derived synthetic chemicals. Licenses requiring companies and governmental organizations to offset their use of chemical water treatment products present varied implementation costs due to farm product yield fluctuations, supply disruptions, and seasonal price movements. Plant-based raw material production suffers from negative harvest results, leading to higher extraction costs. Divisions within bio-based chemical manufacturing processes depend on specialized equipment and extensive skilled labor which ultimately drives up the production expenses. Traditional water treatment chemicals operate using optimized industrial processes that achieve economies of scale because manufacturers have refined production methods.
Green Water Treatment Chemicals Market: COMMERCIAL USE CASES ACROSS INDUSTRIES
| COMPANY | USE CASE DESCRIPTION | BENEFITS |
|---|---|---|
 |
Use of KemConnect P for phosphorus removal at Edar Vic wastewater treatment plant in Spain. | Reduced ferric chloride consumption by over 15% per kg of phosphorus, enhanced process stability, and improved responsiveness to process disturbances. |
 |
PFAS mitigation using granular activated carbon at Stanton drinking water treatment plant in Delaware, USA. | Serves 100,000 residents; effectively removes PFAS (“forever chemicals”); improved compliance with environmental regulations; scalability to 100+ sites. |
 |
Implementation of MicrOx hydrogen peroxide and Advanox UV treatment for micropollutant removal in Växjö, Sweden. | Achieved over 90% removal of pharmaceutical residues; improved water quality; compliance with stricter municipal wastewater regulations. |
 |
Application of Cetamine technology at a U.S. meat processing plant for boiler and cooling water treatment. | Reduced CO2 emissions by 180 tons annually; improved energy efficiency; lowered chemical consumption; enhanced operational sustainability. |
 |
Refurbishment of the demineralized water plant at Solenis’ Bradford manufacturing facility in the UK. | Enhanced reliability of critical water supply for manufacturing operations; significant capital expenditure savings compared to a full system replacement; improved operational continuity and efficiency. |
Logos and trademarks shown above are the property of their respective owners. Their use here is for informational and illustrative purposes only.
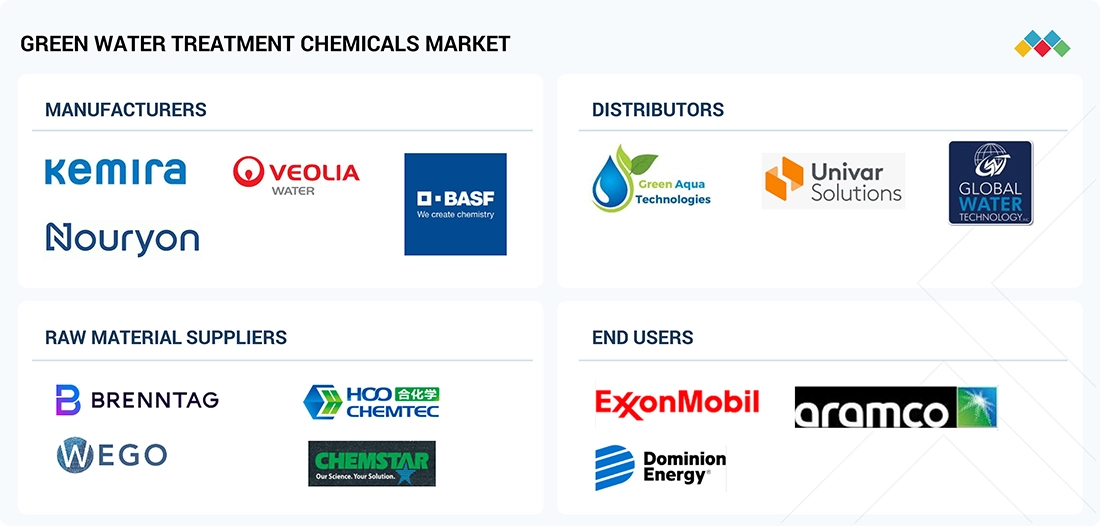
MARKET ECOSYSTEM
The green water treatment chemicals industry has a complicated ecosystem consisting of manufacturers, including Kemira (Finland), Ecolab (US), Veolia (France), raw material suppliers, distributors, government, and end-use industries. Leading companies in this industry include the established, financially stable manufacturers of green water treatment chemicals. These companies have been in the industry for many years and have diversified product portfolios and robust global sales and marketing networks.
Logos and trademarks shown above are the property of their respective owners. Their use here is for informational and illustrative purposes only.
MARKET SEGMENTS
Source: Secondary Research, Interviews with Experts, MarketsandMarkets Analysis
Green Water Treatment Chemicals Market, By Type
The sector of green water treatment chemicals comprised of coagulants and flocculants is growing at the fastest rate because regulations involving the environment and industry needs are intersecting with new technology. Growing environmental regulation of industrial processes and operations has driven the change to sustainable practices in almost every industry to necessity. Wastewater treatment processes using biodegradable, and the non-toxic process, have become broadly acceptable since they remove suspended materials and impurities while being more effective and produces less hazardous by-products. Industries such as oil and gas, power generation, and municipal water treatment are showing interest in these alternatives due to international water clean-up processes and boosted wastewater standards.
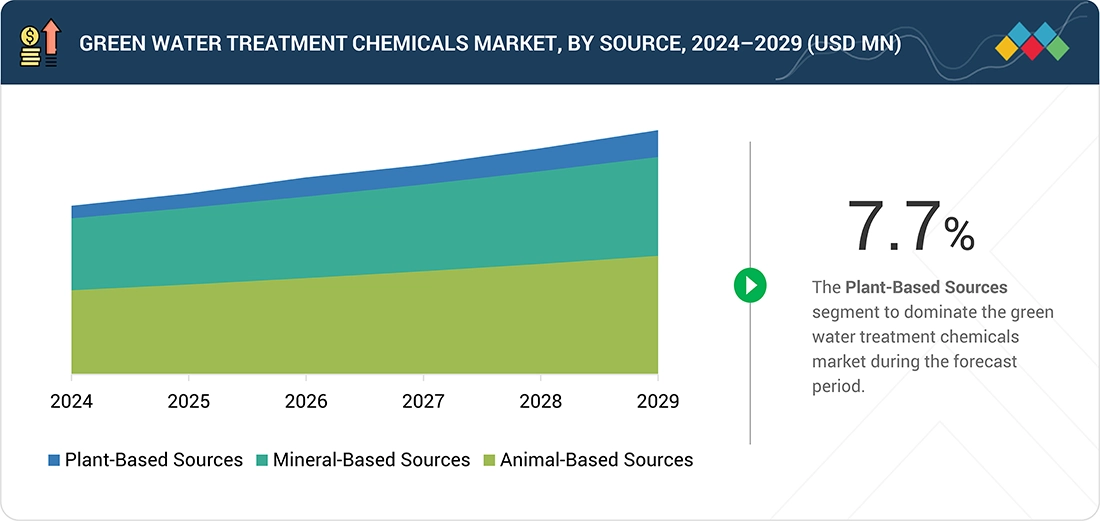
Green Water Treatment Chemicals Market, By Source
The green water treatment chemicals sector is growing rapidly, primarily due to the expanding interaction with naturally-derived plant materials such as starch, essential oils, plant saps, gums, tannins, and alkaloids. Sustainable, environmentally-friendly processes for wastewater treatment continue to attract greater international interest, thereby enhancing growth. The unique benefits of utilizing plant-based coagulants/flocculants compared to traditional chemical processes include lower toxicity, lower production of sludge, and increased biodegradability. This broader biodegradability not only leads to lower costs, but also permits compliance with ever stricter environmental regulations focusing on ecological degradation. In addition, heightened public concern over health risks and the general effects of synthetic chemicals in water treatment processes have prompted materials to production non-toxic, natural products. Market trends are also being driven by regulatory initiatives, and increased consumer preference for sustainable products and ongoing research in green chemistry for environmentally-friendly water treatment applications.
Green Water Treatment Chemicals Market, By End-use Industry
The industrial sector is projected to be the fastest-growing end-use industry in the green water treatment chemicals market. The industrial sector demonstrates the maximum growth in green water treatment chemicals adoption because industry faces increasing environmental regulations and heightened awareness which combined with urgent sustainability demands for water management solutions. The volatile wastewater produced by various industries including power generation alongside oil and gas and textiles and food processing needs proper treatment for meeting established discharge criteria. Industrial commitment to environmentally responsible practices stems from escalating customer expectations which drives organizations to improve their sustainability performance. Innovations in green chemistry improve not only the performance but also the cost-effectiveness of these chemicals, leading to their wider use as solutions in industry. Rapidly urbanizing and industrializing emerging economies increasingly needs advanced water treatment technologies in a critical way.
REGION
Asia Pacific to be the fastest-growing region in the global green water treatment chemicals market during the forecast period
The Asia Pacific region is projected to register the highest CAGR during the forecast period due to tremendous industrialization, increasing awareness of the environment, and government initiatives. Growth in this market is expected to be centered around China and India, mainly due to their growing manufacturing sectors and their demand for sustainable materials in various applications. The strengthening concern about environmental matters led governments to enact strict rules that force industrial operations to replace traditional chemicals with eco-friendly alternatives. The rising industrial activities across the region encompass oil and gas production alongside power generation and textile manufacturing which generate large amounts of wastewater that require efficient treatment methods. The growing urban population and intensifying water shortages push forward the urgent need for innovative green water treatment technologies across this region. Asia-Pacific demonstrates strong positioning as an important market participant in global green water treatment .
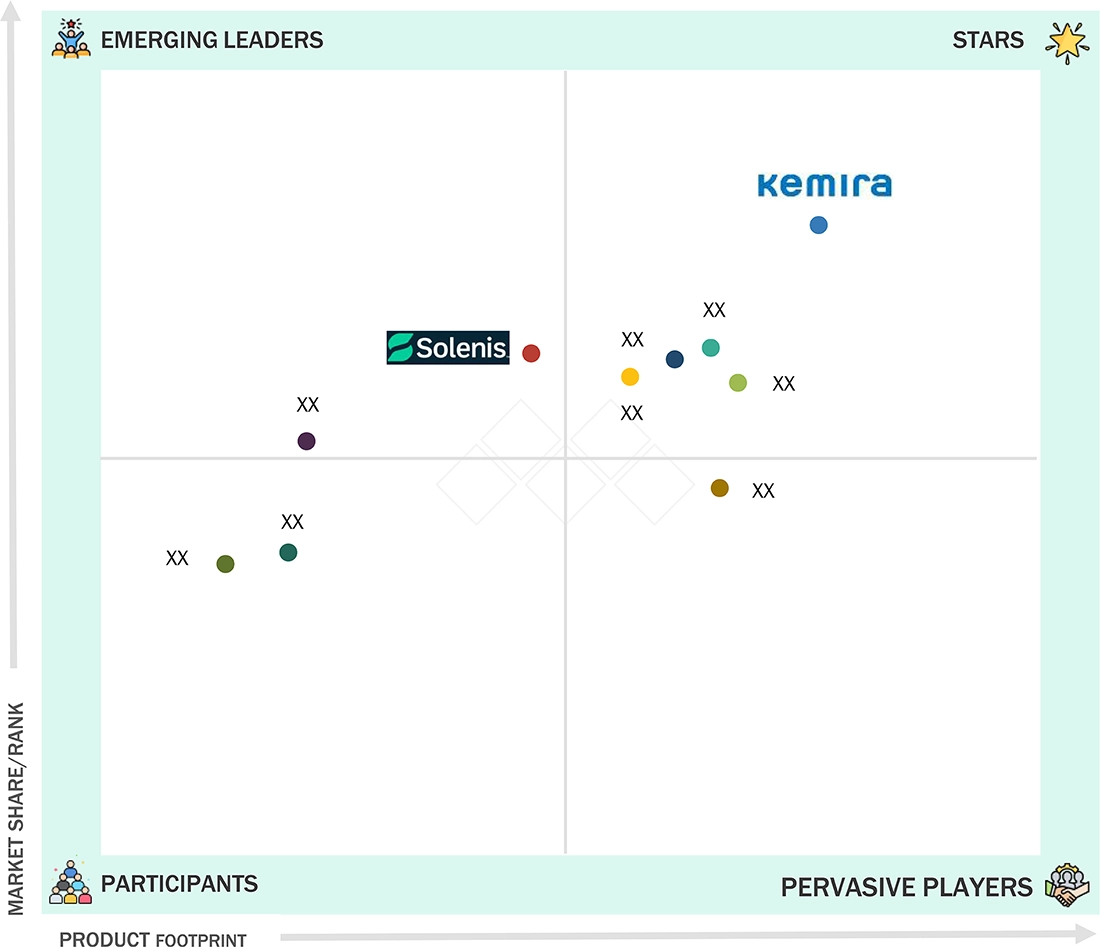
Green Water Treatment Chemicals Market: COMPANY EVALUATION MATRIX
In the landscape of the green water treatment chemicals industry, Kemira (Star) has a significant market share, offering a diverse product portfolio with coagulants, flocculants, biocides, corrosion inhibitors, and chelating agents offered for direct sales and made available for municipalities and industrial treatment markets. Solenis (Emerging Leader) is gaining awareness with its specialty water treatment chemistries as well as its plant-based, environmentally friendly products, innovating with niche product launches and expanding into a new product mix. While Kemira dominates through scale and a broad sustainable portfolio, Solenis shows significant potential to move toward the leaders' quadrant as demand for green and eco-friendly water treatment solutions continues to rise.
Source: Secondary Research, Interviews with Experts, MarketsandMarkets Analysis
KEY MARKET PLAYERS
MARKET SCOPE
| REPORT METRIC | DETAILS |
|---|---|
| Market Size in 2023 (Value) | USD 1.49 Billion |
| Market Forecast in 2029 (value) | USD 2.25 Billion |
| Growth Rate | CAGR of 7.2 % from 2024 to 2029 |
| Years Considered | 2021–2029 |
| Base Year | 2023 |
| Forecast Period | 2024–2029 |
| Units Considered | Value (USD Billion), Volume (Kiloton) |
| Report Coverage | Revenue forecast, company ranking, competitive landscape, growth factors, and trends |
| Segments Covered |
|
| Regions Covered | North America, Asia Pacific, Europe, South America, Middle East & Africa |
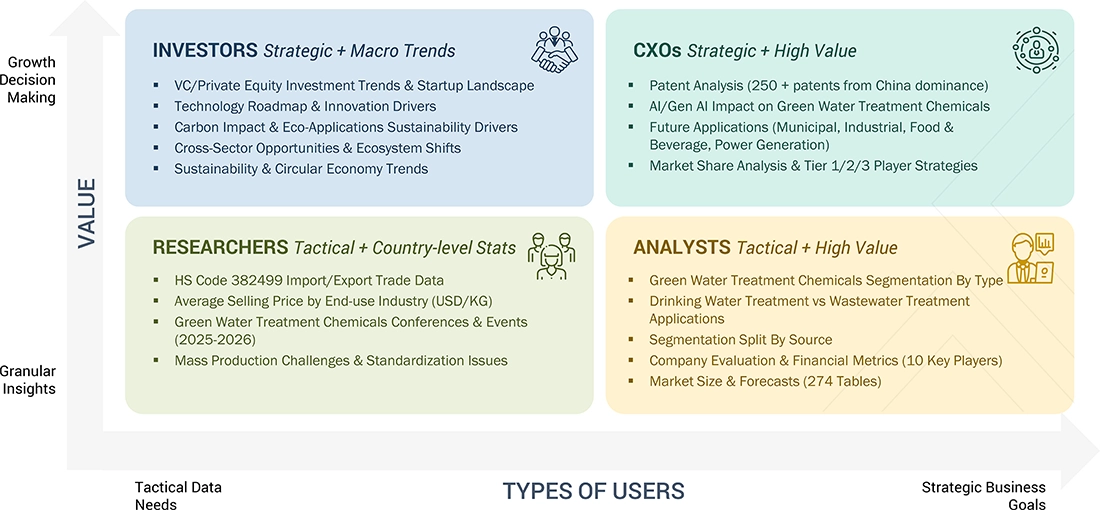
WHAT IS IN IT FOR YOU: Green Water Treatment Chemicals Market REPORT CONTENT GUIDE
DELIVERED CUSTOMIZATIONS
We have successfully delivered the following deep-dive customizations:
| CLIENT REQUEST | CUSTOMIZATION DELIVERED | VALUE ADDS |
|---|---|---|
| Global Green Water Treatment Chemicals Manufacturer |
|
|
| Corrosion & Scale Inhibitors Manufacturer |
|
|
| Chelating Agents Manufacturer |
|
|
RECENT DEVELOPMENTS
- November 2024 : Ecolab completed its acquisition of Barclay Water Management, a provider of innovative water safety and digital monitoring solutions primarily serving industrial and institutional clients in the northeastern United States.
- November 2024 : Solenis has acquired BASF's flocculants business, a strategic move that significantly enhances its portfolio in the mining sector, this acquisition allows Solenis to expand its offerings in specialty chemicals essential for mineral extraction, bolstering its position in a competitive market.
- September 2024 : Imagine H2O and Kurita Water Industries's partnership to commercialize and scale water solutions represents a transformative step in advancing sustainable water management.
- June 2024 : Kurita Water Industries Ltd. announced the establishment of a local company in India to enhance its sales and distribution of water treatment chemicals.
- November 2023 : Kemira, among the leader in sustainable chemical solutions for water-intensive industries, has announced a substantial expansion of its ferric sulfate production line in Goole, UK, adding 70,000 tons of capacity.
Table of Contents
 Exclusive indicates content/data unique to MarketsandMarkets and not available with any competitors.
Methodology
The study involved four major activities for estimating the current size of the global green water treatment chemicals market. Exhaustive secondary research was conducted to collect information on the market, the peer product market, and the parent product group market. The next step was to validate these findings, assumptions, and sizes with the industry experts across the value chain of green water treatment chemicals through primary research. Both the top-down and bottom-up approaches were employed to estimate the overall size of the green water treatment chemicals market. After that, market breakdown and data triangulation procedures were used to determine the size of different segments and sub-segments of the market.
Secondary Research
In the secondary research process, various secondary sources such as Hoovers, Factiva, Bloomberg BusinessWeek, and Dun & Bradstreet were referred, to identify and collect information for this study on the green water treatment chemicals market. These secondary sources included annual reports, press releases & investor presentations of companies; white papers; certified publications; articles by recognized authors; regulatory bodies, trade directories, and databases.
Primary Research
The green water treatment chemicals market comprises several stakeholders in the supply chain, which include raw material suppliers, distributors, end-product manufacturers, buyers, and regulatory organizations. Various primary sources from the supply and demand sides of the markets have been interviewed to obtain qualitative and quantitative information. The primary participants from the demand side include key opinion leaders, executives, vice presidents, and CEOs of companies in the green water treatment chemicals market. Primary sources from the supply side include associations and institutions involved in the green water treatment chemicals market, key opinion leaders, and processing players.
Following is the breakdown of primary respondents:

To know about the assumptions considered for the study, download the pdf brochure
Market Size Estimation
The bottom-up and top-down approaches have been used to estimate the green water treatment chemicals market by type, source, application, end-use industry, and region. The research methodology used to calculate the market size includes the following steps:
- The key players in the industry and markets were identified through extensive secondary research.
- In terms of value, the industry’s supply chain and market size were determined through primary and secondary research processes.
- All percentage shares, splits, and breakdowns were determined using secondary sources and verified through primary sources.
- All possible parameters that affect the markets covered in this research study were accounted for, viewed in extensive detail, verified through primary research, and analyzed to obtain the final quantitative and qualitative data.
- The research included studying reports, reviews, and newsletters of top market players and extensive interviews with leaders such as directors and marketing executives to obtain opinions.
The following figure illustrates the overall market size estimation process employed for this study.

Data Triangulation
After arriving at the overall size of the green water treatment chemicals market from the estimation process explained above, the total market was split into several segments and sub-segments. The data triangulation and market breakdown procedures were employed, wherever applicable, to complete the overall market engineering process and arrive at the exact statistics for all segments and subsegments. The data was triangulated by studying various factors and trends from both the demand and supply sides. Along with this, the market size was validated using both the top-down and bottom-up approaches.
Market Definition
Green water treatment chemicals consist of environmentally friendly chemical substances that improve water quality through treatment processes which generate minimal environmental impact. The treatment process uses both biodegradable coagulants & flocculants as well as plant-based and animal-based and mineral-based disinfectants and biocides. These chemicals experience rapid market growth due to worldwide environmental sustainability initiatives as well as stringent pollution reduction regulations and improved wastewater treatment needs in multiple industries. These green water treatment chemicals reduce contaminants from drinking water and wastewater through effective processes that eliminate traditional chemical treatment side effects. The integration of green water treatment chemicals in modern water management approaches enables industries to fulfill environmental rules while protecting their ecosystems which establishes these solutions as vital controllers for sustainable water resource management.
Stakeholders
- Green Water Treatment Chemicals Manufacturers
- Raw Material Suppliers
- Regulatory Bodies and Government Agencies
- Distributors and Suppliers
- End-Use Industries
- Associations and Industrial Bodies
- Market Research and Consulting Firms
Report Objectives
- To define, describe, and forecast the size of the green water treatment chemicals market in terms of value and volume.
- To provide detailed information regarding the key factors influencing the growth of the market (drivers, restraints, opportunities, and challenges).
- To forecast the market size based on type, source, application, end-use industry, and region.
- To forecast the market size for the five main regions—North America, Europe, Asia Pacific (APAC), South America, and the Middle East & Africa (MEA),—along with their key countries.
- To strategically analyze micro markets with respect to individual growth trends, prospects, and contributions to the total market.
- To analyze the opportunities in the market for stakeholders and provide details of the competitive landscape for the market leaders.
- To strategically profile leading players and comprehensively analyze their key developments such as new product launches, expansions, and deals in the green water treatment chemicals market.
- To strategically profile key players and comprehensively analyze their market shares and core competencies.
- To study the impact of AI/Gen AI on the market under study, along with the macroeconomic outlook.
Key Questions Addressed by the Report
Need a Tailored Report?
Customize this report to your needs
Get 10% FREE Customization
Customize This ReportPersonalize This Research
- Triangulate with your Own Data
- Get Data as per your Format and Definition
- Gain a Deeper Dive on a Specific Application, Geography, Customer or Competitor
- Any level of Personalization
Let Us Help You
- What are the Known and Unknown Adjacencies Impacting the Green Water Treatment Chemicals Market
- What will your New Revenue Sources be?
- Who will be your Top Customer; what will make them switch?
- Defend your Market Share or Win Competitors
- Get a Scorecard for Target Partners

Custom Market Research Services
We Will Customise The Research For You, In Case The Report Listed Above Does Not Meet With Your Requirements
Get 10% Free CustomisationTESTIMONIALS

We at Nissan Chemicals Corporation have been clients of MarketsandMarkets for more than a year now. We recently consulted MarketsandMarkets for a study, the team at MarketsandMarkets was extremely professional and organized. The business insights were very detailed and aligned well with our expectations that really helped us formulate the Business Plans and device new strategies for development themes. MarketsandMarkets offers a unique combination of expertise and dedicated engagement model. Their research findings have helped us in designing our Pricing Strategy which will make it easier for us to predict the future sales and profits for the next ten years. We look forward to working with MarketsandMarkets in the future.
VP of Strategy & New Business Development
Leading Specialty Chemical Company
The MarketsandMarkets Engagement Model, composed of both the Knowledge Store and advisory custom research, has greatly helped us in understanding our markets and making strategic decisions. The Knowledge Store is a fast way to allow everyone in our organization to understand more about most any market they are interested in. The ability to then get custom research done and get answers to specific strategic questions and market insight has been spectacular. The Markets and Markets team feel more like colleagues than vendors and their services have helped us change our culture where statements of things like growth opportunities and competitive position are always backed by industry research.

Rich Gibson,
Director, Corporate Strategy
Milliken & Company,
Leading Industrial Manufacturer of specialty chemical, floor covering, performance and protective textile materials, and healthcaremilliken.com
MarketsandMarkets is a trusted resource that helps us to better understand markets that are near-adjacencies-whether its technology, value chain or geography. Their Knowledge Store platform provides a dashboard of markets and their characteristics which is easy to use and saves us time.
Adam Shaw,
Market Development and Strategy Manager
AdvanSix Inc. USA,
An American Leader in Chemicalswww.advansix.com
The Knowledge Store from MarketsandMarkets is a valuable tool which has helped my team acquire greater insight in to the end markets that our business serves. This has enabled us to help our company build stronger strategies throughout our planning process.
TOSHIO KINOSHITA
Senior Chif Consultion Research & Consulting Division
Mitsubishi Chemical Research Corporation,
Leading Manufacturer of Chemical Productswww.mitsubishichem-res.co.jp/en/

We recently engaged with MarketsandMarkets for a study, the team not only clearly understood our business objectives but was also extremely professional in the way they handled the entire project. The study was efficiently conducted in a phase-wise manner, and the engagement model furnished us with high-quality business insights that far exceeded our expectations at each phase. We were especially happy that MarketsandMarkets could provide us with both, an English as well as a Japanese version of the study. A special thanks to the Analyst Team and Client Services Team, whose fluency in Japanese enhanced our comfort level, as we could converse with them in our preferred language.
Independent entrepreneurs
Arrow Precision
We approached MarketsandMarkets for study on Proppants Market, and their work exceeded our expectations. The study conducted was comprehensive and enabled us to view the market through the various dimensions. In addition, the team was extraordinarily responsive throughout the process and resolved our queries on time. I strongly recommend MarketsandMarkets and will certainly consider them for additional market assessments we will need in the future.
Global engineering company, Japan
Deputy Manager,
Strategic Planning OfficeThe high-quality insights shared by the MarketsandMarkets team helped us understand the pharmaceutical plant designers in a specific geography. It also captured the risks that we may likely face in communicating with our potential partners. The study would enable us identify partners, which would impact our future growth.


Growth opportunities and latent adjacency in Green Water Treatment Chemicals Market