
Grignard Reagents Market

Grignard Reagents Market by Product Type (Alkyl Grignard Reagents, Vinyl Grignard Reagents, Aryl Grignard Reagents), Application (APIs & Drugs, Agrochemicals, Polymer Synthesis & Functionalization), End-use Industry (Pharmaceutical & Biotechnology, Agriculture, Chemical, Flavors & Fragrances, Research), and Region - Global Forecast to 2030


OVERVIEW
Source: Secondary Research, Interviews with Experts, MarketsandMarkets Analysis
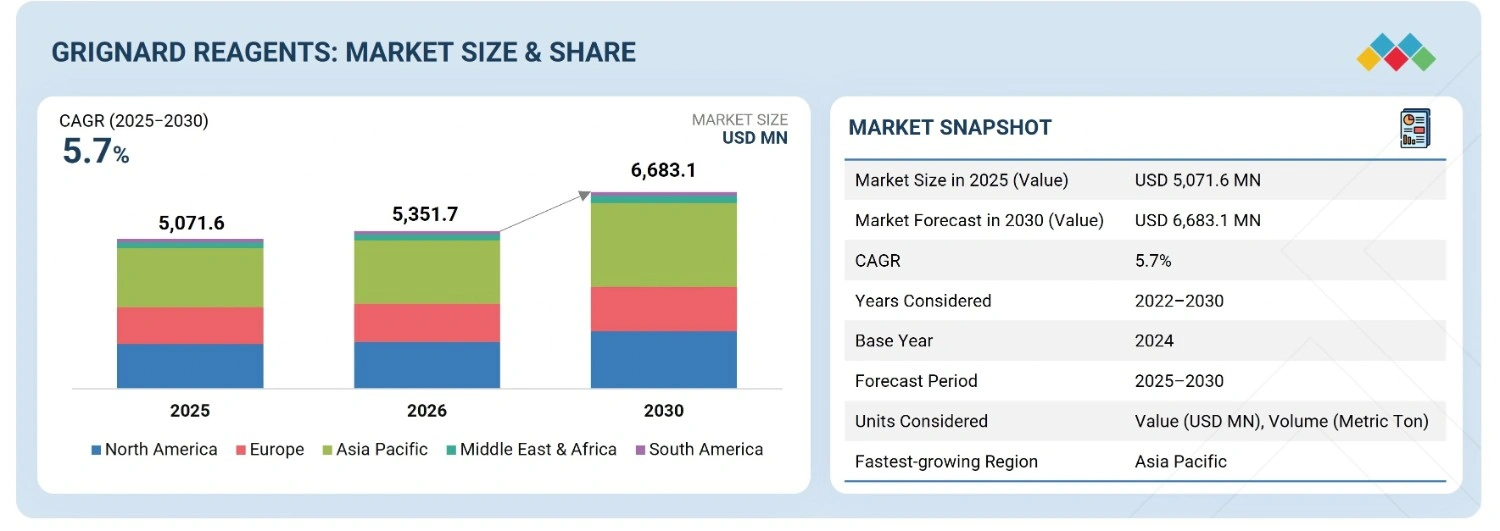
The grignard reagent market is projected to reach USD 6,683.1 million by 2030 from USD 5,071.6 million in 2025, at a CAGR of 5.7% from 2025 to 2030. The Grignard reagents market is experiencing strong growth due to their critical role as versatile intermediates in pharmaceuticals, agrochemicals, and specialty chemicals. Increasing demand for complex organic synthesis, including API production and fine chemical customization, is boosting market expansion.
KEY TAKEAWAYS
-
BY PRODUCT TYPEBy product type includes alkyl, vinyl, aryl and other product types. Alkyl, vinyl, aryl, and other specialized Grignard compounds, each serving distinct industrial needs. Alkyl Grignard reagents dominate due to their extensive use in synthesizing alcohols, acids, and pharmaceutical intermediates. Aryl Grignard reagents are gaining traction for producing advanced materials, fine chemicals, and aromatic compounds used in electronics and specialty polymers. Vinyl Grignard reagents are increasingly applied in polymer chemistry and high-performance coatings, supported by innovation in sustainable materials. Over the next few years, market growth is expected to be driven by rising pharmaceutical R&D, green chemistry advancements, and expanding applications in electronics and catalysts, positioning these product categories for steady and diversified global expansion.
-
BY APPLICATIONThe Grignard reagents market spans key application areas including APIs & drugs, agrochemicals, polymer synthesis & functionalization, and other specialty chemical uses. Over the coming years, market expansion will be fueled by advancements in green synthesis, increased R&D in organometallic chemistry, and the shift toward precision and specialty chemical manufacturing, ensuring steady growth across all major application domains.
-
BY End-Use IndustryThe Grignard reagents market serves diverse end-use industries including pharmaceutical & biotechnology, agriculture, chemicals, flavors & fragrances, and research, each contributing to its sustained expansion. Over the next decade, these industries are projected to grow steadily, propelled by R&D investments, demand for sustainable chemistry, and the shift toward high-value specialty applications.
-
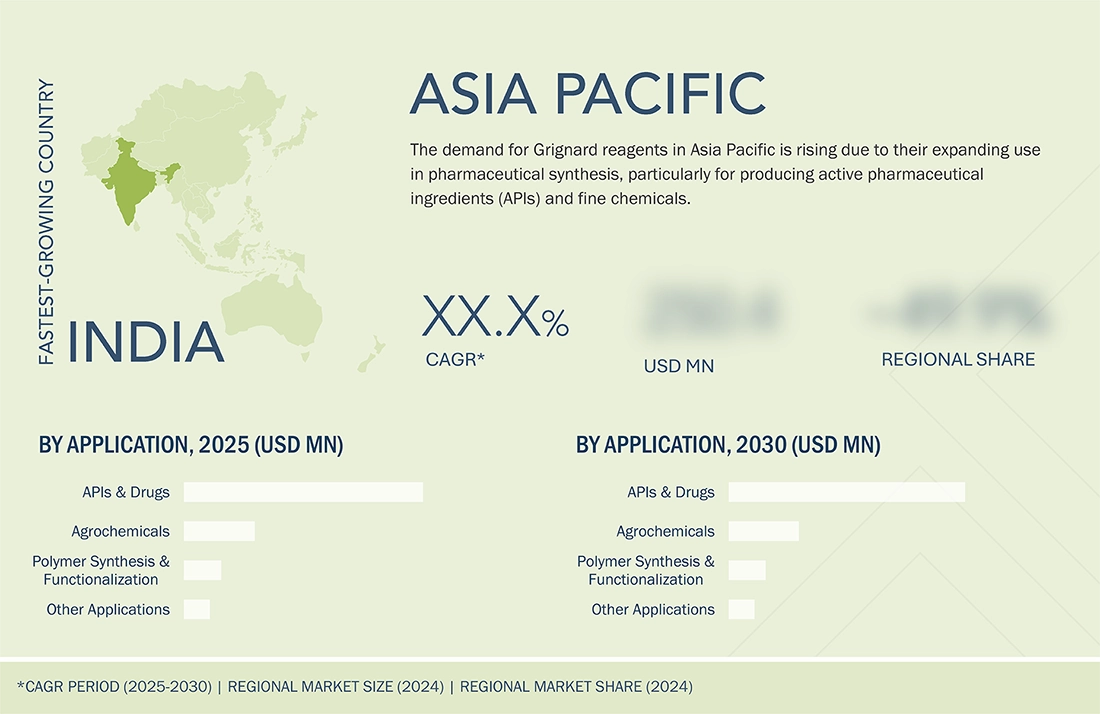
BY REGIONAsia Pacific is expected to grow fastest, with a CAGR of 7.2%, due to rapid industrialization, expanding chemical manufacturing capacity, and a strong surge in pharmaceutical and agrochemical production across countries like China, India, Japan, and South Korea. The region’s cost-effective raw materials, availability of skilled labor, and supportive government initiatives for domestic chemical and pharmaceutical R&D have encouraged large-scale adoption of organometallic reagents. Growing investment in specialty chemicals, polymers, and advanced material synthesis, along with the rise of contract manufacturing organizations (CMOs) and academic research collaborations, further supports demand.
-
COMPETITIVE LANDSCAPEThe market is driven by strategic collaborations, capacity expansions, and technological innovations from leading players such as Merck KGaA (Germany), Albemarle Corporation (US), WeylChem International GmbH (Germany), HOKKO CHEMICAL INDUSTRY CO., LTD. (Japan), CHEMIUM srl (Belgium). These companies are advancing grignard reagents and broadening end-use adoption, reflecting the growing demand for grignard reagents in various applications
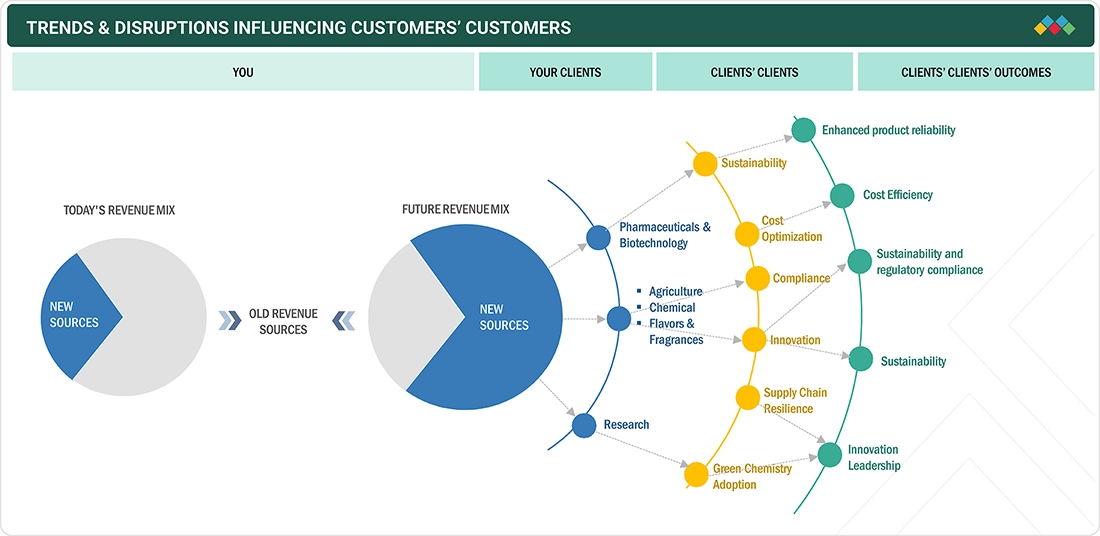
TRENDS & DISRUPTIONS IMPACTING CUSTOMERS' CUSTOMERS
The Grignard reagents market is witnessing significant trends and disruptions that are reshaping customer businesses across various industries. New formulations and innovative manufacturing techniques drive the development of products with improved efficiency. The increasing focus on sustainability and environmental regulations is prompting companies to adopt eco-friendly solutions, enhancing their operational efficiency and reducing their carbon footprint.
Source: Secondary Research, Interviews with Experts, MarketsandMarkets Analysis
MARKET DYNAMICS
Level
-
Technological advancement in Grignard reagent market

-
Rising demand from pharmaceutical industry

Level
-
Highly reactive and moisture sensitive nature

-
Environment and safety regulations

Level
-
Emergence of green chemistry and sustainable practices

-
Emerging market demand from Asia Pacific region

Level
-
Lack of skilled workforce

-
Complexities involved in scaling up processes

Source: Secondary Research, Interviews with Experts, MarketsandMarkets Analysis
Driver: Technological advancement in Grignard reagents
Technological innovations significantly advance the Grignard reagent market by effectively tackling challenges related to reactivity, safety, scalability, and environmental impact. Key developments include the adoption of continuous flow and microreactor technologies, which allow Grignard reactions to proceed under tightly controlled conditions. This reduces risks from heat buildup, reagent instability, and exothermic reactions. Flow chemistry supports on-demand synthesis, lowering the need to store and handle unstable intermediates and boosting safety along with operational efficiency. The introduction of solid-supported Grignard reagents further enhances stability, ease of handling, and compatibility with automated, scaled-up processes—beneficial in pharmaceutical and fine chemical manufacturing where consistency and precision are vital. The use of process analytical technologies (PAT) and automation enables real-time monitoring of reaction kinetics, temperature, and concentration, improving product quality and reproducibility. Additionally, green chemistry advancements promote sustainability, such as eco-friendly solvent systems that replace volatile ethers with safer alternatives and recyclable catalysts, helping companies meet regulatory and environmental standards without compromising reaction performance.
Restraint: Highly reactive and moisture sensitive nature of Grignard reagent
The high reactivity and moisture sensitivity of Grignard reagents pose a major obstacle to the growth of the Grignard reagent market. These organomagnesium compounds react violently with water, oxygen, and even small amounts of atmospheric moisture, leading to rapid degradation and loss of reactivity. This requires strict anhydrous conditions and inert atmospheres, such as nitrogen or argon, during storage, handling, and reactions. As a result, specialized glassware, dry solvents, and controlled environments are necessary, which increases operational costs and limits wider adoption, especially in small to medium-sized facilities and developing regions that lack such infrastructure. Additionally, accidental exposure to moisture can reduce product yield and consistency, making large-scale manufacturing challenging if reliability is compromised. These issues also complicate transportation and long-term storage, constraining supply chains and raising logistical costs. Although Grignard reagents are essential in synthetic chemistry, their reactive nature hampers commercial scalability, safety, and cost efficiency, restricting their broader market penetration.
Opportunity: Emergence of green chemistry and sustainable practices
The rise of green chemistry presents opportunities for Grignard reagents market players by aligning with global demand for safer, eco-friendly processes, particularly in the pharmaceutical sector, which accounts for 66% of applications. Green chemistry promotes sustainable routes for Grignard reactions, which are traditionally reliant on hazardous solvents such as diethyl ether and tetrahydrofuran. A case study from Beyond Benign shows a greener reaction at the College of New Jersey, reducing ether use, avoiding hexanes, and limiting magnesium waste—cutting environmental impact and costs. Regulatory pressures and industry trends toward sustainability, such as collaborations with My Green Lab and MilliporeSigma, drive these shifts. Innovations like CHEMIUM’s MgFlow Technology enable safer, continuous-flow production. Educational initiatives by organizations like Beyond Benign incorporate green chemistry into curricula, fostering a skilled workforce and supporting market growth. Utilizing greener solvents and catalysts, as outlined in the Green Chemistry Guide, enhances scalability and safety, making them appealing to industries seeking waste reduction, particularly in India’s expanding pharmaceutical sector.
Challenge: Lack of skilled workforce
The shortage of skilled workers hampers the growth of the Grignard reagents market, especially in rapidly industrializing regions like Asia Pacific and South America. Grignard reagents are highly reactive and require careful handling, controlled environments, and expertise. Lack of training can lead to lower yields, inefficiencies, safety hazards, and safety risks like fires due to their pyrophoric nature. A shortage of experienced chemists and process engineers can disrupt production, delay projects, and hinder the development of improved formulations. As demand for high-purity, application-specific reagents grows in sectors like pharmaceuticals, biotech, agriculture, chemicals, and electronics, specialized skills in quality control, analytical chemistry, and regulatory compliance are increasingly vital. Industries must invest in training, collaborate with academic institutions, and boost internal capabilities to better handle, package, and transport Grignard reagents.
Grignard Reagents Market: COMMERCIAL USE CASES ACROSS INDUSTRIES
| COMPANY | USE CASE DESCRIPTION | BENEFITS |
|---|---|---|
 |
Supplies high-purity Grignard reagents for pharmaceutical intermediates and fine chemical synthesis | Ensures consistent reactivity and scalability for drug discovery and custom synthesis |
 |
Manufactures bulk Grignard reagents for organometallic catalysis and polymerization processes | Provides large-scale, cost-efficient production with superior process control and purity |
 |
Develops tailor-made Grignard reagent solutions for agrochemical and specialty chemical applications | Offers flexible, customer-specific formulations enhancing reaction efficiency and selectivity |
 |
Produces Grignard reagents for electronic materials and fine organic synthesis | Delivers ultra-high purity reagents ensuring precision and performance in semiconductor and specialty synthesis |
 |
Specializes in custom synthesis of Grignard reagents for research and advanced material applications | Provides agility and innovation in small-batch, high-complexity organometallic reagent production |
Logos and trademarks shown above are the property of their respective owners. Their use here is for informational and illustrative purposes only.
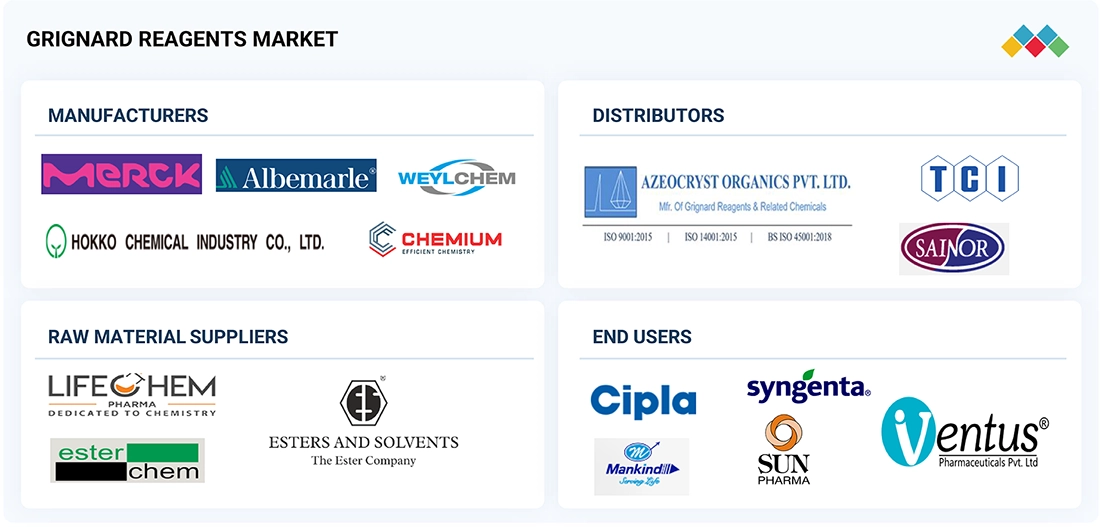
MARKET ECOSYSTEM
The Grignard reagents market ecosystem is a well-integrated network comprising raw material suppliers, manufacturers, distributors, research institutions, and end-use industries. Key raw materials—magnesium, halides, and organic halides—are sourced by reagent producers who develop tailored formulations for pharmaceuticals, agrochemicals, and specialty chemicals. Manufacturers and custom synthesis companies, such as Merck KGaA, Albemarle Corporation, and WeylChem, form the core of the ecosystem, supported by academic and industrial R&D partnerships that drive innovation in reaction efficiency and green chemistry. Distributors and contract manufacturers bridge the global supply and demand while end-users in healthcare, agriculture, and materials science anchor consumption. The ecosystem is evolving toward sustainability, digitalized supply chains, and collaborative innovation, enhancing scalability and responsiveness to diverse application needs worldwide.
Logos and trademarks shown above are the property of their respective owners. Their use here is for informational and illustrative purposes only.
MARKET SEGMENTS
Source: Secondary Research, Interviews with Experts, MarketsandMarkets Analysis
Grignard Reagents Market, By Product Type
Alkyl Grignard reagents currently command the largest share of the global Grignard reagent market, driven by their broad applicability, high reactivity, and suitability for large-scale organic synthesis. Comprising alkyl groups bonded to magnesium halides (R–MgX), these reagents are foundational to carbon-carbon bond formation—an essential step in the construction of complex molecular architectures. Their pronounced nucleophilic character enables efficient reactions with various electrophilic substrates, including aldehydes, ketones, esters, and epoxides. This versatility makes alkyl Grignard reagents indispensable in the synthesis of intermediates across multiple high-value sectors, particularly pharmaceuticals, agrochemicals, and specialty chemicals.
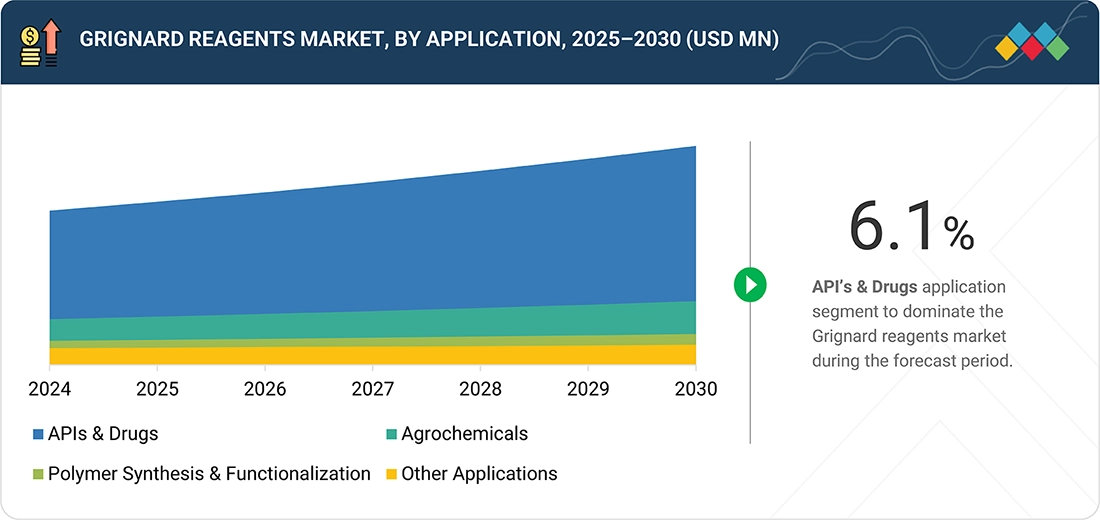
Grignard Reagents Market, By Application
APIs & drugs form the most significant application area for the Grignard reagents market, as drug outputs continue to grow globally, and Grignard chemistry will play a critical role in drug production. Both alkyl and aryl Grignard reagents facilitate carbon-carbon bond formation, which is essential for constructing the complex molecular frameworks required in modern drug compounds. These reagents are widely used in the synthesis of key pharmaceutical intermediates, including chiral molecules, ketones, and tertiary alcohols—critical components across therapeutic classes such as oncology, central nervous system (CNS) disorders, and anti-infective treatments.
Grignard Reagents Market, By End-Use Industry
The pharmaceutical and biotechnology sector is projected to hold the largest share of the Grignard reagents market, driven by the essential role these reagents play in the synthesis of active pharmaceutical ingredients (APIs) and complex drug intermediates. Due to their strong nucleophilic reactivity, Grignard reagents are widely recognized as versatile synthetic building blocks, enabling the formation of critical carbon-carbon and carbon-heteroatom bonds fundamental to the construction of complex molecular frameworks. In pharmaceutical chemistry, Grignard reagents play a crucial role in forming key structural motifs, including tertiary alcohols, ketones, and chiral centers.
REGION
Asia Pacific to be fastest-growing region in global grignard reagents market during forecast period
The Grignard reagents market in the Asia Pacific is expected to register the highest CAGR during the forecast period, propelled by rapid industrialization, expanding pharmaceutical production, and robust growth in the agrochemical sector. Key contributing countries include China, India, Japan, and South Korea, with China and India emerging as dominant global suppliers of active pharmaceutical ingredients (APIs). It is home to several Grignard reagent manufacturing companies, including Neogen Chemicals Ltd (India), Tokyo Chemical Industry (India) Pvt. Ltd. (India), Shaoxing Shangyu Hualun Chemical Co., Ltd. (China), and others.
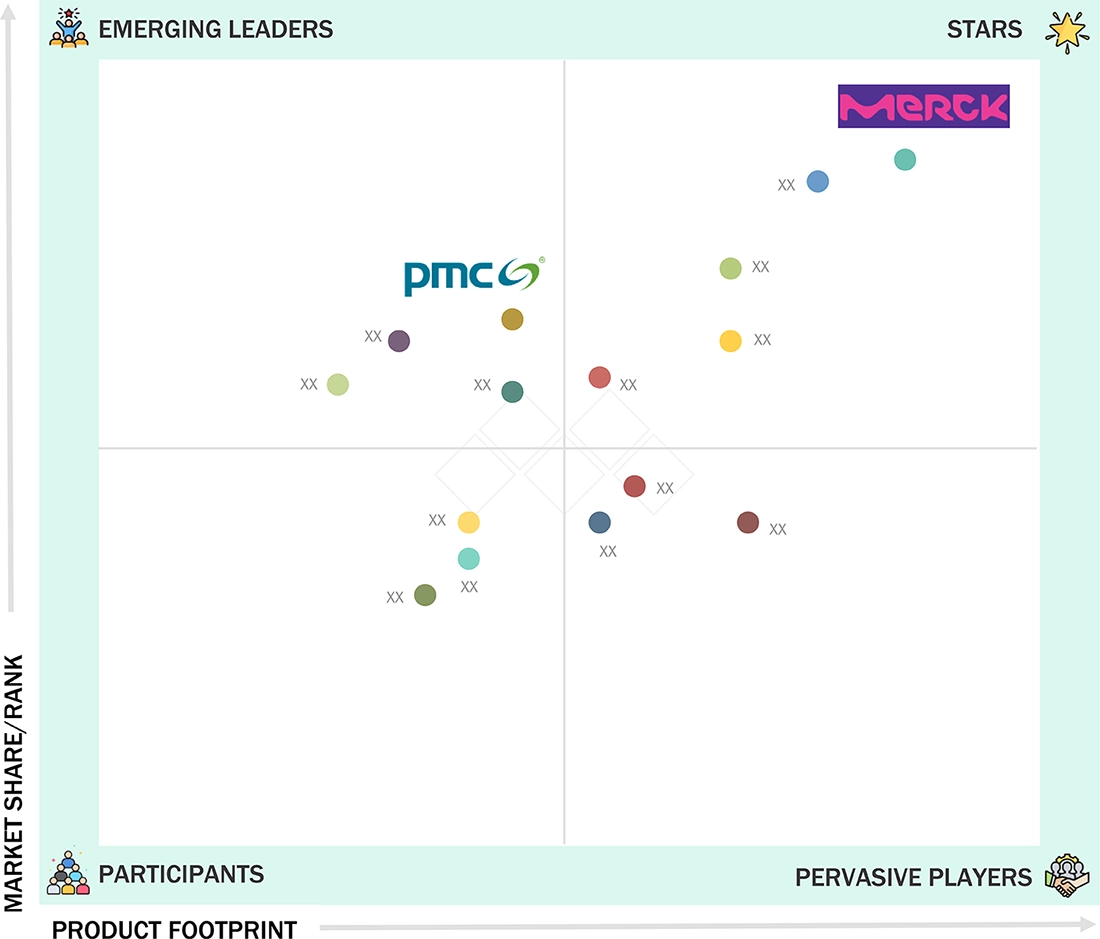
Grignard Reagents Market: COMPANY EVALUATION MATRIX
Merck KGaA (Star), a German company, leads the market through its manufacturing and distribution of Grignard reagents. Its long-standing R&D investments have enabled the development of highly durable, high-performance reagents that meet the demands of end-use industries like pharmaceuticals and biotechnology, agriculture, chemicals, flavors and fragrances, as well as research and development. Combined with its integrated business, large customer base, and worldwide distribution network, Merck KGaA is positioned as the market leader in driving the adoption of Grignard reagents.
Source: Secondary Research, Interviews with Experts, MarketsandMarkets Analysis
KEY MARKET PLAYERS
MARKET SCOPE
| REPORT METRIC | DETAILS |
|---|---|
| Market Size in 2024 (Value) | USD 4,821.0 Million |
| Market Forecast in 2030 (Value) | USD 6,683.1 Million |
| Growth Rate | CAGR of 5.7% from 2025–2030 |
| Years Considered | 2022–2030 |
| Base Year | 2024 |
| Forecast Period | 2025–2030 |
| Units Considered | Value (USD Million), Volume (Metric Tons) |
| Report Coverage | Revenue forecast, company ranking, competitive landscape, growth factors, and trends. |
| Segments Covered |
|
| Regions Covered | North America, Asia Pacific, Europe, South America, Middle East & Africa |
WHAT IS IN IT FOR YOU: Grignard Reagents Market REPORT CONTENT GUIDE
DELIVERED CUSTOMIZATIONS
We have successfully delivered the following deep-dive customizations:
| CLIENT REQUEST | CUSTOMIZATION DELIVERED | VALUE ADDS |
|---|---|---|
| APAC-based Grignard Reagents Manufacturers |
|
|
| Benchmarking of grignard reagent product Types (Alkyl, Vinyl, Aryl) | Comparative analysis of reagent providers, process efficiency, cost structure, and scalability | Supported clients in selecting the most cost-effective Grignard reagents |
| US Based grignard reagent raw material supplier | Tailored reagent formulations with specific alkyl, aryl, or vinyl groups, adjusted purity grades, solvent systems, and packaging sizes to meet client synthesis or production requirements | On-demand technical support, rapid delivery cycles within the U.S., regulatory compliance documentation (GMP, REACH, SDS), and collaborative R&D for optimized reaction performance and scalability |
| Application based grignard reagents products | Development of application-specific Grignard reagents optimized for pharmaceuticals, agrochemicals, or polymer synthesis—customizing concentration, solvent compatibility, and reactivity profiles for precise end-use performance | Technical collaboration for reaction optimization, impurity control, and scalability studies, along with analytical support, stability data, and regulatory documentation to accelerate client product development and compliance |
RECENT DEVELOPMENTS
- November 2023 : Chemium srl signed a Manufacturing Services Agreement with Swiss fine chemical company Valsynthese SA to host Grignard reagent production units utilizing Chemium’s proprietary MgFlow technology. This continuous flow process ensures enhanced safety through precise temperature control, efficient mixing, and reduced reaction volume—eliminating the risk of runaways typical in batch Grignard synthesis.
- September 2022 : Chemium Srl launched MgFlow Technology for Industrial-Scale Grignard Reagent Production. MgFlow is a continuous flow manufacturing platform for Grignard reagents based on flow chemistry principles and advanced process simulation.
Table of Contents
 Exclusive indicates content/data unique to MarketsandMarkets and not available with any competitors.
Methodology
The study involves two major activities in estimating the current size of the Grignard reagents market. Exhaustive secondary research was conducted to collect information on the market, peer market, and parent market. The next step was to validate these findings, assumptions, and sizing with industry experts across the value chain through primary research. Both top-down and bottom-up approaches were employed to estimate the complete market size. After that, market breakdown and data triangulation were used to estimate the market size of segments and subsegments.
Secondary Research
Secondary sources referred to for this research study include financial statements of companies offering Grignard reagents and information from various trade, business, and professional associations. Secondary research has been used to obtain critical information about the industry’s value chain, the total pool of key players, market classification, and segmentation according to industry trends to the bottom-most level and regional markets. The secondary data was collected and analyzed to arrive at the overall size of the Grignard reagents market, which was validated by primary respondents.
Primary Research
Extensive primary research was conducted after obtaining information regarding the Grignard reagents market scenario through secondary research. Several primary interviews were conducted with market experts from both the demand and supply sides across major countries of North America, Europe, Asia Pacific, Middle East & Africa, and South America. Primary data was collected through questionnaires, emails, and telephonic interviews. The primary sources from the supply side included various industry experts, such as Chief X Officers (CXOs), Vice Presidents (VPs), Directors from business development, marketing, product development/innovation teams, and related key executives from Grignard reagents industry vendors; material providers; distributors; and key opinion leaders. Primary interviews were conducted to gather insights such as market statistics, data on revenue collected from the products and services, market breakdowns, market size estimations, market forecasting, and data triangulation. Primary research also helped understand various trends related to product type, application, end-use industry, and region. Different stakeholders from the demand side, such as CIOs, CTOs, CSOs, and installation teams of the customer/end users who of Grignard reagents services, were interviewed to understand the buyer’s perspective on the suppliers, products, component providers, and their current usage of Grignard reagents and future outlook of their business, which will impact the overall market.
Breakup of Primary Research

To know about the assumptions considered for the study, download the pdf brochure
Market Size Estimation
The research methodology used to estimate the size of the Grignard reagents market includes the following details. The market sizing was undertaken from the demand side. The market was upsized based on the demand for Grignard reagents in different end-use industries at a regional level. Such procurements provide information on the demand aspects of the Grignard reagents industry for each application. All possible segments of the Grignard reagents market for each end use were integrated and mapped.

Data Triangulation
After arriving at the overall size from the market size estimation process explained above, the total market was split into several segments and subsegments. The data triangulation and market breakdown procedures explained below were implemented, wherever applicable, to complete the overall market engineering process and arrive at the exact statistics for various market segments and subsegments. The data was triangulated by studying various factors and trends from the demand and supply sides. The market size was also validated using both the top-down and bottom-up approaches.
Market Definition
Grignard reagents are used as versatile intermediates in organic synthesis. Grignard reagents are characterized by the general formula RMgX, where R represents an alkyl, aryl, or vinyl group, and X denotes a halide (typically chlorine, bromine, or iodine). These reagents are formed by the reaction of an alkyl or aryl halide with magnesium metal in anhydrous ether and are renowned for their nucleophilic reactivity, enabling the formation of carbon-carbon and carbon-heteroatom bonds. Grignard reagent types include alkyl, aryl, and vinyl Grignard reagents that are used in multiple industries, such as pharmaceuticals, biotechnology, agrochemicals, and specialty chemicals. These reagents are critical in the synthesis of active pharmaceutical ingredients (APIs), intermediates for crop protection chemicals, and various fine and performance chemicals.
Stakeholders
- Grignard reagent manufacturers
- Grignard reagents distributors and suppliers
- End-use industries
- Universities, governments, and research organizations
- Associations and industrial bodies
- R&D institutes
- Environmental support agencies
- Investment banks and private equity firms
- Research and consulting firms
Report Objectives
- To define, describe, and forecast the Grignard reagents market size in terms of volume and value
- To provide detailed information regarding the drivers, restraints, opportunities, and challenges influencing market growth
- To analyze and project the global Grignard reagents market based on product type, application, end-use industry, and region
- To forecast the market size concerning five main regions (along with country-level data), namely, North America, Europe, Asia Pacific, Middle East & Africa, and South America, and analyze the significant region-specific trends
- To strategically analyze micromarkets with respect to individual growth trends, prospects, and contributions of the submarkets to the overall market
- To analyze the market opportunities and the competitive landscape for stakeholders and market leaders
- To assess recent market developments and competitive strategies, such as acquisitions and product launches, to draw the competitive landscape
- To strategically profile the key market players and comprehensively analyze their core competencies
Key Questions Addressed by the Report
Who are the major companies in the Grignard reagents market? What key strategies have market players adopted to strengthen their market presence?
Major companies include Merck KGaA (Germany), Albemarle Corporation (US), WeylChem International GmbH (Germany), HOKKO CHEMICAL INDUSTRY CO., LTD. (Japan), CHEMIUM srl (Belgium), FAR Chemical (US), PMC Group, Inc (US), Boulder Scientific Group (US), Neogen Chemicals Ltd (India), Tokyo Chemical Industry (India) Pvt. Ltd. (India), Optima Chem (US), Shaoxing Shangyu Hualun Chemical Co., Ltd. (China), Nanjing Freehoo Chemical Technology Co., Ltd (China), Chemische Fabrik Karl Bucher GmbH (Germany), and Jiangsu Changjili New Energy Technology Co., Ltd. (China). Key strategies include deals and expansions.
What are the drivers and opportunities for the Grignard reagents market?
Technological advancements, rising demand from the pharmaceutical industry, emergence of green chemistry and sustainable practices, and increasing demand in Asia Pacific are key drivers and opportunities.
Which region is expected to hold the largest market share?
Asia Pacific is expected to be the largest market due to a strong industrial base, regulatory stringency, and technological leadership.
What is the projected growth rate of the Grignard reagents market over the next five years?
The market is projected to register a CAGR of 5.6% during the forecast period.
How is the Grignard reagents market aligned for future growth?
The market is showing considerable growth with regional players expanding production capacities, indicating a consolidated and strategically evolving market landscape.
Need a Tailored Report?
Customize this report to your needs
Get 10% FREE Customization
Customize This ReportPersonalize This Research
- Triangulate with your Own Data
- Get Data as per your Format and Definition
- Gain a Deeper Dive on a Specific Application, Geography, Customer or Competitor
- Any level of Personalization
Let Us Help You
- What are the Known and Unknown Adjacencies Impacting the Grignard Reagents Market
- What will your New Revenue Sources be?
- Who will be your Top Customer; what will make them switch?
- Defend your Market Share or Win Competitors
- Get a Scorecard for Target Partners

Custom Market Research Services
We Will Customise The Research For You, In Case The Report Listed Above Does Not Meet With Your Requirements
Get 10% Free CustomisationTESTIMONIALS

We at Nissan Chemicals Corporation have been clients of MarketsandMarkets for more than a year now. We recently consulted MarketsandMarkets for a study, the team at MarketsandMarkets was extremely professional and organized. The business insights were very detailed and aligned well with our expectations that really helped us formulate the Business Plans and device new strategies for development themes. MarketsandMarkets offers a unique combination of expertise and dedicated engagement model. Their research findings have helped us in designing our Pricing Strategy which will make it easier for us to predict the future sales and profits for the next ten years. We look forward to working with MarketsandMarkets in the future.
VP of Strategy & New Business Development
Leading Specialty Chemical Company
The MarketsandMarkets Engagement Model, composed of both the Knowledge Store and advisory custom research, has greatly helped us in understanding our markets and making strategic decisions. The Knowledge Store is a fast way to allow everyone in our organization to understand more about most any market they are interested in. The ability to then get custom research done and get answers to specific strategic questions and market insight has been spectacular. The Markets and Markets team feel more like colleagues than vendors and their services have helped us change our culture where statements of things like growth opportunities and competitive position are always backed by industry research.

Rich Gibson,
Director, Corporate Strategy
Milliken & Company,
Leading Industrial Manufacturer of specialty chemical, floor covering, performance and protective textile materials, and healthcaremilliken.com
MarketsandMarkets is a trusted resource that helps us to better understand markets that are near-adjacencies-whether its technology, value chain or geography. Their Knowledge Store platform provides a dashboard of markets and their characteristics which is easy to use and saves us time.
Adam Shaw,
Market Development and Strategy Manager
AdvanSix Inc. USA,
An American Leader in Chemicalswww.advansix.com
The Knowledge Store from MarketsandMarkets is a valuable tool which has helped my team acquire greater insight in to the end markets that our business serves. This has enabled us to help our company build stronger strategies throughout our planning process.
TOSHIO KINOSHITA
Senior Chif Consultion Research & Consulting Division
Mitsubishi Chemical Research Corporation,
Leading Manufacturer of Chemical Productswww.mitsubishichem-res.co.jp/en/

We recently engaged with MarketsandMarkets for a study, the team not only clearly understood our business objectives but was also extremely professional in the way they handled the entire project. The study was efficiently conducted in a phase-wise manner, and the engagement model furnished us with high-quality business insights that far exceeded our expectations at each phase. We were especially happy that MarketsandMarkets could provide us with both, an English as well as a Japanese version of the study. A special thanks to the Analyst Team and Client Services Team, whose fluency in Japanese enhanced our comfort level, as we could converse with them in our preferred language.
Independent entrepreneurs
Arrow Precision
We approached MarketsandMarkets for study on Proppants Market, and their work exceeded our expectations. The study conducted was comprehensive and enabled us to view the market through the various dimensions. In addition, the team was extraordinarily responsive throughout the process and resolved our queries on time. I strongly recommend MarketsandMarkets and will certainly consider them for additional market assessments we will need in the future.
Global engineering company, Japan
Deputy Manager,
Strategic Planning OfficeThe high-quality insights shared by the MarketsandMarkets team helped us understand the pharmaceutical plant designers in a specific geography. It also captured the risks that we may likely face in communicating with our potential partners. The study would enable us identify partners, which would impact our future growth.


Growth opportunities and latent adjacency in Grignard Reagents Market