
Hospital Filtration Market

Hospital Filtration Market by Type (Point of Use Filters, Inline Filters, Standalone Filtration Units, Disposable Filters), Process Type, Application (Hospital Facilities, Laboratories, Patient Care Equipment) and Region - Global Forecast to 2030


OVERVIEW
Source: Secondary Research, Interviews with Experts, MarketsandMarkets Analysis
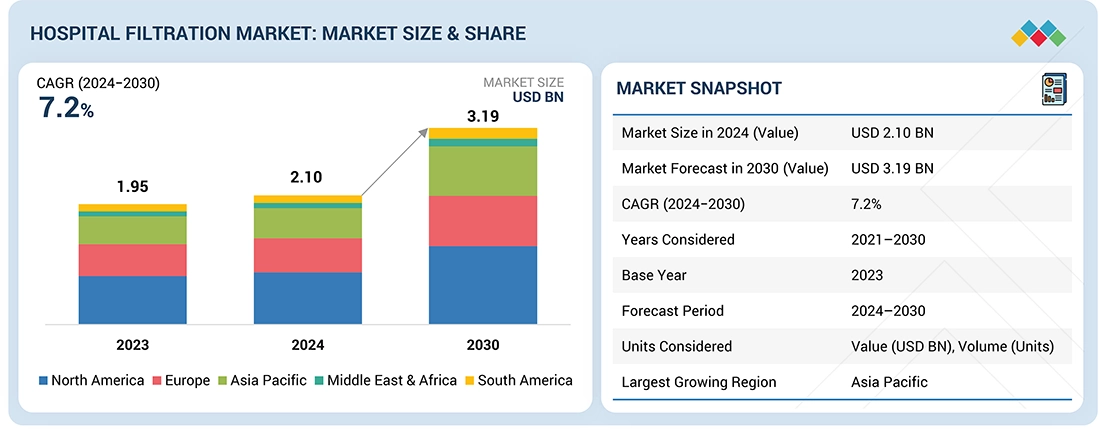
The hospital filtration market is projected to reach USD 3.19 billion by 2030 from USD 2.10 billion in 2024, at a CAGR of 7.2% from 2024 to 2030. The hospital filtration market is seeing strong and sustained growth worldwide. Rising awareness of infection control, stricter healthcare safety standards, and lessons from the pandemic are driving hospitals to upgrade air and water filtration systems.
KEY TAKEAWAYS
-
BY TYPEBy type, inline filters hold the largest share of the hospital filtration market, driven by their efficiency in providing continuous filtration within existing plumbing and ventilation systems. These filters are favored for their reliability, ease of integration, and effectiveness in maintaining sterile water and air conditions. Point-of-use filters are gaining traction for targeted protection in critical areas such as operating rooms and intensive care units, while standalone filtration units serve specialized applications requiring portable or supplemental filtration.
-
BY PROCESS TYPEThe hospital filtration market by process type includes HEPA filtration, reverse osmosis, ultrafiltration, gas filtration, and other methods, with HEPA filtration emerging as the largest segment. Renowned for its exceptional ability to trap fine particles and airborne microorganisms, HEPA technology is vital for maintaining sterile conditions and preventing infections in healthcare settings. Its dominance is further strengthened by stricter air quality regulations, advancements in filtration materials, and the heightened emphasis on infection control across hospitals worldwide
-
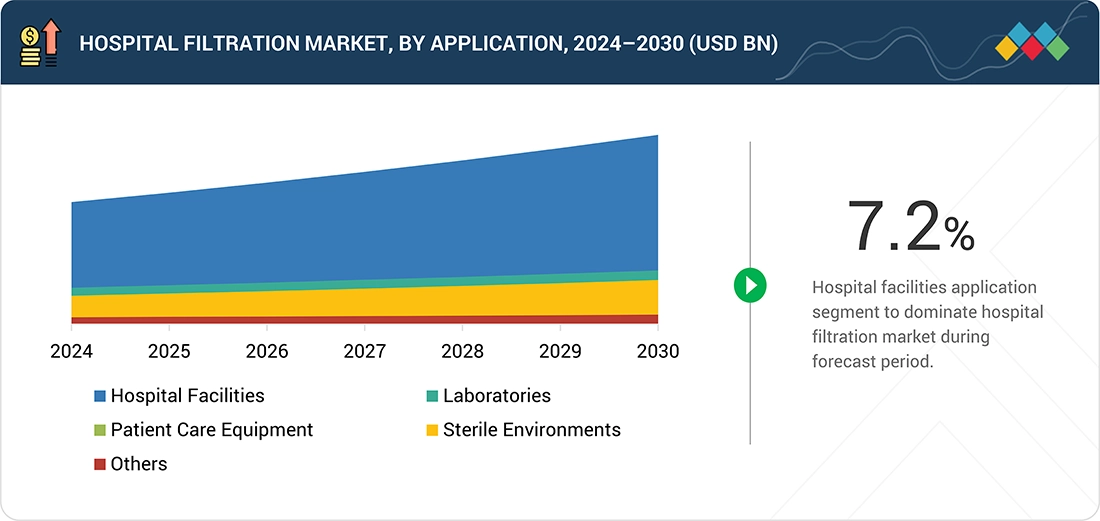
BY APPLICATIONThe hospital filtration market by application includes hospital facilities, laboratories, patient care equipment, and sterile environments, with hospital facilities accounting for the largest share. Filtration systems in these areas play a critical role in maintaining high air and water quality standards across hospital infrastructure. Their use helps prevent airborne contamination, supports infection control measures, and ensures a safe, compliant environment for both patients and healthcare professionals.
-
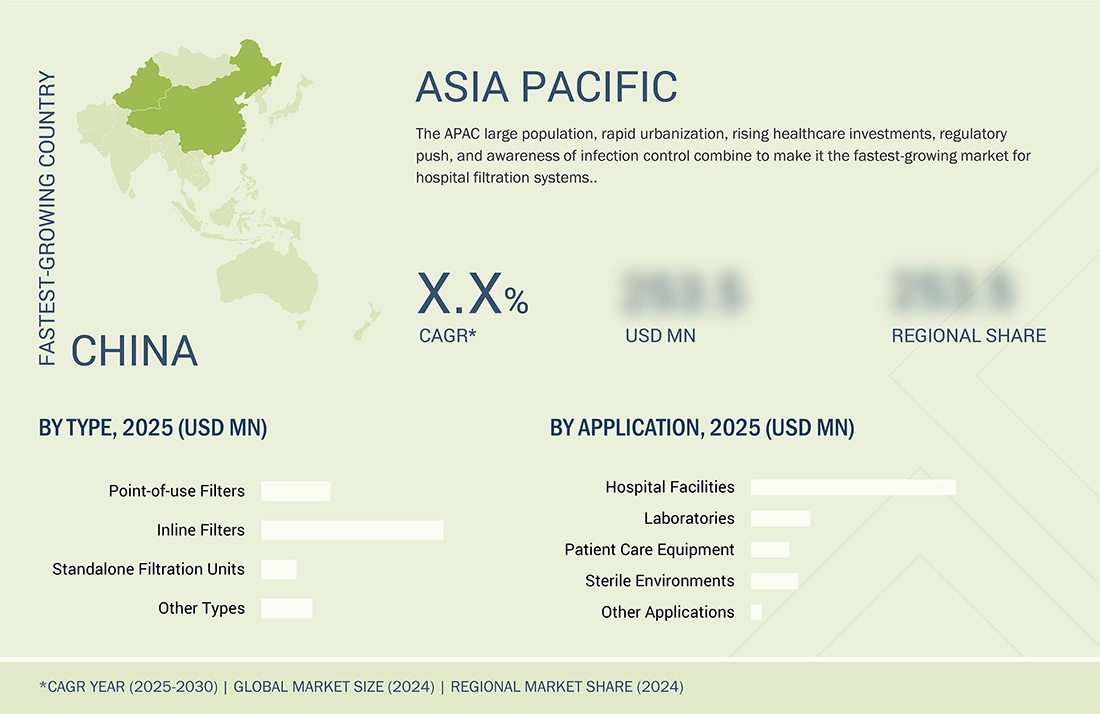
BY REGIONAsia Pacific is expected to grow fastest, with a CAGR of 8.7%, driven by industrialization, urbanization, and rising energy efficiency demands. Expanding sectors such as HVAC, power generation, chemicals, and EVs further accelerate adoption across the region.
-
COMPETITIVE LANDSCAPEThe market is driven by strategic collaborations, new product launch, capacity expansions, and technological innovations from leading players such as Danaher (US), Veolia (France), Pentair (US), Merck KgaA (Germany), Daikin Industries (Japan), Camfil (Sweden), Freudenberg Technologies (Germany), Solventum (US), Sartorius AG (Germany), and Parker Hannifin Corp. (US). .These companies are heavily investing in new technologies.
The hospital filtration market is witnessing steady and widespread growth globally. Increasing focus on infection prevention, tightening health regulations, and heightened post-pandemic awareness are prompting hospitals to invest in advanced filtration systems. Innovations in smart, energy-efficient technologies are also enhancing adoption. Regionally, North America and Europe lead with established standards and upgrades, while Asia-Pacific shows the fastest growth due to expanding healthcare infrastructure and rising public health investments
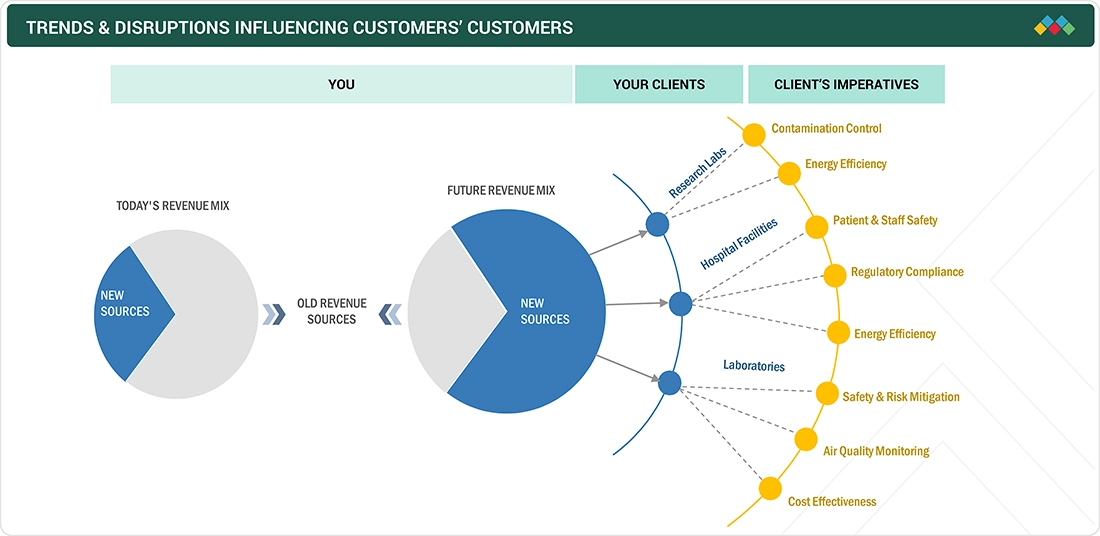
TRENDS & DISRUPTIONS IMPACTING CUSTOMERS' CUSTOMERS
Changes in customer trends or disruptions impact consumers’ businesses. These shifts impact the revenues of end users. Consequently, the revenue impact on end users is expected to affect the revenues of hospital filtration products suppliers, which, in turn, impacts the revenues of hospital filtration product manufacturers.
Source: Secondary Research, Interviews with Experts, MarketsandMarkets Analysis
MARKET DYNAMICS
Level
-
Expansion of healthcare infrastructure

-
Surge in aging population and chronic diseases

Level
-
High initial investments for advanced filtration systems

Level
-
Rising demand for filtration in emerging markets

-
Surge in medical tourism and expansion of high-end healthcare facilities

Level
-
Integration of advanced filtration systems with existing ones

-
Stringent regulations and quality standards

Source: Secondary Research, Interviews with Experts, MarketsandMarkets Analysis
Driver: Expansion of healthcare infrastructure
Expanding healthcare infrastructure in developing regions primarily drives the hospital filtration market. Increasing investments in the construction of hospitals, clinics, and other healthcare facilities also create a need for modern filtration to maintain clean and sterile environments. Rapid urbanization and population growth drive the development of new medical facilities and the modernization of existing ones to meet contemporary standards. Additionally, there is a growing need for specialized filtration systems in operating rooms, intensive care units (ICUs), and isolation chambers to ensure controlled air and water quality. The increased attention to healthcare-associated infections (HAI) has fueled demand for effective filtration systems that guarantee clean and secure environments for patients and healthcare personnel. China, India, the UK, Qatar, Bahrain, Iraq, and Kenya are allocating funds to build new and upgrade old hospital facilities to meet future demand. The UK government plans to build 40 new hospitals by 2030 under the New Hospital Program. Bahrain is expanding its healthcare infrastructure by upgrading medical equipment and enhancing access to healthcare services. The Healthy China 2030 initiative supports the expansion of advanced healthcare facilities with modern air and water filtration technologies
Restraints: High initial investments for advanced filtration systems
The significant investment required for advanced hospital filtration systems impacts the market adversely, particularly in developing regions with tight healthcare budgets. Although these advanced systems can result in significant long-term savings, their adoption remains limited. Public healthcare facilities encounter severe financial limitations, making the acquisition, installation, and upkeep of expensive HEPA filters, activated carbon filters, and even UV-C sterilization methods highly inefficient. Due to the operational costs associated with regular filter replacements, increased energy consumption, and modified HVAC systems, many public hospitals face minimal cost constraints. This lack of funding leaves little room for investment in advanced hospital filtration systems.Even though the returns on investment outweigh the costs by improving energy efficiency and reducing airborne infections, the short-term financial goals placed by the government make these investments highly ineffective. Hence, short-term financial goals and rigid frameworks make it difficult to adopt advanced filtration systems. In more constrained regions, developing countries, or underfunded healthcare systems, the high cost of advanced filtration systems may further deter adoption even when the demand for filtration exists
Opportunity: Rising demand for filtration in emerging markets.
The increased need for hospital filtration systems in new markets provides a noteworthy opportunity for growth, particularly in developing countries such as India, China, and Brazil. These nations are experiencing major investments in their healthcare infrastructure due to economic expansion, increasing urban migration, and the rising elderly population in these countries. India’s healthcare system is growing tremendously, with the government setting aside USD 10.87 billion in the 2024-25 budget for improving the whole infrastructure. Moreover, private investments in Indian healthcare crossed USD 1 billion during the opening of 2024 due to the growing need for advanced medical facilities, such as effective measures to combat the spread of infections and improve overall air quality. China’s healthcare market has been steadily growing at a rate exceeding 10%, hitting USD 1.5 trillion in 2021, with estimates reaching USD 2.4 trillion by 2030 due to the Healthy China 2030 campaign. China has over 36,500 hospitals and an aging population of 366 million by 2050, making it a good target for the hospital filtration market. In contrast, Brazil, the largest healthcare market in Latin America, allocates 9.47% of its GDP on healthcare spending, which amounts to USD 161 billion. The country’s rapidly aging population further drives the need for hospital filtration
Challenge: Integration of advanced filtration systems with existing ones
Modifying filtration systems for every facility is a complicated issue for the healthcare sector. Many healthcare facilities in developing countries are severely neglected, as their ventilation and air purification systems are outdated and unable to accommodate modern HEPA filtration, ultraviolet sterilization, and other advanced filtration methods. Retrofitting such systems is often limited by the existing HVAC, ducting, and airflow control systems, which are already in place, thus increasing the expense and disorder. Similarly, updating the plumbing systems to support RO filtration and ultrafiltration for purification can involve serious modifications to the existing systems, including pipes, water tanks, and waste management systems. These modifications can result in downtime and disrupt the hospital’s operations, leading to lost revenue. Older hospitals may have small budget allocations for such advanced infrastructure improvements, specifically when most resources must be distributed across other pressing needs such as patient care and upgrading medical equipment. Also, these hospitals tend to have old filtration systems, including mechanical filters or primitive air exchange methods. Additionally, regulatory compliance complicates integration as hospitals must reduce air pollution and control infections without disrupting critical care areas
Hospital Filtration Market: COMMERCIAL USE CASES ACROSS INDUSTRIES
| COMPANY | USE CASE DESCRIPTION | BENEFITS |
|---|---|---|
 |
Use of HEPA and ULPA air filtration in operating rooms and ICUs | Reduces airborne pathogens, improves patient safety, ensures compliance with infection-control standards |
 |
Implementation of point-of-use water filters in dialysis and critical care units | Provides sterile water, minimizes risk of waterborne infections, enhances patient care quality |
 |
Standalone air filtration units in patient wards and waiting areas | Improves indoor air quality, reduces cross-contamination, enhances patient and staff comfort |
 |
HEPA filtration in laboratories, operation theatres, and sterile environments | Maintains sterile conditions, reduces hospital-acquired infections, ensures high air quality standards |
Logos and trademarks shown above are the property of their respective owners. Their use here is for informational and illustrative purposes only.
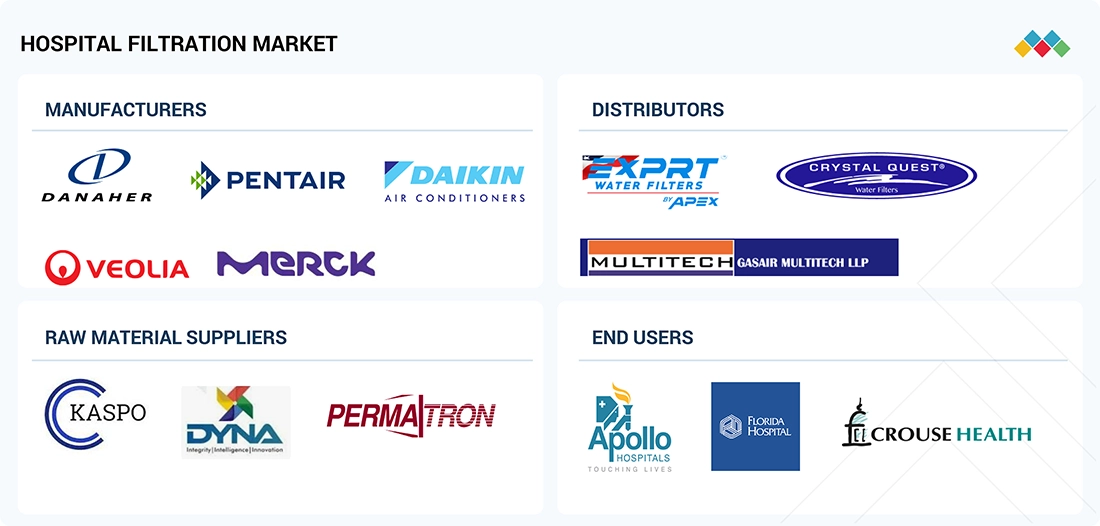
MARKET ECOSYSTEM
The hospital filtration ecosystem analysis involves identifying and analyzing interconnected relationships among various stakeholders, including raw material supplies, equipment suppliers, manufacturers, distributors, and end users. The raw material suppliers provide air filters, water filters, and others to hospital filtration manufacturers. The distributors and suppliers establish contact between the manufacturing companies and end users to streamline the supply chain, increasing operational efficiency and profitability.
Logos and trademarks shown above are the property of their respective owners. Their use here is for informational and illustrative purposes only.
MARKET SEGMENTS
Source: Secondary Research, Interviews with Experts, MarketsandMarkets Analysis
Hospital Filtration Market, By Type
Inline filters are one of the largest and most widely used types of filtration products in hospitals, designed to be installed directly within a fluid pathway such as an IV line, tubing, or water system. Their primary function is to remove particles, microbes, and air bubbles from fluids as they flow through, ensuring sterility and patient safety. They are commonly used in intravenous therapy, total parenteral nutrition, blood transfusions, pharmaceutical production, and respiratory systems, including ventilator lines. Inline filters come in several types, including sterile-grade membrane filters for bacteria and endotoxin removal, particulate filters for solid debris, depth filters for larger volumes of contaminants, and air-eliminating filters to remove air bubbles from fluids. The filter membranes are typically made from PVDF, PES, Nylon, or cellulose acetate, while housings are constructed from medical-grade plastics such as polycarbonate or polypropylene, sometimes stainless steel, with silicone or rubber seals to prevent leakage. The main advantages of inline filters include continuous filtration without interrupting fluid flow, maintenance of sterility, prevention of complications from particulates, and the ability to handle relatively large fluid volumes
Hospital Filtration Market, By Application
Hospital facilities represent the largest application for inline filtration products, as these filters are used extensively across a wide range of critical fluid and air systems. They are integral to intravenous therapy lines, total parenteral nutrition, blood transfusions, pharmaceutical preparation areas, and respiratory equipment such as ventilator lines, where their primary function is to remove particles, microbes, and air bubbles to ensure sterility and patient safety. Regionally, North America leads the hospital filtration market, driven by stringent infection control standards and substantial healthcare infrastructure investments. Europe is seeing increasing demand due to regulatory requirements and a focus on sustainability in healthcare facilities, including retrofitting HVAC systems with high-efficiency filters. Meanwhile, the Asia-Pacific region, particularly countries like India and China, is experiencing rapid growth in healthcare infrastructure, which is driving the adoption of inline filters to maintain high-quality patient care.
REGION
Asia Pacific to be fastest-growing region in global hospital filtration market during forecast period
Due to several factors that promote the expansion of healthcare infrastructure and technological adoption, the Asia Pacific region remains the most dynamic and fastest-growing market for hospital filtration systems. For instance, the rapid urbanization and population growth in China, India, and some Southeast Asian countries triggered the proliferation of hospitals and healthcare facilities to cater to people’s needs.The government and private sectors are pouring resources into healthcare infrastructure development in response to pervasive health challenges, including increased healthcare-associated infections (HAIs). The Chinese government’s ambitious hospital expansion projects and healthcare developments, the Indian government’s investment, and the Universal Healthcare Bill, which provides free and compulsory healthcare facilities, further support this market. The increasing awareness of infection control and the effects of the COVID-19 pandemic have revealed and underscored the necessity of advanced filtration technologies. The region’s increasing use of modern medical equipment and air and water quality filtration regulations elicit the growth of the filtration system market. With increasing disposable income and healthcare expenditure, these factors place Asia Pacific at the forefront as the ever-changing and ever-expanding market for hospital filtration systems
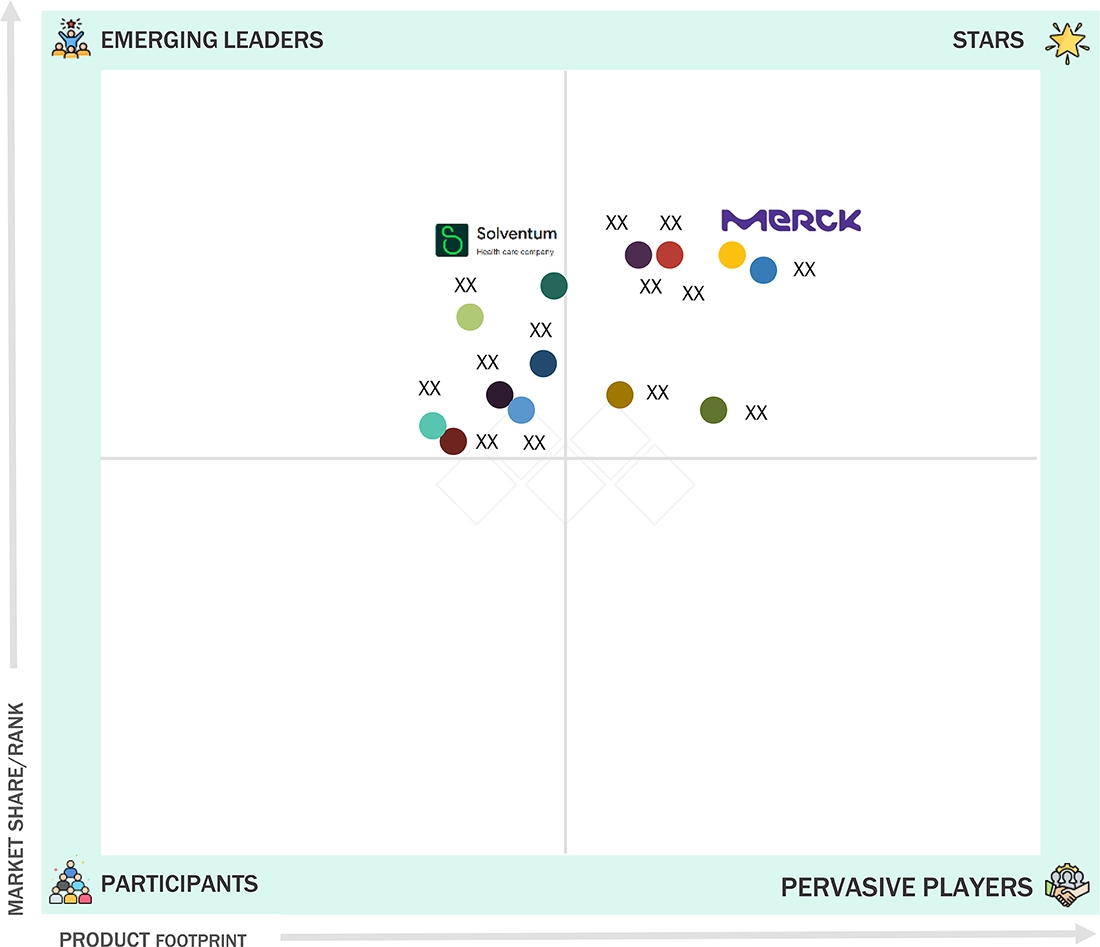
Hospital Filtration Market: COMPANY EVALUATION MATRIX
In the hospital filtration market matrix, Pentair (Star), a US company, leads the market through its high-quality hospital filtration products, which find extensive applications in various applications such as hospital facililitis, laboratories and others.Solventum (Emerging Leader) is gaining traction with its technological advancements in hospital filtration.
Source: Secondary Research, Interviews with Experts, MarketsandMarkets Analysis
KEY MARKET PLAYERS
MARKET SCOPE
| REPORT METRIC | DETAILS |
|---|---|
| Market Size Value in 2024 | USD 2.10 Billion |
| Revenue Forecast in 2030 | USD 3.19 Billion |
| Growth Rate | CAGR of 7.2% from 2024-2030 |
| Years Considered | 2024–2030 |
| Base year | 2023 |
| Forecast period | 2024-2030 |
| Units considered | Value (USD Billion), Volume (Unit) |
| Report Coverage | Revenue forecast, company ranking, competitive landscape, growth factors, and trends |
| Segments Covered | · By Type: Point-of-use-filters, Inline Filters, Standalone Filtration Units, Others. By Process Type: HEPA, Reverse Osmosis, Ultrafiltration, Gas Filtration and Others· By Application: Hospital Facilities, Laboratories, Patient Care Equipment, Sterile Environments and others |
| Regional Scope | Europe, North America, Asia Pacific, the Middle East & Africa, and South America |
WHAT IS IN IT FOR YOU: Hospital Filtration Market REPORT CONTENT GUIDE
DELIVERED CUSTOMIZATIONS
We have successfully delivered the following deep-dive customizations:
| CLIENT REQUEST | CUSTOMIZATION DELIVERED | VALUE ADDS |
|---|---|---|
| Interest in competitive benchmarking | • Provided a comparison of top hospital filtration products suppliers by product range, and market presence | • Supported go-to-market strategy and positioning vs competitors) |
| Need to assess future market growth hotspots | • Created a forecast model highlighting demand in APAC and other regions | • Guided client’s investment priorities toward regions with the strongest growth outlook |
RECENT DEVELOPMENTS
- September 2024 : Cytiva, a global leader in life sciences, inaugurated its first Innovation Hub in Korea, situated within the Songdo Bio-cluster in Incheon. This state-of-the-art hub will include a manufacturing facility and a customer experience lab. Scheduled to commence operations in 2026, the manufacturing facility will focus on producing high-quality filtration products
- June 2024 : Merck, a global leader in science and technology, announced a USD 67 million investment in a new quality control facility at its Darmstadt headquarters for its Life Science business. The state-of-the-art, 10,000-square-meter building will house approximately 135 employees from various departments in a collaborative environment. Scheduled for completion by mid-2025, the facility is part of a broader investment program at the Darmstadt site. It will provide production-related quality control services to support the Life Science business
- May 2023 : Cytiva and Pall Corporation’s life sciences division successfully integrated, uniting under the Cytiva brand. Pall’s biotech portfolio is now part of Cytiva’s bioprocess business as a product family, while the Pall medical portfolio remains a distinct market brand within Cytiva. Pall Corporation continues to operate as a Danaher company, serving customers across various industrial applications
- July 2022 : Pentair acquired Manitowoc Ice from Welbilt, Inc. for USD 1.6 billion. This strategic move strengthens Pentair’s position in the industry by expanding its total water management offerings, enabling the company to better serve a broader network of channel partners and customers. The acquisition further solidifies Pentair’s leadership in a rapidly growing and dynamic market
- March 2022 : Veolia entered into agreements with Veolia Water Technologies in Asia Pacific to market, sell, and deliver specific Veolia products. It enables the company to strengthen its local customer support and regional product offerings. These new contracts cover numerous countries, including China, Indonesia, Malaysia, Thailand, Vietnam, Bangladesh, Sri Lanka, and New Zealand
Table of Contents
 Exclusive indicates content/data unique to MarketsandMarkets and not available with any competitors.
Methodology
The study involved four major activities in estimating the market size of the hospital filtration market. Exhaustive secondary research was done to collect information on the market, the peer market, and the parent market. The next step was to validate these findings, assumptions, and sizing with industry experts across the value chain through primary research. Both top-down and bottom-up approaches were employed to estimate the complete market size. Thereafter, the market breakdown and data triangulation procedures were used to estimate the market size of the segments and subsegments.
Secondary Research
In the secondary research process, various secondary sources have been referred to for identifying and collecting information for this study. These secondary sources include annual reports, press releases, investor presentations of companies, corporate documents, white papers, certified publications, trade directories, certified publications, articles from recognized authors, associations, gold standard and silver standard websites, and databases.
Secondary research has been used to obtain key information about the value chain of the industry, monetary chain of the market, the total pool of key players, market classification and segmentation according to industry trends to the bottom-most level, and regional markets. It was also used to obtain information about the key developments from a market-oriented perspective.
Primary Research
The hospital filtration market comprises several stakeholders in the value chain, which include raw material suppliers, OEM manufacturers, distributors and end user. Various primary sources from the supply and demand sides of the hospital filtration market have been interviewed to obtain qualitative and quantitative information. The primary interviewees from the demand side include key opinion leaders in end-use sectors. The primary sources from the supply side include manufacturers, associations, and institutions involved in the hospital filtration industry.
Primary interviews were conducted to gather insights such as market statistics, data of revenue collected from the products and services, market breakdowns, market size estimations, market forecasting, and data triangulation. Primary research also helped in understanding the various trends related to type, form, end-use industry and region. Stakeholders from the demand side, such as CIOs, CTOs, and CSOs were interviewed to understand the buyer’s perspective on the suppliers, products, component providers, and their current usage of hsopital filtration and future outlook of their business which will affect the overall market.
The breakdown of profiles of the primary interviewees is illustrated in the figure below:

Note: Tier 1, Tier 2, and Tier 3 companies are classified based on their market revenue in 2023 available in the public domain, product portfolios, and geographical presence.
Other designations include sales representatives, production heads, and technicians.
To know about the assumptions considered for the study, download the pdf brochure
Market Size Estimation
The top-down approach was used to estimate and validate the size of various submarkets for hospital filtration for each region. The research methodology used to estimate the market size included the following steps:
- The key players in the industry have been identified through extensive secondary research.
- The supply chain of the industry has been determined through primary and secondary research.
- The global market was then segmented into five major regions and validated by industry experts.
- All percentage shares, splits, and breakdowns based on type, process typp, applicaton and region were determined using secondary sources and verified through primary sources.
- All possible parameters that affect the markets covered in this research study were accounted for, viewed in extensive detail, verified through primary research, and analyzed to get the final quantitative and qualitative data. This data was consolidated and added with detailed inputs and analysis and presented in this report.
The market size include the following:

Data Triangulation
After arriving at the total market size from the estimation process of for hospital filtration above, the overall market has been split into several segments and sub-segments. To complete the overall market engineering process and arrive at the exact statistics for all the segments and sub-segments, the data triangulation and market breakdown procedures have been employed, wherever applicable. The data has been triangulated by studying various factors and trends from both the demand and supply sides. Along with this, the market size has been validated by using both the top-down and bottom-up approaches and primary interviews. Hence, for every data segment, there have been three sources—top-down approach, bottom-up approach, and expert interviews. The data was assumed correct when the values arrived from the three sources matched.
Market Definition
The hospital filtration encompasses the range of products, systems, and technologies designed to filter and purify air and water within healthcare settings. These systems play a critical role in maintaining sterile environments by removing airborne and waterborne contaminants, such as bacteria, viruses, particulates, and harmful chemicals.
Stakeholders
- Filter manufacturers
- Raw material suppliers
- End-use Industries
- Hospital filtration traders, distributors, and suppliers
- Research organizations
- Industry associations
- Governments and research organizations
Report Objectives
- To define, describe, and forecast the size of the hospital filtration market, in terms of value and volume.
- To provide detailed information regarding the major factors (drivers, opportunities, restraints, and challenges) influencing the growth of the market.
- To estimate and forecast the market size based on type, process type, application, and region.
- To forecast the size of the market with respect to major regions, namely, Europe, North America, Asia Pacific, Middle East & Africa, and South America, along with their key countries.
- To strategically analyze micromarkets with respect to individual growth trends, prospects, and their contribution to the overall market.
- To analyze opportunities in the market for stakeholders and provide a competitive landscape of market leaders.
- To track and analyze recent developments such as expansions, new product launches, partnerships, mergers and acquisitions in the market.
- To strategically profile key market players and comprehensively analyze their core competencies.
Key Questions Addressed by the Report
Need a Tailored Report?
Customize this report to your needs
Get 10% FREE Customization
Customize This ReportPersonalize This Research
- Triangulate with your Own Data
- Get Data as per your Format and Definition
- Gain a Deeper Dive on a Specific Application, Geography, Customer or Competitor
- Any level of Personalization
Let Us Help You
- What are the Known and Unknown Adjacencies Impacting the Hospital Filtration Market
- What will your New Revenue Sources be?
- Who will be your Top Customer; what will make them switch?
- Defend your Market Share or Win Competitors
- Get a Scorecard for Target Partners

Custom Market Research Services
We Will Customise The Research For You, In Case The Report Listed Above Does Not Meet With Your Requirements
Get 10% Free CustomisationTESTIMONIALS

We at Nissan Chemicals Corporation have been clients of MarketsandMarkets for more than a year now. We recently consulted MarketsandMarkets for a study, the team at MarketsandMarkets was extremely professional and organized. The business insights were very detailed and aligned well with our expectations that really helped us formulate the Business Plans and device new strategies for development themes. MarketsandMarkets offers a unique combination of expertise and dedicated engagement model. Their research findings have helped us in designing our Pricing Strategy which will make it easier for us to predict the future sales and profits for the next ten years. We look forward to working with MarketsandMarkets in the future.
VP of Strategy & New Business Development
Leading Specialty Chemical Company
The MarketsandMarkets Engagement Model, composed of both the Knowledge Store and advisory custom research, has greatly helped us in understanding our markets and making strategic decisions. The Knowledge Store is a fast way to allow everyone in our organization to understand more about most any market they are interested in. The ability to then get custom research done and get answers to specific strategic questions and market insight has been spectacular. The Markets and Markets team feel more like colleagues than vendors and their services have helped us change our culture where statements of things like growth opportunities and competitive position are always backed by industry research.

Rich Gibson,
Director, Corporate Strategy
Milliken & Company,
Leading Industrial Manufacturer of specialty chemical, floor covering, performance and protective textile materials, and healthcaremilliken.com
MarketsandMarkets is a trusted resource that helps us to better understand markets that are near-adjacencies-whether its technology, value chain or geography. Their Knowledge Store platform provides a dashboard of markets and their characteristics which is easy to use and saves us time.
Adam Shaw,
Market Development and Strategy Manager
AdvanSix Inc. USA,
An American Leader in Chemicalswww.advansix.com
The Knowledge Store from MarketsandMarkets is a valuable tool which has helped my team acquire greater insight in to the end markets that our business serves. This has enabled us to help our company build stronger strategies throughout our planning process.
TOSHIO KINOSHITA
Senior Chif Consultion Research & Consulting Division
Mitsubishi Chemical Research Corporation,
Leading Manufacturer of Chemical Productswww.mitsubishichem-res.co.jp/en/

We recently engaged with MarketsandMarkets for a study, the team not only clearly understood our business objectives but was also extremely professional in the way they handled the entire project. The study was efficiently conducted in a phase-wise manner, and the engagement model furnished us with high-quality business insights that far exceeded our expectations at each phase. We were especially happy that MarketsandMarkets could provide us with both, an English as well as a Japanese version of the study. A special thanks to the Analyst Team and Client Services Team, whose fluency in Japanese enhanced our comfort level, as we could converse with them in our preferred language.
Independent entrepreneurs
Arrow Precision
We approached MarketsandMarkets for study on Proppants Market, and their work exceeded our expectations. The study conducted was comprehensive and enabled us to view the market through the various dimensions. In addition, the team was extraordinarily responsive throughout the process and resolved our queries on time. I strongly recommend MarketsandMarkets and will certainly consider them for additional market assessments we will need in the future.
Global engineering company, Japan
Deputy Manager,
Strategic Planning OfficeThe high-quality insights shared by the MarketsandMarkets team helped us understand the pharmaceutical plant designers in a specific geography. It also captured the risks that we may likely face in communicating with our potential partners. The study would enable us identify partners, which would impact our future growth.


Growth opportunities and latent adjacency in Hospital Filtration Market