
Hydrogen Sulfide Scavengers Market

Hydrogen Sulfide Scavengers Market by Type (water soluble, oil soluble, gas-phase), Chemistry (triazine, nitrite, iron sponge), End-use (crude oil, natural gas, geothermal energy, industrial process), & Region - Global Forecast to 2030
Updated on : November 27, 2025


HYDROGEN SULFIDE SCAVENGERS MARKET
Source: Secondary Research, Interviews with Experts, MarketsandMarkets Analysis
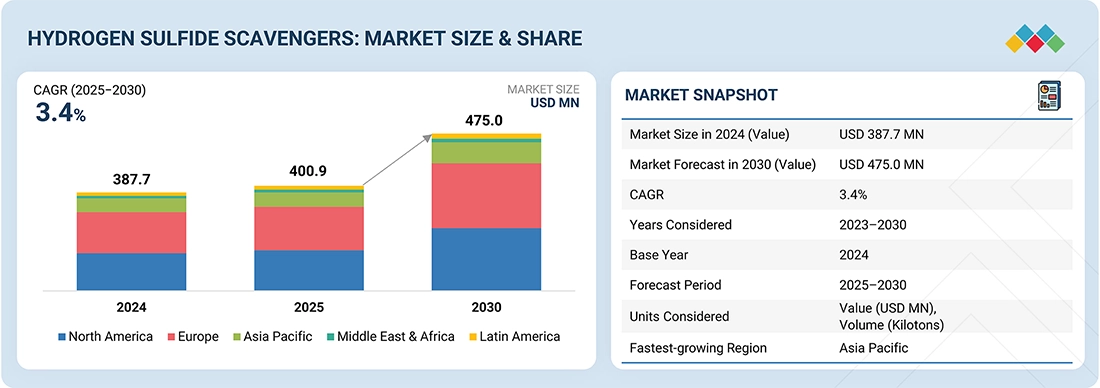
The global hydrogen sulfide scavengers market was valued at USD 400.9 million in 2025 and is projected to reach USD 475.0 million by 2030, growing at 3.4% cagr from 2025 to 2030. The rising demand for hydrogen sulfide scavengers is driven by increasing oil and gas production, where H2S poses significant safety, corrosion, and environmental challenges. Stricter global regulations on emissions and workplace safety standards further accelerate the adoption of scavengers to ensure compliance and operational efficiency.
KEY TAKEAWAYS
-
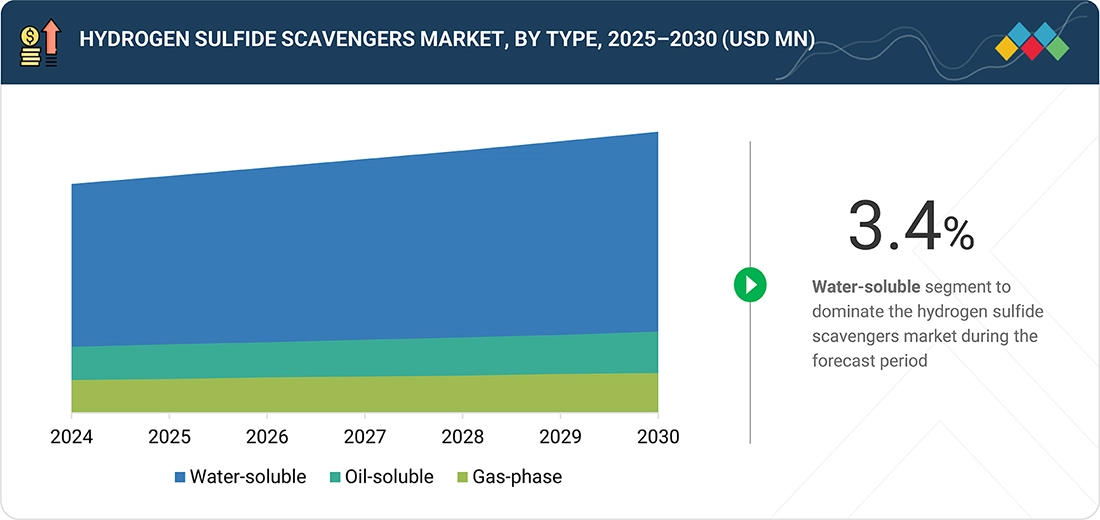
BY TYPEThe hydrogen sulfide scavengers market is segmented by type into water-soluble, oil-soluble, and gas-phase scavengers. Water-soluble scavengers hold the largest share of the market as they are widely used in oilfield operations and refining due to their high efficiency and ease of application in aqueous systems. However, oil-soluble scavengers are emerging as the fastest-growing segment, driven by their increasing adoption in crude oil and hydrocarbon treatment processes, where they offer greater compatibility and effectiveness in non-aqueous environments.
-
BY CHEMISTRYThe hydrogen sulfide scavengers market by chemistry is segmented into Triazine, Nitrite, Iron Sponge, and other chemistries. Among these, Triazine dominates the market as the largest segment due to its high reactivity, cost-effectiveness, and suitability for both upstream and midstream applications. It is also the fastest-growing segment, supported by its broad acceptance in oil and gas operations and continuous improvements in formulation technologies that enhance efficiency and environmental performance.
-
BY END-USEThe hydrogen sulfide scavengers market is segmented by end-use into crude oil, natural gas, geothermal energy, industrial processes, and other end-uses. Crude oil represents both the largest and fastest-growing segment, as the rising global demand for oil production and refining has intensified the need for effective H2S management to prevent corrosion, ensure worker safety, and comply with strict environmental regulations.
-
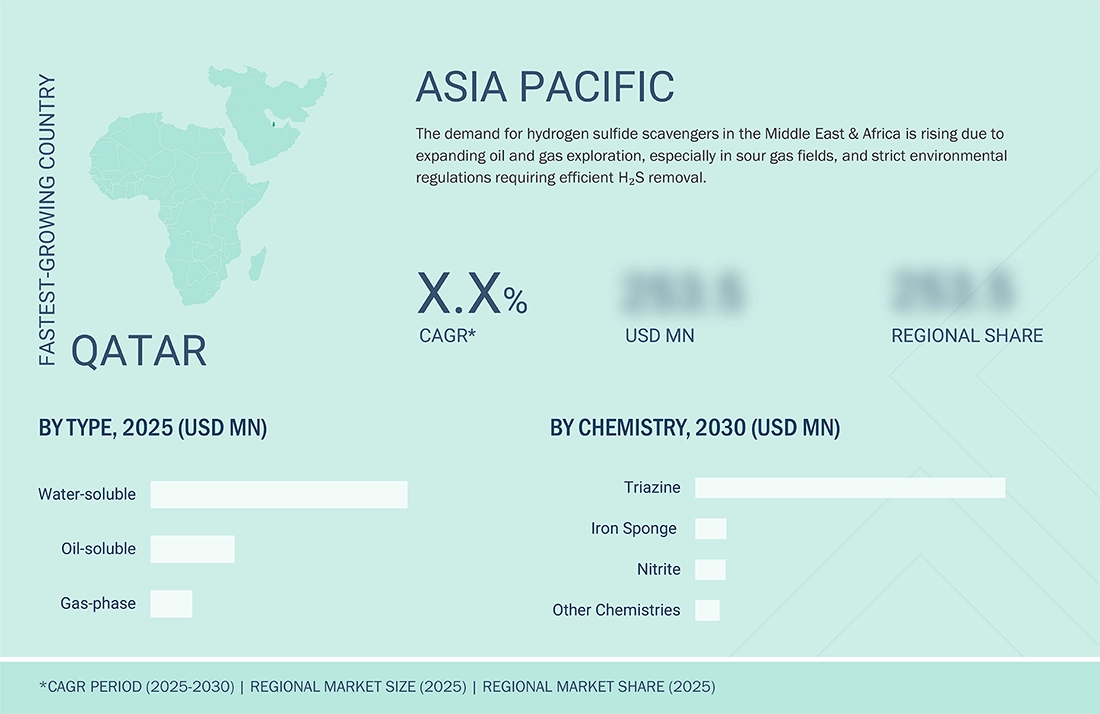
BY REGIONThe hydrogen sulfide scavengers market is segmented by region into North America, Europe, Asia Pacific, the Middle East & Africa, and South America. The Middle East & Africa hold the largest share of the market, supported by extensive oil and gas production activities and the prevalence of sour crude reserves in the region. Meanwhile, the Asia Pacific is the fastest-growing market, driven by rising energy demand, expanding refining capacities, and increasing investments in upstream oil and gas exploration across countries such as China, India, and Southeast Asia.
-
COMPETITIVE LANDSCAPEThe major market players have adopted both organic and inorganic strategies, including partnerships and investments. SLB (US), Veolia (France), BASF SE (Germany), The Dow Chemical Company (US), Clariant (Switzerland), Baker Hughes Company (US), and Umicore (Belgium) have entered into agreements and partnerships to cater to the growing demand for hydrogen sulfide scavengers across various end-use industries.
The demand for hydrogen sulfide scavengers is projected to increase as rising crude oil and natural gas production continues to generate higher levels of H2S that require effective treatment. Growing concerns over corrosion control, worker safety, and environmental compliance are expected to further accelerate the adoption of these technologies. Moreover, expanding industrial applications and stricter global regulations are anticipated to sustain strong market growth in the coming years.
TRENDS & DISRUPTIONS IMPACTING CUSTOMERS' CUSTOMERS
The impact on consumers’ business emerges from customer trends or disruptions. The hydrogen sulfide scavengers market is being shaped by emerging trends, disruptive technologies, and evolving regulatory pressures. Increasing environmental and safety regulations are driving the adoption of advanced, low-toxicity scavengers, while digital monitoring and automated dosing systems disrupt traditional treatment approaches. These shifts enhance operational efficiency, reduce corrosion and downtime, and lower emissions, directly impacting cost structures and sustainability performance. Energy operators leveraging these innovations can ensure safer, more reliable operations, strengthen infrastructure resilience, and achieve carbon reduction goals, while remaining competitive in increasingly stringent global energy markets.
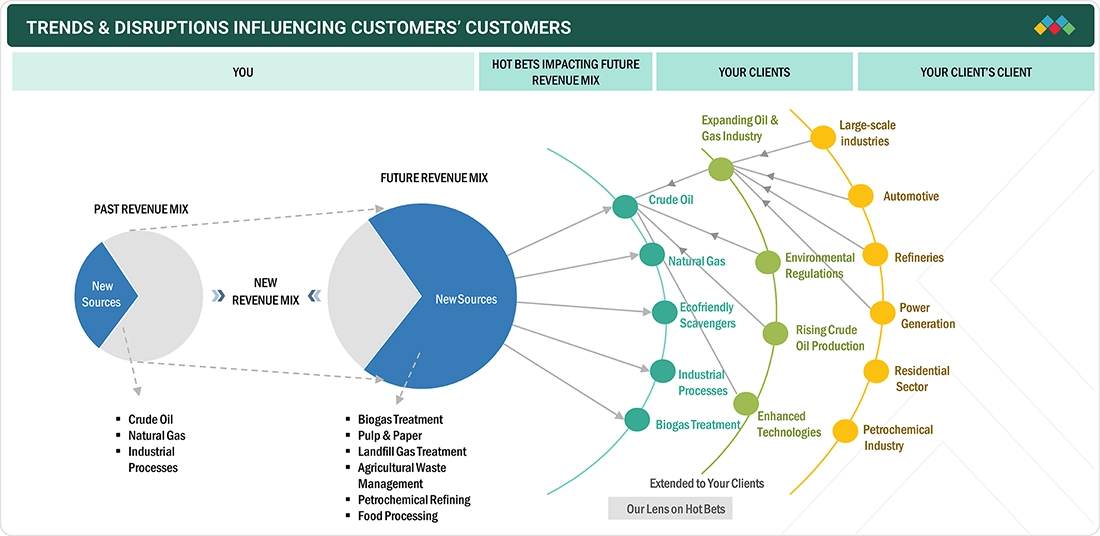
Source: Secondary Research, Interviews with Experts, MarketsandMarkets Analysis
MARKET DYNAMICS
Level
-
Rising Crude Oil Production

-
Expanding Oil & Gas Exploration Activities

Level
-
Scavenger Overdosing Risks

-
Limited Effectiveness in High-water-cut Wells

Level
-
Development of Eco-friendly Scavengers

-
Scavengers for Biogas and Wastewater Treatment

Level
-
Performance Limitations in Extreme Conditions

-
Supply Chain Disruptions

Source: Secondary Research, Interviews with Experts, MarketsandMarkets Analysis
DRIVER: Rising Crude Oil Production
The rising crude oil production, especially of sour oil with high hydrogen sulfide levels, is increasing the demand for advanced scavengers. As output grows, the need to prevent corrosion in pipelines, storage tanks, and processing equipment also increases, ensuring worker safety from toxic emissions. This growth puts additional pressure on the midstream and refining industries to adopt optimized scavenger dosing to improve operational efficiency. Consequently, the need to boost crude throughput directly drives market growth, fostering innovations in high-performance, cost-effective, and environmentally compliant H2S treatment solutions.
RESTRAINT: Scavenger Overdosing Risks
Excessive use of H2S scavengers is a major constraint in the market because applying too much chemical increases operational costs and can cause secondary corrosion or equipment fouling. It complicates processes, requiring precise monitoring and automated dosing systems to maintain efficiency. Additionally, overuse can lead to environmental compliance issues due to higher residual chemical discharge. These risks discourage aggressive adoption by operators, highlighting the importance of customized, data-driven treatment strategies that balance H2S mitigation with cost-effectiveness and regulatory compliance.
OPPORTUNITY: Development of Eco-Friendly Scavengers
The development of eco-friendly hydrogen sulfide scavengers presents a significant market opportunity as operators face increasing regulations and sustainability pressures. Innovative formulations that are less toxic and environmentally harmful can improve safety and help meet high emission standards. These green scavengers support low-carbon energy goals and remain effective in reducing H2S, allowing operators to optimize dosing and reduce operational risks. The growing demand for sustainable solutions across upstream, midstream, and refining sectors makes eco-friendly scavengers a compelling differentiator in the evolving energy market.
CHALLENGE: Performance Limitations in Extreme Conditions
Performance limitations under extreme conditions present a key challenge in the hydrogen sulfide scavengers market. High temperatures, increased pressure, and unpredictable sour gas compositions can reduce scavenger efficiency, leading to incomplete H2S removal and increased corrosion risk. Deepwater, geothermal, and heavy sour crude operators face difficulties in maintaining a constant dosage and may need to use specialized formulations, which raises costs and operational complexity. Addressing these performance gaps is crucial for ensuring reliable, safe, and cost-effective H2S management in demanding energy operations.
Hydrogen Sulfide Scavengers Market: COMMERCIAL USE CASES ACROSS INDUSTRIES
| COMPANY | USE CASE DESCRIPTION | BENEFITS |
|---|---|---|
 |
An offshore production platform in Asia experienced rising hydrogen sulfide levels in the produced fluids, resulting in equipment corrosion, safety risks, and inefficiencies. SLB deployed SELECT S series scavengers specifically formulated for offshore applications to reduce H2S content from >7,000 ppm to <1 ppm. | Remarkable improvement in safety and operational efficiency | Enabled the platform to maintain safe production while minimizing risks associated with elevated H2S levels |
 |
A Gulf of Mexico operator needed to permanently plug and abandon a well that had been abandoned 17 years prior. The original water-based WBM fluid lacked H2S scavengers, creating safety risks. Halliburton recommended BaraScav-1061 and pretreated the well with synthetic-based SBM to maintain scavenger concentration during re-entry. | Eliminated measurable H2S levels during re-entry | Minimized risks to personnel due to non-toxic scavenger nature | Enabled successful well abandonment and has been expanded to other wells with H2S concerns |
 |
A refinery faced H2S levels exceeding 10 ppm during asphalt loading, threatening personnel and regulatory compliance. Baker Hughes assessed operations and proposed optimal SULFIX H2S scavenger dose-response, implementing a new metal-based program for rapid reaction in residual hydrocarbons. | Maintained regulatory compliance and H2S protection | Reduced refinery hazards, saved more than USD 400,000, and allowed safe handling of asphalt without exposing employees to toxic H2S concentrations |
Logos and trademarks shown above are the property of their respective owners. Their use here is for informational and illustrative purposes only.
MARKET ECOSYSTEM
The hydrogen sulfide scavengers market ecosystem features a well-defined value chain encompassing raw material suppliers, manufacturers, distributors, and end-use sectors. The process begins with primary raw materials like amines and metal oxides, which are converted by manufacturers into advanced scavenger compounds, such as triazine, nitrites, and iron sponge. These products are then distributed by authorized channels, ensuring they reach industries where hydrogen sulfide removal is critical. Major applications span crude oil production, natural gas processing, geothermal energy management, and a wide variety of industrial uses. The market’s development is closely tied to the expansion of oil and gas activity, tightening environmental regulations, and the push for safety and operational efficiency in industrial processes. This structured value chain and integration of supply, technology, and demand ensure both effective hydrogen sulfide management and continued market growth
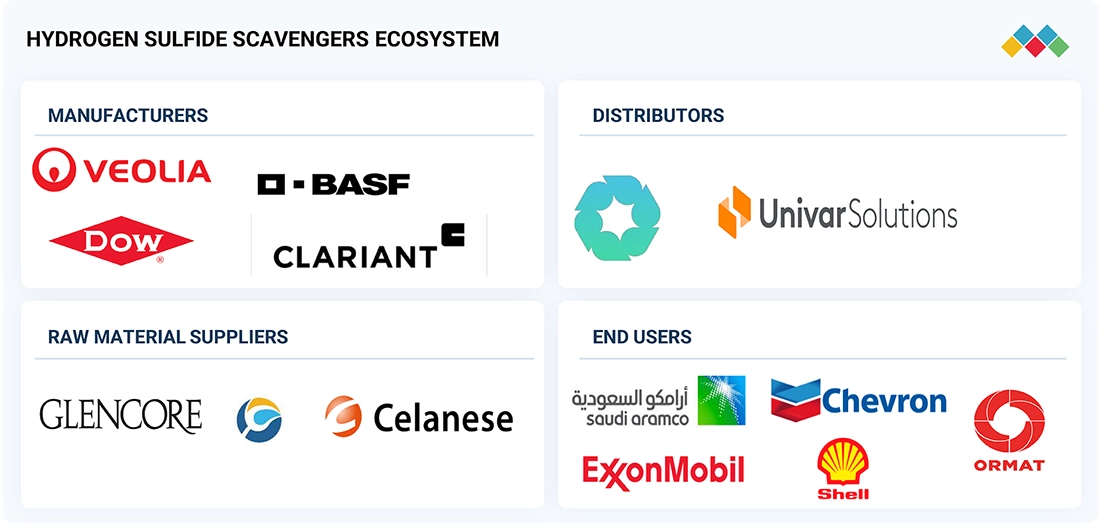
Logos and trademarks shown above are the property of their respective owners. Their use here is for informational and illustrative purposes only.
MARKET SEGMENTS
Source: Secondary Research, Interviews with Experts, MarketsandMarkets Analysis
Hydrogen Sulfide Scavengers Market, By Type
The water-soluble hydrogen sulfide scavengers are expected to maintain the largest market share during the forecasted period because of their high versatility, cost-efficiency, and wide applicability in different water-based industrial operations. These scavengers are water-soluble and provide uniform distribution to achieve maximum H2S neutralization. As such, they are more favored in the oil and gas production industry, drilling fluids, and wastewater treatment. They are compatible with the current infrastructure, comply with stringent environmental laws, and reduce toxic by-products, which additionally contributes to their popularity. As a result, water-soluble types will continue to dominate the hydrogen sulfide scavengers market, propelled by expanding industrial activity and regulatory standards
Hydrogen Sulfide Scavengers Market, By Chemistry
The triazine-based chemistry segment is expected to dominate the market during the forecast period due to its proven efficiency, cost-effectiveness, and quick performance in neutralizing hydrogen sulfide. Triazine scavengers are widely used in oil and gas production, refining, and industrial wastewater treatment because they rapidly convert hydrogen sulfide into stable, non-hazardous compounds, reducing the risk of corrosion and operational hazards. They are also compatible with different operating environments and respond well to stricter environmental regulations. The rise in crude oil production, especially in areas with high levels of sour gas, and effective H2S management further boosts the popularity of triazine-based chemistries in this market.
Hydrogen Sulfide Scavengers Market, By End-use
The crude oil segment is expected to hold the largest market share in the hydrogen sulfide scavengers market during the forecast period. This is mainly due to increasing sour crude oil production, which is rich in hydrogen sulfide (H2S) and requires proper scavenging to prevent corrosion, ensure worker safety, and preserve products. This growth is further driven by the rising global energy demand and increased exploration of oil reserves containing high levels of H2S. Stringent environmental laws and the need for efficient operations in crude oil extraction and processing also contribute to the demand for advanced H2S scavengers. The large volume of these scavengers used in onshore and offshore crude oil exploration and production supports the segment's dominance in the market during the forecast period.
REGION
Asia Pacific experienced strong polyols market growth in 2024, supported by industrialization, infrastructure development, and rising end-use demand
The Middle East & Africa market is projected to maintain its dominance during the forecast period. MEA was the largest market shareholder in 2024, due to its massive production of oil and gas, especially in sour crude and gas fields that are highly concentrated in terms of H2S. Another factor that contributes to this dominance is that it has made tremendous infrastructural investments in the energy sector, and it has some of the largest oil fields in the world. The high volume of oil and gas production in the region demands the deployment of H2S scavengers to reduce corrosion, provide safety to its personnel, and safeguard its products. The necessity of effective and inexpensive products, including triazine-based scavengers, is likely to support the development of the market in MEA.
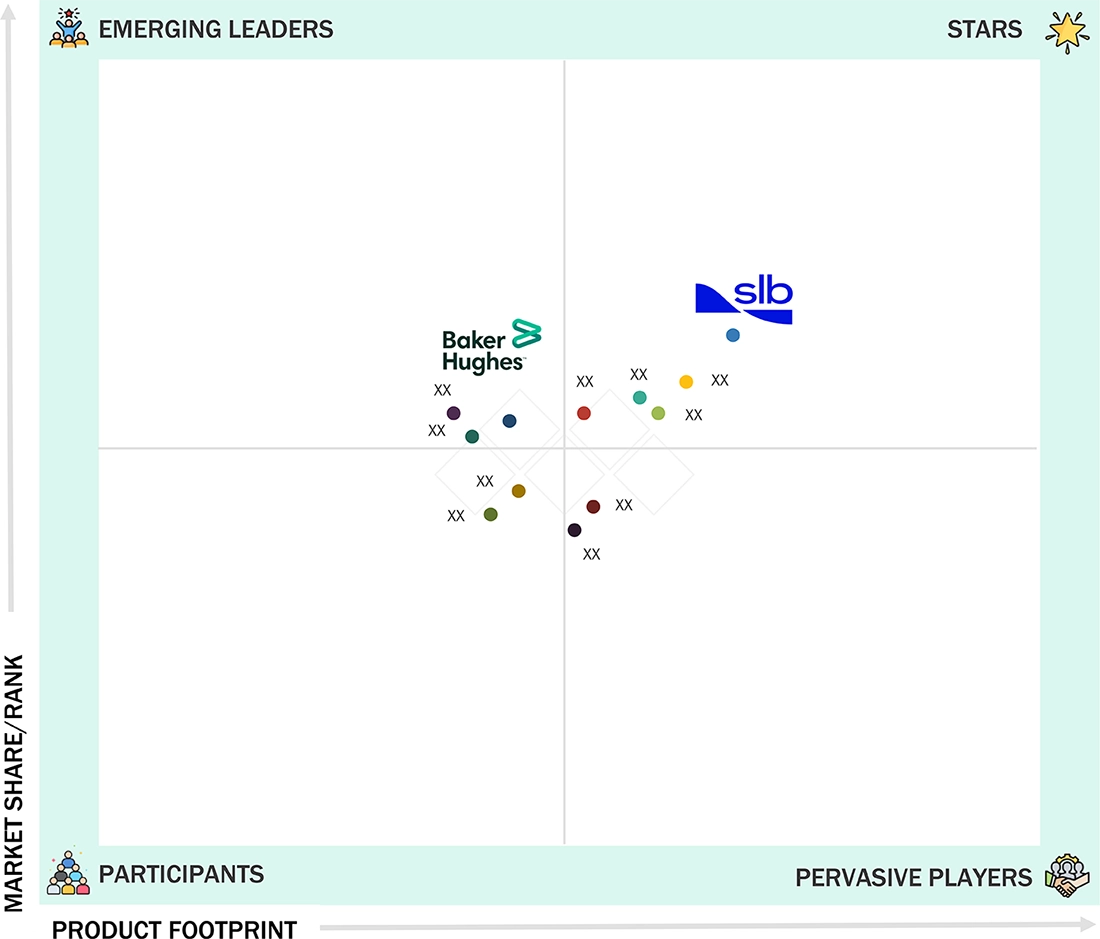
Hydrogen Sulfide Scavengers Market: COMPANY EVALUATION MATRIX
The market matrix indicates SLB (Star) as a formidable player, with extensive production capacities, a diversified portfolio of H2S scavengers, and a robust global distribution network, enabling the company to serve major sectors such as upstream oil and gas, refining, and petrochemical operations. Baker Hughes (Emerging Player) is gaining momentum with innovative scavenger solutions, a focus on specialty and environmentally compliant products, and strategic collaborations to enhance technological efficiency and supply reliability. While SLB maintains its leading position through established manufacturing capabilities, wide geographical presence, and product breadth, Baker Hughes demonstrates significant growth potential and operational differentiation, positioning it for a move into the leaders’ quadrant. Other competitors in the pervasive and participants’ segments are largely focused on niche offerings, such as regional supply or specialized H2S scavengers for specific oil and gas applications, which may influence competitive dynamics and market share distribution in the coming years.
Source: Secondary Research, Interviews with Experts, MarketsandMarkets Analysis
KEY MARKET PLAYERS
MARKET SCOPE
| REPORT METRIC | DETAILS |
|---|---|
| Market Size, 2024 (Value) | USD 387.7 Million |
| Market Forecast, 2030 (Value) | USD 475.0 Million |
| Growth Rate | CAGR of 3.4% from 2025 to 2030 |
| Years Considered | 2023–2030 |
| Base Year | 2024 |
| Forecast Period | 2025–2030 |
| Units Considered | Value (USD Million), Volume (Kilotons) |
| Report Coverage | Revenue forecast, company ranking, competitive landscape, growth factors, and trends |
| Segments Covered |
|
| Regions Covered | North America, Asia Pacific, Europe, South America, and the Middle East & Africa |
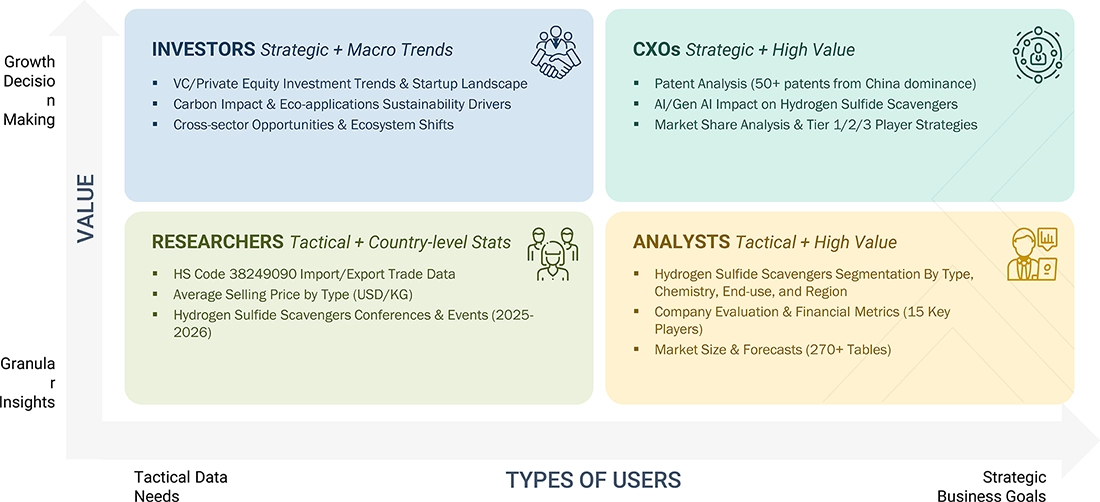
WHAT IS IN IT FOR YOU: Hydrogen Sulfide Scavengers Market REPORT CONTENT GUIDE
DELIVERED CUSTOMIZATIONS
We have successfully delivered the following deep-dive customizations:
| CLIENT REQUEST | CUSTOMIZATION DELIVERED | VALUE ADDS |
|---|---|---|
| Polyurethane Foam Market |
|
|
RECENT DEVELOPMENTS
- February 2025 : SLB provided an update on its planned acquisition of ChampionX, a leading provider of chemistry solutions and highly engineered equipment and technologies for the oil & gas industry. The acquisition aimed to enhance SLB’s production chemistry and artificial lift capabilities, strengthening its position in the energy sector.
- February 2025 : ADNOC and Veolia signed a memorandum of understanding during the UAE-France High-Level Business Council meeting to explore collaboration in water management. The partnership aimed to optimize water resources, reduce consumption, and implement advanced monitoring systems.
- April 2024 : Baker Hughes signed a memorandum of understanding (MoU) with Iraq-based Halfaya Gas Company (HGC) to collaborate on a gas flaring reduction project at the Bin Umar gas processing plant in southeastern Iraq. The agreement aimed to support sustainable energy initiatives by reducing flared gas emissions and enhancing gas utilization efficiency in the region.
- June 2023 : Veolia and its Ivorian partner PFO Africa signed a 15-year operation and maintenance contract for the La Mé drinking water treatment plant in the Ivory Coast. The plant, one of the largest in West Africa, has been designed to meet Abidjan's growing water needs by producing 240,000 m³ of drinking water daily, serving 2.4 million residents.
- October 2022 : Clariant Oil Services expanded its EMEA footprint by launching a state-of-the-art Technical Center in Dubai Science Park, UAE. The center served customers in Europe, the Middle East, and Africa (EMEA), offering rapid technical support focused on corrosion management, fluid separation, and flow assurance.
Table of Contents
 Exclusive indicates content/data unique to MarketsandMarkets and not available with any competitors.
Methodology
The study involved four major activities for estimating the current global size of the hydrogen sulfide scavnegers market. Exhaustive secondary research was conducted to gather information on the market, the peer market, and the parent market. The next step was to validate these findings, assumptions, and sizes with the industry experts across the value chain of hydrogen sulfide scavnegers through primary research. Both the top-down and bottom-up approaches were employed to estimate the overall size of the hydrogen sulfide scavnegers market. After that, market breakdown and data triangulation procedures were used to determine the size of different segments and sub-segments of the market.
Secondary Research
In the secondary research process, various secondary sources such as Business Standard, Bloomberg, World Bank, and Factiva were referred to, to identify and collect information for this study on the hydrogen sulfide scavnegers market. These secondary sources included annual reports, press releases & investor presentations of companies, white papers, certified publications, articles by recognized authors, regulatory bodies, trade directories, and databases.
Primary Research
Various primary sources from both the supply and demand sides of the hydrogen sulfide scavnegers market were interviewed to obtain qualitative and quantitative information. The primary sources from the supply side included industry experts, such as Chief Executive Officers (CEOs), vice presidents, marketing directors, sales professionals, and related key executives from various leading companies and organizations operating in the hydrogen sulfide scavnegers industry. The breakdown of the profiles of primary respondents is as follows:
Breakdown Of Primary Interviews

Notes: Companies are classified based on their revenue–Tier 1 = >USD 7 billion, Tier 2 = USD 500 million to USD 7 billion, and Tier 3 = < USD 500 million.
Others include sales, marketing, and product managers.
To know about the assumptions considered for the study, download the pdf brochure
Market Size Estimation
Both the top-down and bottom-up approaches were used to estimate and validate the global size of the hydrogen sulfide scavnegers market. These approaches were also used extensively to estimate the size of various dependent segments of the market. The research methodology used to estimate the market size included the following details:
- The key players were identified through extensive secondary research.
- The industry’s supply chain and market size, in terms of value, were determined through primary and secondary research processes.
- All percentage shares, splits, and breakdowns were determined using secondary sources and verified through primary sources.
- All possible parameters that affect the markets covered in this research study were accounted for, viewed in extensive detail, verified through primary research, and analyzed to obtain the final quantitative and qualitative data.
- The research includes the study of reports, reviews, and newsletters of key industry players, along with extensive interviews with key officials, such as directors and marketing executives.

Data Triangulation
After arriving at the overall market size from the estimation process explained above, the total market was split into several segments and sub-segments. The data triangulation and market breakdown procedures were employed, wherever applicable, to complete the overall market engineering process and arrive at the exact statistics for all segments and sub-segments of the hydrogen sulfide scavnegers market. The data was triangulated by studying various factors and trends from both the demand- and supply-side.
In addition, the market size was validated by using both the top-down and bottom-up approaches. Then, it was verified through primary interviews. Hence, for every data segment, there are three sources—top-down approach, bottom-up approach, and expert interviews. The data were assumed to be correct when the values arrived at from the three sources matched.
Market Definition
Hydrogen sulfide (H2S) scavengers are chemical compounds used to remove or neutralize H2S gas in industrial processes, particularly in oil and gas production, refining, and wastewater treatment. These scavengers prevent corrosion, protect equipment, and ensure safety by reducing toxic gas exposure. They work through chemical reactions that convert H2S into non-hazardous byproducts, improving operational efficiency and compliance with environmental regulations.
Stakeholders
- Hydrogen Sulfide Scavnegers Manufacturers
- Hydrogen Sulfide Scavnegers service providers
- Raw Material Suppliers
- Research & development entities
- Industry associations and regulatory bodies
- End Users
Report Objectives
- To estimate and forecast the hydrogen sulfide scavnegers market, in terms of value and volume
- To provide detailed information about the major factors (drivers, restraints, opportunities, and challenges) influencing the market growth
- To define, describe, and forecast the market size, based on type, chemistry, end-use, and region
- To forecast the market size along with segments and submarkets, in key regions: North America, Europe, Asia Pacific (APAC), Middle East & Africa (MEA), and South America along with their key countries
- To strategically analyze micro markets, for individual growth trends, prospects, and their contribution to the total market
- To analyze growth opportunities in the market for stakeholders and provide details on the competitive landscape for market leaders
- To strategically profile key players and comprehensively analyze their market shares and core competencies
- To analyze competitive developments, such as merger & acquisition, expansion & investment, and agreements in the hydrogen sulfide scavnegers market
Key Questions Addressed by the Report
Need a Tailored Report?
Customize this report to your needs
Get 10% FREE Customization
Customize This ReportPersonalize This Research
- Triangulate with your Own Data
- Get Data as per your Format and Definition
- Gain a Deeper Dive on a Specific Application, Geography, Customer or Competitor
- Any level of Personalization
Let Us Help You
- What are the Known and Unknown Adjacencies Impacting the Hydrogen Sulfide Scavengers Market
- What will your New Revenue Sources be?
- Who will be your Top Customer; what will make them switch?
- Defend your Market Share or Win Competitors
- Get a Scorecard for Target Partners

Custom Market Research Services
We Will Customise The Research For You, In Case The Report Listed Above Does Not Meet With Your Requirements
Get 10% Free CustomisationTESTIMONIALS

We at Nissan Chemicals Corporation have been clients of MarketsandMarkets for more than a year now. We recently consulted MarketsandMarkets for a study, the team at MarketsandMarkets was extremely professional and organized. The business insights were very detailed and aligned well with our expectations that really helped us formulate the Business Plans and device new strategies for development themes. MarketsandMarkets offers a unique combination of expertise and dedicated engagement model. Their research findings have helped us in designing our Pricing Strategy which will make it easier for us to predict the future sales and profits for the next ten years. We look forward to working with MarketsandMarkets in the future.
VP of Strategy & New Business Development
Leading Specialty Chemical Company
The MarketsandMarkets Engagement Model, composed of both the Knowledge Store and advisory custom research, has greatly helped us in understanding our markets and making strategic decisions. The Knowledge Store is a fast way to allow everyone in our organization to understand more about most any market they are interested in. The ability to then get custom research done and get answers to specific strategic questions and market insight has been spectacular. The Markets and Markets team feel more like colleagues than vendors and their services have helped us change our culture where statements of things like growth opportunities and competitive position are always backed by industry research.

Rich Gibson,
Director, Corporate Strategy
Milliken & Company,
Leading Industrial Manufacturer of specialty chemical, floor covering, performance and protective textile materials, and healthcaremilliken.com
MarketsandMarkets is a trusted resource that helps us to better understand markets that are near-adjacencies-whether its technology, value chain or geography. Their Knowledge Store platform provides a dashboard of markets and their characteristics which is easy to use and saves us time.
Adam Shaw,
Market Development and Strategy Manager
AdvanSix Inc. USA,
An American Leader in Chemicalswww.advansix.com
The Knowledge Store from MarketsandMarkets is a valuable tool which has helped my team acquire greater insight in to the end markets that our business serves. This has enabled us to help our company build stronger strategies throughout our planning process.
TOSHIO KINOSHITA
Senior Chif Consultion Research & Consulting Division
Mitsubishi Chemical Research Corporation,
Leading Manufacturer of Chemical Productswww.mitsubishichem-res.co.jp/en/

We recently engaged with MarketsandMarkets for a study, the team not only clearly understood our business objectives but was also extremely professional in the way they handled the entire project. The study was efficiently conducted in a phase-wise manner, and the engagement model furnished us with high-quality business insights that far exceeded our expectations at each phase. We were especially happy that MarketsandMarkets could provide us with both, an English as well as a Japanese version of the study. A special thanks to the Analyst Team and Client Services Team, whose fluency in Japanese enhanced our comfort level, as we could converse with them in our preferred language.
Independent entrepreneurs
Arrow Precision
We approached MarketsandMarkets for study on Proppants Market, and their work exceeded our expectations. The study conducted was comprehensive and enabled us to view the market through the various dimensions. In addition, the team was extraordinarily responsive throughout the process and resolved our queries on time. I strongly recommend MarketsandMarkets and will certainly consider them for additional market assessments we will need in the future.
Global engineering company, Japan
Deputy Manager,
Strategic Planning OfficeThe high-quality insights shared by the MarketsandMarkets team helped us understand the pharmaceutical plant designers in a specific geography. It also captured the risks that we may likely face in communicating with our potential partners. The study would enable us identify partners, which would impact our future growth.


Growth opportunities and latent adjacency in Hydrogen Sulfide Scavengers Market