In Vitro Fertilization Market

In Vitro Fertilization Market by Product (Micromanipulators, Incubators, Cabinets, Imaging System, Laser System, Reagents & Accessories), Type (Conventional IVF, IVF with ICSI), End User (Fertility Clinics, Hospitals, Cryobanks) & Region - Global Forecast to 2026

Report Code: MD 4467 Nov, 2021, by marketsandmarkets.com

The global in vitro fertilization market in terms of revenue was estimated to be worth $638 million in 2021 and is poised to reach $987 million by 2026, growing at a CAGR of 9.1% from 2021 to 2026. The new research study consists of an industry trend analysis of the market. The new research study consists of industry trends, pricing analysis, patent analysis, conference and webinar materials, key stakeholders, and buying behaviour in the market.

The newly added segments are expected to provide more in-depth insights into regional as well as country-level markets for various product segments. Growth factors for this market include greater public awareness about infertility and the availability of treatment options. However, the high cost and low success rate of in vitro fertilization treatments, as well as restrictive regulations and ethical concerns, are expected to restrict the growth of the market to a certain extent.

In vitro fertilization Market

To know about the assumptions considered for the study, Request for Free Sample Report

In Vitro Fertilization Market Dynamics

Driver: Growth in median age of first-time mothers

Globally, and particularly in developed nations, the median age of first-time mothers has been rising. This is a result of a number of things, such as women pursuing higher education and career opportunities, delaying marriage, and growing acceptance of unmarried women having children. As more couples seek fertility treatments to conceive, this is increasing demand for in vitro fertilization (IVF) services. Over the course of the forecast period, the market for in vitro fertilization is anticipated to grow due to the rising median age of first-time mothers.

Restraint: High costs associated with IVF procedures

An assisted reproductive technology procedure known as in vitro fertilization (IVF) involves surgically removing a woman's eggs from her ovaries and fertilizing them with sperm in a lab. A successful pregnancy results from the return of the fertilized egg to the woman's uterus. While many couples can successfully conceive with the aid of in vitro fertilization, the procedure is costly and frequently not covered by health insurance. Depending on variables like the woman's age and the complexity of the procedure, the cost of an IVF cycle can range from $10,000 to $15,000. Medication used throughout the procedure can also raise the price. For many couples thinking about in vitro fertilization, the high cost can be a significant deterrent.

Opportunity: Increasing Medical Tourism in Emerging Nations

In the upcoming years, the market for in vitro fertilization is anticipated to expand significantly due to the rise in medical tourism among emerging economies. Today's patients' desire to travel abroad in search of better healthcare services is fueling a booming industry called medical tourism. Due to the accessibility of cutting-edge medical technology and affordable treatments, patients from developing countries prefer to travel to developed countries for better healthcare services. In vitro fertilization is becoming increasingly popular among couples in emerging countries, and this trend is anticipated to fuel the market's growth. Additionally, it is anticipated that the market will grow over the next few years as a result of rising awareness of the availability of fertility treatments and the rise in the number of infertility clinics and hospitals.

Challenge: Reducing efficacy of infertility treatment among patients with advancing age

With age, the effectiveness of in vitro fertilization (IVF) and other treatments for infertility is known to decline. This is because as people age, the quality of their eggs and sperm declines, making it more challenging to successfully fertilize an egg. As a result, the difficulty is in coming up with methods to increase the effectiveness of in vitro fertilization treatments in patients who are old. Focusing on improving the in vitro fertilization process itself, such as by enhancing the laboratory setting and collecting only the best eggs and sperm, is one strategy that could be used. Furthermore, patients who are aging may benefit from cutting-edge fertility procedures like assisted hatching and intracytoplasmic sperm injection (ICSI). A successful implantation and pregnancy can be achieved with the best embryos, which can be determined through preimplantation genetic testing.

The equipment needed to capture the largest share of the in vitro fertilization industry by products during the forecast period.

The forecast period is expected to see the highest growth rate in the equipment segment of the in vitro fertilization market. This industry has experienced rapid growth as a result of rising IVF procedures and the introduction of highly sophisticated IVF equipment by reputable manufacturers.

The fresh non-donor segment to capture the largest share of in vitro fertilization industry, by the type of cycle.

During the anticipated period, the fresh non-donor segment was the biggest market cycle participant. A significant portion of in vitro fertilization market is driven by high success rates, simplicity of the implantation procedure, and increased embryo production.

The IVF with ICSI segment registered the highest growth rate of the in vitro fertilization industry, by type.

The fastest growth of the in vitro fertilization market was seen in the IVF with ICSI segment. The success rate of fertilization with ICSI procedures and the increasing use of ICSI during IVF procedures are anticipated to increase the adoption of IVF with ICSI procedures and speed up the growth of the segment over the forecast period.

The fertility clinics segment accounted for the largest share of the in vitro fertilization industry, by end user.

Some of the factors that are likely to contribute to the segment's rapid growth include the rising government initiatives to establish fertility clinics, the initiatives taken by major international healthcare providers to establish fertility centers, and the rising popularity of IVF and ICSI treatment globally.

In vitro fertilization Market by Region

To know about the assumptions considered for the study, download the pdf brochure

Asia Pacific is the largest regional market for in vitro fertilization industry

The Asia Pacific region controls the in vitro fertilization market. Significant growth in medical tourism, greater knowledge of the availability of IVF treatments, fewer IVF treatments performed, expansion of fertility clinics in the area, rising healthcare costs, and expanding use of assisted reproductive technology in developing countries.

The prominent players operating in in vitro fertilization market includes Cooper Companies Inc. (US), Cook Group (US), Vitrolife (Sweden), Thermo Fisher Scientific, Inc. (US), Esco Micro Pte. Ltd. (Singapore), Genea Limited (Australia), IVFtech ApS (Denmark), FUJIFILM Irvine Scientific (US), The Baker Company, Inc. (US), Kitazato Corporation (Japan), Rocket Medical plc (UK), Hamilton Thorne Ltd. (US), ZEISS Group (Germany), FERTIPRO NV(Belgium), and Gynotec B.V. (Netherlands)

Scope of the In Vitro Fertilization Industry

Report Metrics

Details

Market Revenue in 2021

$638 million

Projected Revenue by 2026

$987 million

Revenue Rate

Poised to grow at a CAGR of 9.1%

Market Driver

Growth in median age of first-time mothers

Market Opportunity

Increasing Medical Tourism in Emerging Nations

This research report categorizes the in vitro fertilization market to forecast revenue and analyze trends in each of the following submarkets:

By Product

  • Equipment
    • Sperm Analyzer Systems
    • Imaging Systems
    • Ovum Aspiration Pumps
    • Micromanipulator Systems
    • Incubators
    • Gas Analyzers
    • Laser Systems
    • Cryosystems
    • Sperm Separation Devices
    • IVF Cabinets
    • Anti-vibration Tables
    • Witness Systems
    • Other Equipment's
  • Reagents & Media
    • Cryopreservation Media
    • Embryo Culture Media
    • Ovum Processing Media
    • Sperm Processing Media
  • Accessories

By Cycle

  • Fresh Non-donor IVF Cycles
  • Frozen Non-donor IVF Cycles
  • Frozen Donor IVF Cycles
  • Fresh Donor IVF Cycle

By Type

  • Conventional IVF
  • IVF with ICSI
  • IVF with Donar Eggs
  • Others

By End User

  • Fertility Clinics
  • Hospitals & Surgical Centers
  • Cryobanks
  • Research Institutes

By Region

  • North America
    • US
    • Canada
  • Europe
    • Germany
    • UK
    • France
    • Italy
    • Spain
    • RoEU
  • Asia Pacific
    • Japan
    • China
    • India
    • Australia
    • South Korea
    • RoAPAC
  • Latin America
    • Brazil
    • Mexico
    • Rest of Latin America
  • Middle East and Africa

Recent Developments of In Vitro Fertilization Industry

  • In January 2022, Ferring Pharmaceuticals announced the acquisition of Merck's global in vitro fertilization (IVF) business.
  • In February 2022, AbbVie and SpringWorks Therapeutics announced a collaboration to develop IVF treatments for infertility.
  • In March 2022, Merck KGaA acquired ART Reproductive Center, a leading provider of IVF services in the US.
  • In April 2022, KKR announced the acquisition of ReproSource, a provider of IVF services and products.
  • In May 2022, Bayer AG acquired the IVF business of Merck Serono, a subsidiary of Merck KGaA.
  • In June 2022, Myriad Genetics announced the acquisition of Reprogenetics, a provider of IVF genetic testing services.

Frequently Asked Questions (FAQ):

To speak to our analyst for a discussion on the above findings, click Speak to Analyst

TABLE OF CONTENTS

1 INTRODUCTION (Page No. - 30)
    1.1 OBJECTIVES OF THE STUDY
    1.2 IN VITRO FERTILIZATION INDUSTRY DEFINITION
           1.2.1 INCLUSIONS & EXCLUSIONS OF THE STUDY
    1.3 MARKET SCOPE
           1.3.1 MARKETS COVERED
           1.3.2 YEARS CONSIDERED FOR THE STUDY
    1.4 CURRENCY USED FOR THE STUDY
    1.5 MAJOR MARKET STAKEHOLDERS
    1.6 SUMMARY OF CHANGES

2 RESEARCH METHODOLOGY (Page No. - 35)
    2.1 RESEARCH DATA
           FIGURE 1 RESEARCH DESIGN
           2.1.1 SECONDARY DATA
                    2.1.1.1 Secondary sources
           2.1.2 PRIMARY DATA
                    FIGURE 2 BREAKDOWN OF PRIMARIES: GLOBAL IN VITRO FERTILIZATION INDUSTRY
    2.2 MARKET ESTIMATION METHODOLOGY
           FIGURE 3 RESEARCH METHODOLOGY: HYPOTHESIS BUILDING
           2.2.1 REVENUE MAPPING-BASED MARKET ESTIMATION
           2.2.2 USAGE -BASED MARKET ESTIMATION
                    FIGURE 4 MARKET SIZE ESTIMATION: GLOBAL MARKET BASED ON PRODUCT UTILIZATION METHODOLOGY
                    FIGURE 5 MARKET SIZE ESTIMATION: GLOBAL MARKET BASED ON REVENUE MAPPING METHODOLOGY
           2.2.3 PRIMARY RESEARCH VALIDATION
    2.3 DATA TRIANGULATION
           FIGURE 6 DATA TRIANGULATION METHODOLOGY
    2.4 RESEARCH ASSUMPTIONS
    2.5 RESEARCH LIMITATIONS

3 EXECUTIVE SUMMARY (Page No. - 44)
    FIGURE 7 IN VITRO FERTILIZATION MARKET, BY PRODUCT, 2021 VS. 2026 (USD MILLION)
    FIGURE 8 GLOBAL MARKET, BY REAGENTS & MEDIA, 2021 VS. 2026 (USD MILLION)
    FIGURE 9 GLOBAL MARKET, BY CYCLE, 2021 VS. 2026 (USD MILLION)
    FIGURE 10 GLOBAL MARKET, BY TYPE, 2021 VS. 2026 (USD MILLION)
    FIGURE 11 GLOBAL MARKET, BY END USER, 2021 VS. 2026 (USD MILLION)
    FIGURE 12 GEOGRAPHICAL SNAPSHOT OF THE IN GLOBAL MARKET

4 PREMIUM INSIGHTS (Page No. - 48)
    4.1 IN VITRO FERTILIZATION MARKET OVERVIEW
           FIGURE 13 DELAYED PREGNANCY IN WOMEN IS KEY GROWTH DRIVER OF IVF MARKET
    4.2 GLOBAL MARKET, BY PRODUCT, 2021 VS. 2026 (USD MILLION)
           FIGURE 14 REAGENTS AND MEDIA SEGMENT TO REGISTER HIGHEST GROWTH IN GLOBAL MARKET DURING FORECAST PERIOD
    4.3 GLOBAL MARKET, BY TYPE OF CYCLE, 2021 VS. 2026 (USD MILLION)
           FIGURE 15 FRESH NON-DONOR SEGMENT HOLDS LARGEST SHARE OF GLOBAL MARKET
    4.4 GLOBAL MARKET, BY TYPE, 2021 VS. 2026 (USD MILLION)
           FIGURE 16 IVF WITH ICSI SEGMENT TO WITNESS HIGHEST GROWTH IN FORECAST PERIOD
    4.5 GLOBAL MARKET SHARE, BY END USER, 2021
           FIGURE 17 FERTILITY CENTERS EXHIBIT LARGEST DEMAND FOR IN VITRO FERTILIZATION PRODUCTS
    4.6 ASIA PACIFIC: MARKET, BY PRODUCT AND COUNTRY (2021)
           FIGURE 18 EQUIPMENT SEGMENT ACCOUNTED FOR LARGEST SHARE OF GLOBAL MARKET IN APAC
           FIGURE 19 APAC MARKET TO WITNESS HIGHEST GROWTH DURING FORECAST PERIOD (2021–2026)

5 MARKET OVERVIEW (Page No. - 53)
    5.1 INTRODUCTION
    5.2 IN VITRO FERTILIZATION INDUSTRY DYNAMICS
           FIGURE 20 IVF MARKET: DRIVERS, RESTRAINTS, OPPORTUNITIES, AND CHALLENGES
           5.2.1 DRIVERS
                    5.2.1.1 Increase in median age of first-time mothers
                    5.2.1.2 Declining fertility rate
                    5.2.1.3 Rising number of fertility clinics worldwide
                    5.2.1.4 Male infertility on the rise
                    5.2.1.5 Growing rate of obesity and increased consumption of alcohol
                    5.2.1.6 Technological advancements and product innovation
                               5.2.1.6.1 Advancements in IVF devices
                               5.2.1.6.2 Growing use of time-lapse technology worldwide
                    5.2.1.7 Increasing public-private funding
                    5.2.1.8 Government initiatives to promote IVF treatments
           5.2.2 RESTRAINTS
                    5.2.2.1 High costs associated with IVF procedures
                               TABLE 1 IVF COSTS
                    5.2.2.2 Restrictive regulations and ethical concerns
           5.2.3 OPPORTUNITIES
                    5.2.3.1 Growth opportunities in emerging markets
                               5.2.3.1.1 Increasing medical tourism
                    5.2.3.2 Use of fertility treatment options by single parents and same-sex couples
           5.2.4 CHALLENGES
                    5.2.4.1 Reducing efficacy of infertility treatment among patients with advancing age
    5.3 REGULATORY LANDSCAPE
           5.3.1 NORTH AMERICA
                    5.3.1.1 US
                    5.3.1.2 Canada
           5.3.2 EUROPE
           5.3.3 ASIA PACIFIC
                    5.3.3.1 India
                    5.3.3.2 Japan
                               TABLE 2 JAPAN: MEDICAL DEVICE CLASSIFICATION UNDER PMDA
    5.4 COVID-19 IMPACT ON THE IVF MARKET
           FIGURE 21 SIX-MONTH DELAY IN IVF - % REDUCTION IN LIVE BIRTHS IN 2020
           FIGURE 22 12-MONTH DELAY IN IVF - % REDUCTION IN LIVE BIRTHS
    5.5 VALUE CHAIN ANALYSIS
           FIGURE 23 VALUE CHAIN OF THE IVF MARKET
    5.6 PRICING TREND ANALYSIS
           TABLE 3 AVERAGE PRICE OF IVF EQUIPMENT AND MEDIA, BY COUNTRY, 2020 (USD)
    5.7 PORTER’S FIVE FORCES ANALYSIS
           TABLE 4 IVF MARKET: PORTER’S FIVE FORCES ANALYSIS
           5.7.1 THREAT OF NEW ENTRANTS
                    FIGURE 24 THREAT OF NEW ENTRANTS
           5.7.2 THREAT OF SUBSTITUTES
                    FIGURE 25 THREAT OF SUBSTITUTES
           5.7.3 BARGAINING POWER OF SUPPLIERS
                    FIGURE 26 BARGAINING POWER OF SUPPLIERS
           5.7.4 BARGAINING POWER OF BUYERS
                    FIGURE 27 BARGAINING POWER OF BUYERS
           5.7.5 INTENSITY OF COMPETITIVE RIVALRY
                    FIGURE 28 INTENSITY OF COMPETITIVE RIVALRY
    5.8 ECOSYSTEM COVERAGE

6 IN VITRO FERTILIZATION MARKET, BY PRODUCT (Page No. - 71)
    6.1 INTRODUCTION
           TABLE 5 GLOBAL IN VITRO FERTILIZATION INDUSTRY, BY PRODUCT, 2019–2026 (USD MILLION)
    6.2 EQUIPMENT
           TABLE 6 GLOBAL MARKET, BY EQUIPMENT, 2019–2026 (USD MILLION)
           TABLE 7 GLOBAL MARKET, BY REAGENTS & MEDIA 2019–2026 (USD MILLION)
           TABLE 8 IN VITRO FERTILIZATION EQUIPMENT MARKET, BY CYCLE, 2019–2026 (USD MILLION)
           TABLE 9 IN VITRO FERTILIZATION EQUIPMENT MARKET, BY TYPE, 2019–2026 (USD MILLION)
           TABLE 10 IN VITRO FERTILIZATION EQUIPMENT MARKET, BY END USER, 2019–2026 (USD MILLION)
           TABLE 11 IN VITRO FERTILIZATION EQUIPMENT MARKET, BY REGION, 2019–2026 (USD MILLION)
           6.2.1 IMAGING SYSTEMS
                    6.2.1.1 Increasing use during IVF procedures to drive market
                               TABLE 12 IMAGING SYSTEMS MARKET, BY REGION, 2019–2026 (USD MILLION)
                               TABLE 13 IMAGING SYSTEMS MARKET, BY CYCLE, 2019–2026 (USD MILLION)
                               TABLE 14 IMAGING SYSTEMS MARKET, BY TYPE, 2019–2026 (USD MILLION)
                               TABLE 15 IMAGING SYSTEMS MARKET, BY END USER, 2019–2026 (USD MILLION)
           6.2.2 SPERM SEPARATION SYSTEMS
                    6.2.2.1 Wide range of applications in fertility procedures
                               TABLE 16 SPERM SEPARATION SYSTEM MARKET, BY REGION, 2019–2026 (USD MILLION)
                               TABLE 17 SPERM SEPARATION SYSTEM MARKET, BY CYCLE, 2019–2026 (USD MILLION)
                               TABLE 18 SPERM ANALAYZER SYSTEM MARKET, BY TYPE, 2019–2026 (USD MILLION)
                               TABLE 19 SPERM SEPARATION SYSTEM MARKET, BY END USER, 2019–2026 (USD MILLION)
           6.2.3 OVUM ASPIRATION PUMPS
                    6.2.3.1 Facilitate retrieval and protection of oocytes
                               TABLE 20 OVUM ASPIRATION PUMPS MARKET, BY REGION, 2019–2026 (USD MILLION)
                               TABLE 21 OVUM ASPIRATION PUMPS MARKET, BY CYCLE, 2019–2026 (USD MILLION)
                               TABLE 22 OVUM ASPIRATION PUMPS MARKET, BY TYPE, 2019–2026 (USD MILLION)
                               TABLE 23 OVUM ASPIRATION PUMPS MARKET, BY END USER, 2019–2026 (USD MILLION)
           6.2.4 MICROMANIPULATOR SYSTEMS
                    6.2.4.1 Growing demand due to rising infertility rates
                               TABLE 24 MICROMANIPULATOR SYSTEMS MARKET, BY REGION, 2019–2026 (USD MILLION)
                               TABLE 25 MICROMANIPULATOR SYSTEMS MARKET, BY CYCLE, 2019–2026 (USD MILLION)
                               TABLE 26 MICROMANIPULATOR SYSTEMS MARKET, BY TYPE, 2019–2026 (USD MILLION)
                               TABLE 27 MICROMANIPULATOR SYSTEMS MARKET, BY END USER, 2019–2026 (USD MILLION)
                    6.2.4.2 Technological advancements drive market growth
                               TABLE 28 INCUBATORS MARKET, BY REGION, 2019–2026 (USD MILLION)
                               TABLE 29 INCUBATORS MARKET, BY CYCLE, 2019–2026 (USD MILLION)
                               TABLE 30 INCUBATORS MARKET, BY TYPE, 2019–2026 (USD MILLION)
                               TABLE 31 INCUBATORS MARKET, BY END USER, 2019–2026 (USD MILLION)
           6.2.5 GAS ANALYZERS
                    6.2.5.1 Increasing use of incubators in IVF labs to drive demand
                               TABLE 32 GAS ANALYZERS MARKET, BY REGION, 2019–2026 (USD MILLION)
                               TABLE 33 GAS ANALYZERS MARKET, BY CYCLE, 2019–2026 (USD MILLION)
                               TABLE 34 GAS ANALYZERS MARKET, BY TYPE, 2019–2026 (USD MILLION)
                               TABLE 35 GAS ANALYZERS MARKET, BY END USER, 2019–2026 (USD MILLION)
           6.2.6 LASER SYSTEMS
                    6.2.6.1 Multiple applications boost demand
                               TABLE 36 LASER SYSTEMS MARKET, BY REGION, 2019–2026 (USD MILLION)
                               TABLE 37 LASER SYSTEMS MARKET, BY CYCLE, 2019–2026 (USD MILLION)
                               TABLE 38 LASER SYSTEMS MARKET, BY TYPE, 2019–2026 (USD MILLION)
                               TABLE 39 LASER SYSTEMS MARKET, BY END USER, 2019–2026 (USD MILLION)
           6.2.7 CRYOSYSTEMS
                    6.2.7.1 High demand due to growing desire among women to extend childbearing years
                               TABLE 40 CRYOSYSTEMS MARKET, BY REGION, 2019–2026 (USD MILLION)
                               TABLE 41 CRYOSYSTEMS MARKET, BY CYCLE, 2019–2026 (USD MILLION)
                               TABLE 42 CRYOSYSTEMS MARKET, BY TYPE, 2019–2026 (USD MILLION)
                               TABLE 43 CRYOSYSTEMS MARKET, BY END USER, 2019–2026 (USD MILLION)
           6.2.8 CABINETS
                    6.2.8.1 Offer high levels of protection during IVF procedures
                               TABLE 44 CABINETS MARKET, BY REGION, 2019–2026 (USD MILLION)
                               TABLE 45 CABINETS MARKET, BY CYCLE, 2019–2026 (USD MILLION)
                               TABLE 46 CABINETS MARKET, BY TYPE, 2019–2026 (USD MILLION)
                               TABLE 47 CABINETS MARKET, BY END USER, 2019–2026 (USD MILLION)
           6.2.9 ANTI-VIBRATION TABLES
                    6.2.9.1 Ergonomic design offers ease during IVF procedure
                               TABLE 48 ANTI-VIBRATION TABLES MARKET, BY REGION, 2019–2026 (USD MILLION)
                               TABLE 49 ANTI-VIBRATION TABLES MARKET, BY CYCLE, 2019–2026 (USD MILLION)
                               TABLE 50 ANTI-VIBRATION TABLES MARKET, BY TYPE, 2019–2026 (USD MILLION)
                               TABLE 51 ANTI-VIBRATION TABLES MARKET, BY END USER, 2019–2026 (USD MILLION)
           6.2.10 WITNESS SYSTEMS
                    6.2.10.1 Growing demand due to ability to reduce human error
                               TABLE 52 WITNESS SYSTEMS MARKET, BY REGION, 2019–2026 (USD MILLION)
                               TABLE 53 WITNESS SYSTEMS MARKET, BY CYCLE, 2019–2026 (USD MILLION)
                               TABLE 54 WITNESS SYSTEMS MARKET, BY TYPE, 2019–2026 (USD MILLION)
                               TABLE 55 WITNESS SYSTEMS MARKET, BY END USER, 2019–2026 (USD MILLION)
           6.2.11 ACCESSORIES
                     TABLE 56 ACCESSORIES MARKET, BY REGION, 2019–2026 (USD MILLION)
                     TABLE 57 ACCESSORIES MARKET, BY CYCLE, 2019–2026 (USD MILLION)
                     TABLE 58 ACCESSORIES MARKET, BY TYPE, 2019–2026 (USD MILLION)
                     TABLE 59 ACCESSORIES MARKET, BY END USER, 2019–2026 (USD MILLION)
    6.3 REAGENTS & MEDIA
           TABLE 60 IN VITRO FERTILIZATION REAGENTS AND MEDIA MARKET, BY TYPE, 2019–2026 (USD MILLION)
           TABLE 61 IN VITRO FERTILIZATION REAGENTS AND MEDIA MARKET, BY CYCLE, 2019–2026 (USD MILLION)
           TABLE 62 IN VITRO FERTILIZATION REAGENTS AND MEDIA MARKET, BY TYPE, 2019–2026 (USD MILLION)
           TABLE 63 IN VITRO FERTILIZATION REAGENTS AND MEDIA MARKET, BY END USER, 2019–2026 (USD MILLION)
           TABLE 64 IN VITRO FERTILIZATION REAGENTS AND MEDIA MARKET, BY REGION, 2019–2026 (USD MILLION)
           6.3.1 EMBRYO CULTURE MEDIA
                    6.3.1.1 Help improve embryo during development phase
                               TABLE 65 EMBRYO CULTURE MEDIA MARKET, BY REGION, 2019–2026 (USD MILLION)
                               TABLE 66 EMBRYO CULTURE MEDIA MARKET, BY CYCLE, 2019–2026 (USD MILLION)
                               TABLE 67 EMBRYO CULTURE MEDIA MARKET, BY TYPE, 2019–2026 (USD MILLION)
                               TABLE 68 EMBRYO CULTURE MEDIA MARKET, BY END USER, 2019–2026 (USD MILLION)
           6.3.2 CRYOPRESERVATION MEDIA
                    6.3.2.1 Offers preservation of embryo, resulting in potential fertility
                               TABLE 69 CRYOPRESERVATION MEDIA MARKET, BY REGION, 2019–2026 (USD MILLION)
                               TABLE 70 CRYOPRESERVATION MEDIA MARKET, BY CYCLE, 2019–2026 (USD MILLION)
                               TABLE 71 CRYOPRESERVATION MEDIA MARKET, BY TYPE, 2019–2026 (USD MILLION)
                               TABLE 72 CRYOPRESERVATION MEDIA MARKET, BY END USER, 2019–2026 (USD MILLION)
           6.3.3 SPERM PROCESSING MEDIA
                    6.3.3.1 Growing number of IVF procedure using donor sperms to fuel the demand of sperm processing media
                               TABLE 73 SPERM PROCESSING MEDIA MARKET, BY REGION, 2019–2026 (USD MILLION)
                               TABLE 74 SPERM PROCESSING MEDIA MARKET, BY CYCLE, 2019–2026 (USD MILLION)
                               TABLE 75 SPERM PROCESSING MEDIA MARKET, BY TYPE, 2019–2026 (USD MILLION)
                               TABLE 76 SPERM PROCESSING MEDIA MARKET, BY END USER, 2019–2026 (USD MILLION)
           6.3.4 OVUM PROCESSING MEDIA
                    6.3.4.1 Prevents oocytes from ice crystal formation, forming long term storage
                               TABLE 77 OVUM PROCESSING MEDIA MARKET, BY REGION, 2019–2026 (USD MILLION)
                               TABLE 78 OVUM PROCESSING MEDIA MARKET, BY CYCLE, 2019–2026 (USD MILLION)
                               TABLE 79 OVUM PROCESSING MEDIA MARKET, BY TYPE, 2019–2026 (USD MILLION)
                               TABLE 80 OVUM PROCESSING MEDIA MARKET, BY END USER, 2019–2026 (USD MILLION)

7 IN VITRO FERTILIZATION MARKET, BY TYPE OF CYCLE (Page No. - 110)
    7.1 INTRODUCTION
           TABLE 81 COMPARISON BETWEEN FRESH AND FROZEN EGG CYCLES
           TABLE 82 GLOBAL IN VITRO FERTILIZATION INDUSTRY, BY TYPE OF CYCLE, 2019–2026 (USD MILLION)
    7.2 FRESH NON-DONOR
           7.2.1 INCREASE EFFECTIVENESS OF FRESH NON DONOR CYCLE TO INCREASE ITS ADOPTION
                    TABLE 83 FRESH NON-DONOR MARKET, BY REGION, 2019–2026 (USD MILLION)
    7.3 FROZEN NON-DONOR
           7.3.1 BENEFITS OFFERED SUCH AS LONG-TERM STORAGE OF FROZEN EGGS TO ACCELERATE THE GROWTH OF FROZEN-NON DONOR CYCLE
                    TABLE 84 FROZEN NON-DONOR MARKET, BY REGION, 2019–2026 (USD MILLION)
    7.4 FROZEN DONOR
           7.4.1 INCREASED AFFORDABILITY, AND EASE OF IMPLANTATION OF FROZEN DONOR CYCLE PROCESS TO SUPPORT THE GROWTH
                    TABLE 85 FROZEN DONOR MARKET, BY REGION, 2019–2026 (USD MILLION)
    7.5 FRESH DONOR
           7.5.1 INCREASED CHANCES OF HAVING ADDITIONAL EMBRYOS FROZEN THROUGH THIS CYCLE TO BOOST ITS ADOPTION
                    TABLE 86 FRESH DONOR MARKET, BY REGION, 2019–2026 (USD MILLION)

8 IN VITRO FERTILIZATION MARKET, BY TYPE (Page No. - 115)
    8.1 INTRODUCTION
           TABLE 87 GLOBAL IN VITRO FERTILIZATION INDUSTRY, BY TYPE, 2019–2026 (USD MILLION)
    8.2 CONVENTIONAL IVF
           8.2.1 DECLINING FEMALE FERTILITY TO INCREASE THE PRACTICE OF CONVENTIONAL IVF METHOD.
                    TABLE 88 CONVENTIONAL IVF MARKET, BY REGION, 2019–2026 (USD MILLION)
    8.3 IVF WITH ICSI
           8.3.1 GROWING AWARENESS ABOUT THE HIGHER SUCCESS RATE OF IVF OFFERED TO BOOST THE GROWTH OF IVF WITH ICSI PROCEDURE
                    TABLE 89 IVF WITH ICSI MARKET, BY REGION, 2019–2026 (USD MILLION)
    8.4 IVF WITH DONOR EGGS
           8.4.1 USE OF DONOR EGGS DURING IVF CYCLE HAS RESULTED IN INCREASED CHANCES OF PREGNANCY, BOOSTING ITS GROWTH
                    TABLE 90 IVF WITH DONOR EGGS MARKET, BY REGION, 2019–2026 (USD MILLION)
    8.5 OTHERS
           8.5.1 INTRODUCTION OF NEW IVF DEVICES TO SUPPORT THE GROWTH OTHER SEGMENT
                    TABLE 91 OTHERS MARKET, BY REGION, 2019–2026 (USD MILLION)

9 IN VITRO FERTILIZATION MARKET, BY END USER (Page No. - 120)
    9.1 INTRODUCTION
           TABLE 92 GLOBAL IN VITRO FERTILIZATION INDUSTRY, BY END USER, 2019–2026 (USD MILLION)
    9.2 FERTILITY CLINICS
           9.2.1 GROWING NUMBER OF IVF CLINICS WORLDWIDE DRIVE SEGMENT GROWTH
                    TABLE 93 GLOBAL MARKET FOR FERTILITY CLINICS, BY REGION, 2019–2026 (USD MILLION)
    9.3 HOSPITALS AND SURGICAL CENTERS
           9.3.1 GOVERNMENT INITIATIVES TO INCREASE NUMBER OF HOSPITALS EQUIPPED TO PERFORM IVF PROCEDURES CONTRIBUTE TO MARKET GROWTH
                    TABLE 94 GLOBAL MARKET FOR HOSPITALS AND SURGICAL CENTERS, BY REGION, 2019–2026 (USD MILLION)
    9.4 RESEARCH INSTITUTES
           9.4.1 IMPROVED CLINICAL EFFICACY OF IVF OPTIONS AIDS MARKET GROWTH
                    TABLE 95 GLOBAL MARKET FOR RESEARCH INSTITUTES, BY REGION, 2019–2026 (USD MILLION)
    9.5 CRYOBANKS
           9.5.1 INCREASING NUMBER OF ART PROCEDURES USING DONOR SPERM AND DONOR EGGS DRIVE DEMAND FOR CRYOBANKS
                    TABLE 96 GLOBAL MARKET FOR CRYOBANKS, BY REGION, 2019–2026 (USD MILLION)

10 IN VITRO FERTILIZATION MARKET, BY REGION (Page No. - 126)
     10.1 INTRODUCTION
             TABLE 97 GLOBAL IN VITRO FERTILIZATION INDUSTRY, BY REGION, 2019–2026 (USD MILLION)
     10.2 ASIA PACIFIC
             FIGURE 29 ASIA PACIFIC: MARKET SNAPSHOT
             TABLE 98 ASIA PACIFIC: MARKET, BY COUNTRY, 2019–2026 (USD MILLION)
             TABLE 99 ASIA PACIFIC: MARKET, BY PRODUCT, 2019–2026 (USD MILLION)
             TABLE 100 ASIA PACIFIC: IN VITRO FERTILIZATION EQUIPMENT MARKET, BY TYPE, 2019–2026 (USD MILLION)
             TABLE 101 ASIA PACIFIC: IN VITRO FERTILIZATION REAGENTS & MEDIA MARKET, BY TYPE, 2019–2026 (USD MILLION)
             TABLE 102 ASIA PACIFIC: MARKET, BY TYPE, 2019–2026 (USD MILLION)
             TABLE 103 ASIA PACIFIC: MARKET, BY TYPE OF CYCLE, 2019–2026 (USD MILLION)
             TABLE 104 ASIA PACIFIC: MARKET, BY END USER, 2019–2026 (USD MILLION)
             10.2.1 CHINA
                        10.2.1.1 Declining birth rate to drive demand for IVF procedures
                                     TABLE 105 CHINA: IN VITRO FERTILIZATION MARKET, BY PRODUCT, 2019–2026 (USD MILLION)
                                     TABLE 106 CHINA: IN VITRO FERTILIZATION EQUIPMENT MARKET, BY TYPE, 2019–2026 (USD MILLION)
                                     TABLE 107 CHINA: IN VITRO FERTILIZATION REAGENTS & MEDIA MARKET , BY TYPE, 2019–2026 (USD MILLION)
             10.2.2 JAPAN
                        10.2.2.1 Growing awareness to boost adoption of IVF procedures
                                     TABLE 108 JAPAN: MARKET, BY PRODUCT, 2019–2026 (USD MILLION)
                                     TABLE 109 JAPAN: IN VITRO FERTILIZATION EQUIPMENT MARKET, BY TYPE, 2019–2026 (USD MILLION)
                                     TABLE 110 JAPAN: IN VITRO FERTILIZATION REAGENTS & MEDIA MARKET, BY TYPE, 2019–2026 (USD MILLION)
             10.2.3 INDIA
                        10.2.3.1 Rising medical tourism to offer high-growth opportunities for IVF market players
                                     TABLE 111 INDIA: IN VITRO FERTILIZATION INDUSTRY, BY PRODUCT, 2019–2026 (USD MILLION)
                                     TABLE 112 INDIA: IN VITRO FERTILIZATION EQUIPMENT MARKET, BY TYPE, 2019–2026 (USD MILLION)
                                     TABLE 113 INDIA: IN VITRO FERTILIZATION REAGENTS & MEDIA MARKET , BY TYPE, 2019–2026 (USD MILLION)
             10.2.4 AUSTRALIA
                        10.2.4.1 Government initiatives to support market growth
                                     TABLE 114 AUSTRALIA: IN VITRO FERTILIZATION MARKET, BY PRODUCT, 2019–2026 (USD MILLION)
                                     TABLE 115 AUSTRALIA: IN VITRO FERTILIZATION EQUIPMENT MARKET, BY TYPE, 2019–2026 (USD MILLION)
                                     TABLE 116 AUSTRALIA: IN VITRO FERTILIZATION REAGENTS & MEDIA MARKET , BY TYPE, 2019–2026 (USD MILLION)
             10.2.5 SOUTH KOREA
                        10.2.5.1 Rising R&D activities to positively impact market growth
                                     TABLE 117 SOUTH KOREA: IN VITRO FERTILIZATION INDUSTRY, BY PRODUCT, 2019–2026 (USD MILLION)
                                     TABLE 118 SOUTH KOREA: IN VITRO FERTILIZATION EQUIPMENT MARKET, BY TYPE, 2019–2026 (USD MILLION)
                                     TABLE 119 SOUTH KOREA: IN VITRO FERTILIZATION REAGENTS & MEDIA MARKET, BY TYPE, 2019–2026 (USD MILLION)
             10.2.6 REST OF ASIA PACIFIC
                        TABLE 120 ROAPAC: MARKET, BY PRODUCT, 2019–2026 (USD MILLION)
                        TABLE 121 ROAPAC: IN VITRO FERTILIZATION EQUIPMENT MARKET, BY TYPE, 2019–2026 (USD MILLION)
                        TABLE 122 ROAPAC: IN VITRO FERTILIZATION REAGENTS & MEDIA MARKET, BY TYPE, 2019–2026 (USD MILLION)
     10.3 EUROPE
             TABLE 123 EUROPE: IN VITRO FERTILIZATION INDUSTRY, BY COUNTRY, 2019–2026 (USD MILLION)
             TABLE 124 EUROPE: MARKET, BY PRODUCT, 2019–2026 (USD MILLION)
             TABLE 125 EUROPE: IN VITRO FERTILIZATION EQUIPMENT MARKET, BY TYPE, 2019–2026 (USD MILLION)
             TABLE 126 EUROPE: IN VITRO FERTILIZATION REAGENTS & MEDIA MARKET, BY TYPE, 2019–2026 (USD MILLION)
             TABLE 127 EUROPE: MARKET, BY TYPE, 2019–2026 (USD MILLION)
             TABLE 128 EUROPE: MARKET, BY CYCLE, 2019–2026 (USD MILLION)
             TABLE 129 EUROPE: MARKET, BY END USER, 2019–2026 (USD MILLION)
             10.3.1 GERMANY
                        10.3.1.1 Favorable funding scenario for IVF treatments to drive market growth
                                     TABLE 130 GERMANY: IN VITRO FERTILIZATION MARKET, BY PRODUCT, 2019–2026 (USD MILLION)
                                     TABLE 131 GERMANY: IN VITRO FERTILIZATION EQUIPMENT MARKET, BY TYPE, 2019–2026 (USD MILLION)
                                     TABLE 132 GERMANY: IN VITRO FERTILIZATION REAGENTS & MEDIA MARKET, BY TYPE, 2019–2026 (USD MILLION)
             10.3.2 UK
                        10.3.2.1 Supportive regulatory framework to enhance market growth
                                     FIGURE 30 UK: NUMBER OF IVF CYCLES, BY EGG AND SPERM SOURCE, 2010-2019
                                     TABLE 133 UK: MARKET, BY PRODUCT, 2019–2026 (USD MILLION)
                                     TABLE 134 UK: IN VITRO FERTILIZATION EQUIPMENT MARKET, BY TYPE, 2019–2026 (USD MILLION)
                                     TABLE 135 UK: IN VITRO FERTILIZATION REAGENTS & MEDIA MARKET, BY TYPE, 2019–2026 (USD MILLION)
             10.3.3 FRANCE
                        10.3.3.1 Rising healthcare spending to drive market growth
                                     TABLE 136 FRANCE: MARKET, BY PRODUCT, 2019–2026 (USD MILLION)
                                     TABLE 137 FRANCE: IN VITRO FERTILIZATION EQUIPMENT MARKET, BY TYPE, 2019–2026 (USD MILLION)
                                     TABLE 138 FRANCE: IN VITRO FERTILIZATION REAGENTS & MEDIA MARKET , BY TYPE, 2019–2026 (USD MILLION)
             10.3.4 ITALY
                        10.3.4.1 Decreasing fertility rates to drive demand for IVF procedures
                                     TABLE 139 ITALY: IN VITRO FERTILIZATION MARKET, BY PRODUCT, 2019–2026 (USD MILLION)
                                     TABLE 140 ITALY: IN VITRO FERTILIZATION EQUIPMENT MARKET, BY TYPE, 2019–2026 (USD MILLION)
                                     TABLE 141 ITALY: IN VITRO FERTILIZATION REAGENTS & MEDIA MARKET, BY TYPE, 2019–2026 (USD MILLION)
             10.3.5 SPAIN
                        10.3.5.1 Increasing fertility tourism to boost market
                                     TABLE 142 SPAIN: MARKET, BY PRODUCT, 2019–2026 (USD MILLION)
                                     TABLE 143 SPAIN: IN VITRO FERTILIZATION EQUIPMENT MARKET, BY TYPE, 2019–2026 (USD MILLION)
                                     TABLE 144 SPAIN: IN VITRO FERTILIZATION REAGENTS & MEDIA MARKET , BY TYPE, 2019–2026 (USD MILLION)
             10.3.6 REST OF EUROPE
                        TABLE 145 ROE: MARKET, BY PRODUCT, 2019–2026 (USD MILLION)
                        TABLE 146 ROE: IN VITRO FERTILIZATION EQUIPMENT MARKET, BY TYPE, 2019–2026 (USD MILLION)
                        TABLE 147 ROE: IN VITRO FERTILIZATION REAGENTS & MEDIA MARKET , BY TYPE, 2019–2026 (USD MILLION)
     10.4 NORTH AMERICA
             TABLE 148 NORTH AMERICA: IN VITRO FERTILIZATION INDUSTRY, BY COUNTRY, 2019–2026 (USD MILLION)
             TABLE 149 NORTH AMERICA: MARKET, BY PRODUCT, 2019–2026 (USD MILLION)
             TABLE 150 NORTH AMERICA: IN VITRO FERTILIZATION EQUIPMENT MARKET, BY TYPE, 2019–2026 (USD MILLION)
             TABLE 151 NORTH AMERICA: IN VITRO FERTILIZATION REAGENTS & MEDIA MARKET , BY TYPE, 2019–2026 (USD MILLION)
             TABLE 152 NORTH AMERICA: MARKET, BY TYPE, 2019–2026 (USD MILLION)
             TABLE 153 NORTH AMERICA: MARKET, BY TYPE OF CYCLE, 2019–2026 (USD MILLION)
             TABLE 154 NORTH AMERICA: MARKET, BY END USER, 2019–2026 (USD MILLION)
             10.4.1 US
                        10.4.1.1 Increasing healthcare expenditure drives IVF market
                                     TABLE 155 US: IN VITRO FERTILIZATION MARKET, BY PRODUCT, 2019–2026 (USD MILLION)
                                     TABLE 156 US: IN VITRO FERTILIZATION EQUIPMENT MARKET, BY TYPE, 2019–2026 (USD MILLION)
                                     TABLE 157 US: IN VITRO FERTILIZATION REAGENTS & MEDIA MARKET, BY TYPE, 2019–2026 (USD MILLION)
             10.4.2 CANADA
                        10.4.2.1 High cost of in vitro fertilization to restrain market growth
                                     TABLE 158 CANADA: IN VITRO FERTILIZATION INDUSTRY, BY PRODUCT, 2019–2026 (USD MILLION)
                                     TABLE 159 CANADA: IN VITRO FERTILIZATION EQUIPMENT MARKET, BY TYPE, 2019–2026 (USD MILLION)
                                     TABLE 160 CANADA: IN VITRO FERTILIZATION REAGENTS & MEDIA MARKET, BY TYPE, 2019–2026 (USD MILLION)
     10.5 LATIN AMERICA
             TABLE 161 LATAM: MARKET, BY COUNTRY, 2019–2026 (USD MILLION)
             TABLE 162 LATAM: MARKET, BY PRODUCT, 2019–2026 (USD MILLION)
             TABLE 163 LATAM: IN VITRO FERTILIZATION EQUIPMENT MARKET, BY TYPE, 2019–2026 (USD MILLION)
             TABLE 164 LATAM: IN VITRO FERTILIZATION REAGENTS & MEDIA MARKET, BY TYPE, 2019–2026 (USD MILLION)
             TABLE 165 LATAM: MARKET, BY TYPE, 2019–2026 (USD MILLION)
             TABLE 166 LATAM: MARKET, BY TYPE OF CYCLE, 2019–2026 (USD MILLION)
             TABLE 167 LATAM: MARKET, BY END USER, 2019–2026 (USD MILLION)
             10.5.1 BRAZIL
                        10.5.1.1 Supportive government regulations drive market
                                     TABLE 168 BRAZIL: IN VITRO FERTILIZATION INDUSTRY, BY PRODUCT, 2019–2026 (USD MILLION)
                                     TABLE 169 BRAZIL: IN VITRO FERTILIZATION EQUIPMENT MARKET, BY TYPE, 2019–2026 (USD MILLION)
                                     TABLE 170 BRAZIL: IN VITRO FERTILIZATION REAGENTS & MEDIA MARKET, BY TYPE, 2019–2026 (USD MILLION)
                                     TABLE 171 MEXICO: MARKET, BY PRODUCT, 2019–2026 (USD MILLION)
                                     TABLE 172 MEXICO: IN VITRO FERTILIZATION EQUIPMENT MARKET, BY TYPE, 2019–2026 (USD MILLION)
                                     TABLE 173 MEXICO: IN VITRO FERTILIZATION REAGENTS & MEDIA MARKET, BY TYPE, 2019–2026 (USD MILLION)
             10.5.2 REST OF LATIN AMERICA
                        TABLE 174 REST OF LATIN AMERICA: IN VITRO FERTILIZATION MARKET, BY PRODUCT, 2019–2026 (USD MILLION)
                        TABLE 175 REST OF LATIN AMERICA: IN VITRO FERTILIZATION EQUIPMENT MARKET, BY TYPE, 2019–2026 (USD MILLION)
                        TABLE 176 REST OF LATIN AMERICA: IN VITRO FERTILIZATION REAGENTS & MEDIA MARKET, BY TYPE, 2019–2026 (USD MILLION)
     10.6 MIDDLE EAST & AFRICA
             10.6.1 RISING INCIDENCE OF INFERTILITY TO DRIVE MARKET GROWTH DURING FORECAST PERIOD
                        TABLE 177 MEA: MARKET, BY PRODUCT, 2019–2026 (USD MILLION)
                        TABLE 178 MEA: IN VITRO FERTILIZATION EQUIPMENT MARKET, BY TYPE, 2019–2026 (USD MILLION)
                        TABLE 179 MEA: IN VITRO FERTILIZATION REAGENTS & MEDIA MARKET, BY TYPE, 2019–2026 (USD MILLION)
                        TABLE 180 MEA: MARKET, BY TYPE, 2019–2026 (USD MILLION)
                        TABLE 181 MEA: MARKET, BY TYPE OF CYCLE, 2019–2026 (USD MILLION)
                        TABLE 182 MEA: MARKET, BY END USER, 2019–2026 (USD MILLION)

11 COMPETITIVE LANDSCAPE (Page No. - 182)
     11.1 OVERVIEW
     11.2 KEY PLAYER STRATEGIES
     11.3 REVENUE SHARE ANALYSIS OF TOP MARKET PLAYERS
             FIGURE 31 REVENUE SHARE ANALYSIS OF TOP PLAYERS IN IN VITRO FERTILIZATION MARKET
     11.4 MARKET SHARE ANALYSIS (2020)
             TABLE 183 GLOBAL MARKET: DEGREE OF COMPETITION
     11.5 COMPETITIVE LEADERSHIP MAPPING
             11.5.1 STARS
             11.5.2 PERVASIVE PLAYERS
             11.5.3 EMERGING LEADERS
             11.5.4 PARTICIPANTS
                        FIGURE 32 GLOBAL MARKET: COMPETITIVE LEADERSHIP MAPPING, 2020
     11.6 COMPETITIVE LEADERSHIP MAPPING FOR START-UPS/SMES (2020)
             11.6.1 PROGRESSIVE COMPANIES
             11.6.2 STARTING BLOCKS
             11.6.3 RESPONSIVE COMPANIES
             11.6.4 DYNAMIC COMPANIES
                        FIGURE 33 GLOBAL MARKET: COMPETITIVE LEADERSHIP MAPPING FOR START-UPS/SMES, 2020
     11.7 FOOTPRINT ANALYSIS OF TOP PLAYERS IN GLOBAL MARKET
             11.7.1 PRODUCT AND REGIONAL FOOTPRINT ANALYSIS OF TOP PLAYERS IN GLOBAL MARKET
                        TABLE 184 PRODUCT FOOTPRINT OF COMPANIES
                        TABLE 185 REGIONAL FOOTPRINT OF COMPANIES
     11.8 COMPETITIVE SCENARIO
             11.8.1 GLOBAL MARKET: PRODUCT LAUNCHES AND REGULATORY APPROVALS
                        TABLE 186 KEY PRODUCT LAUNCHES AND REGULATORY APPROVALS, JANUARY 2018–AUGUST 2021
             11.8.2 GLOBAL MARKET: DEALS
                        TABLE 187 KEY DEALS, JANUARY 2018–AUGUST 2021
             11.8.3 GLOBAL MARKET: OTHER DEVELOPMENTS
                        TABLE 188 OTHER KEY DEVELOPMENTS, JANUARY 2018–AUGUST 2021

12 COMPANY PROFILES (Page No. - 194)
     12.1 MAJOR COMPANIES
(Business Overview, Products Offered, Recent Developments, MnM View)* 
             12.1.1 THE COOPER COMPANIES INC.
                        TABLE 189 THE COOPER COMPANIES INC.: BUSINESS OVERVIEW
                        FIGURE 34 THE COOPER COMPANIES INC.: COMPANY SNAPSHOT (2020)
                        TABLE 190 THE COOPER COMPANIES, INC.: PRODUCT OFFERINGS
             12.1.2 COOK GROUP
                        TABLE 191 COOK GROUP: BUSINESS OVERVIEW
                        TABLE 192 COOK GROUP: PRODUCT OFFERINGS
             12.1.3 VITROLIFE
                        TABLE 193 VITROLIFE: BUSINESS OVERVIEW
                        FIGURE 35 VITROLIFE: COMPANY SNAPSHOT (2020)
                        TABLE 194 VITROLIFE: PRODUCT OFFERINGS
             12.1.4 THERMO FISHER SCIENTIFIC
                        TABLE 195 THERMO FISHER SCIENTIFIC: BUSINESS OVERVIEW
                        FIGURE 36 THERMO FISHER SCIENTIFIC: COMPANY SNAPSHOT (2020)
                        TABLE 196 THERMO FISHER SCIENTIFIC: PRODUCT OFFERINGS
             12.1.5 HAMILTON THORNE LTD.
                        TABLE 197 HAMILTON THORNE LTD.: BUSINESS OVERVIEW
                        FIGURE 37 HAMILTON THORNE LTD.: COMPANY SNAPSHOT (2020)
                        TABLE 198 HAMILTON THORNE LTD.: PRODUCT OFFERINGS
             12.1.6 ESCO MICRO PTE. LTD.
                        TABLE 199 ESCO MICRO PTE. LTD.: BUSINESS OVERVIEW
                        TABLE 200 ESCO MICRO PTE. LTD.: PRODUCT OFFERINGS
             12.1.7 GENEA LIMITED
                        TABLE 201 GENEA LIMITED: BUSINESS OVERVIEW
                        TABLE 202 GENEA LIMITED: PRODUCT OFFERINGS
             12.1.8 IVFTECH APS
                        TABLE 203 IVFTECH APS: BUSINESS OVERVIEW
                        TABLE 204 IVFTECH APS: PRODUCT OFFERINGS
             12.1.9 FUJIFILM IRVINE SCIENTIFIC
                        TABLE 205 FUJIFILM IRVINE SCIENTIFIC: BUSINESS OVERVIEW
                        FIGURE 38 FUJIFILM HOLDINGS CORPORATION: COMPANY SNAPSHOT (2020)
                        TABLE 206 FUJIFILM IRVINE SCIENTIFIC: PRODUCT OFFERINGS
             12.1.10 THE BAKER COMPANY, INC.
                        TABLE 207 THE BAKER COMPANY, INC.: BUSINESS OVERVIEW
                        TABLE 208 THE BAKER COMPANY, INC.: PRODUCTS OFFERED
             12.1.11 KITAZATO CORPORATION
                        TABLE 209 KITAZATO CORPORATION: BUSINESS OVERVIEW
                        TABLE 210 KITAZATO CORPORATION: PRODUCTS OFFERED
             12.1.12 CORNING INCORPORATED
                        TABLE 211 THE CORNING INCORPORATED.: BUSINESS OVERVIEW
                        FIGURE 39 CORNNG INCORPORTAED: COMPANY SNAPSHOT (2020)
                        TABLE 212 CORNING INCORPORATED.: PRODUCT OFFERINGS
             12.1.13 ZEISS GROUP
                        TABLE 213 ZEISS GROUP: BUSINESS OVERVIEW
                        FIGURE 40 ZEISS GROUP: COMPANY SNAPSHOT (2020)
                        TABLE 214 ZEISS GROUP: PRODUCT OFFERINGS
             12.1.14 FERTIPRO NV
                        TABLE 215 FERTIPRO NV : BUSINESS OVERVIEW
                        TABLE 216 FERTIPRO NV: PRODUCT OFFERINGS
             12.1.15 EPPENDORF
                        TABLE 217 EPPENDORF.: BUSINESS OVERVIEW
                        FIGURE 41 EPPENDORF: COMPANY SNAPSHOT (2020)
                        TABLE 218 EPPENDORF.: PRODUCT OFFERINGS
      12.2 OTHER COMPANIES
             12.2.1 DXNOW, INC.
             12.2.2 NIDACON INTERNATIONAL AB
             12.2.3 MICROTECH IVF S.R.O.
             12.2.4 SAR HEALTHLINE PVT. LTD.
             12.2.5 INVITROCARE INC.
*Details on Business Overview, Products Offered, Recent Developments, MnM View might not be captured in case of unlisted companies. 
      
13 APPENDIX (Page No. - 234)
     13.1 DISCUSSION GUIDE
     13.2 KNOWLEDGE STORE: MARKETSANDMARKETS’ SUBSCRIPTION PORTAL
     13.3 AVAILABLE CUSTOMIZATIONS
     13.4 RELATED REPORTS
     13.5 RELATED REPORTS 
    

The study involved four major activities to estimate the current size of the in vitro fertilization market. Exhaustive secondary research was carried out to collect information on the market and its different subsegments. The next step was to validate these findings, assumptions, and sizing with industry experts across the value chain through primary research. Top-down and bottom-up approaches were employed to estimate the complete market size. Thereafter, market breakdown and data triangulation procedures were used to estimate the size of segments and subsegments.

Secondary Research

In the secondary research process, various secondary sources, such as annual reports, press releases & investor presentations of companies, white papers, certified publications, articles by recognized authors, regulatory bodies, and publications from government sources such as World Health Organization (WHO), World Bank, Human Fertilization and Embryology Authority (HFEA), International Federation of Fertility Societies (IFFS), American Society for Reproductive Medicine (ASRM), European Society of Human Reproduction and Embryology (ESHRE), Australia and New Zealand Assisted Reproduction Database (ANZARD), Centers for Disease Control and Prevention (CDC), were referred to identify and collect information for the global market study.

Primary Research

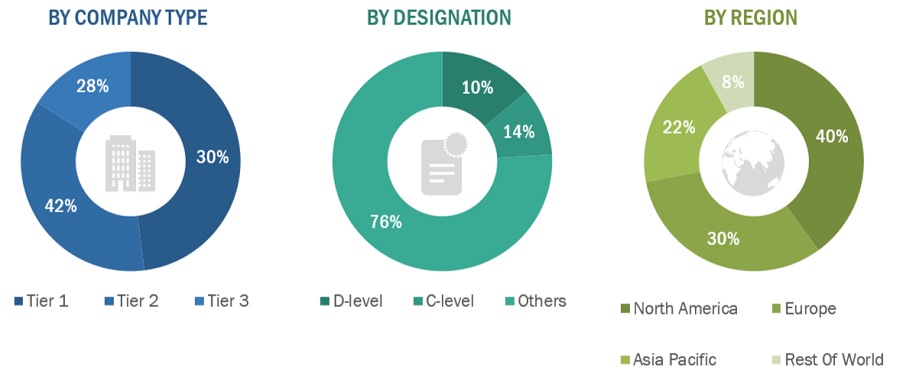
The global market comprises several stakeholders such as manufacturers Of in vitro fertilization equipment, reagents & media, and accessories market research and consulting firms. The demand side of this market is characterized by the rise in number of fertility clinics, decline in fertility rates,   presence of well established players in the market. Various primary sources from both the supply and demand sides of the market were interviewed to obtain qualitative and quantitative information. The following is the breakdown of primary respondents:

In vitro fertilization Market Size

To know about the assumptions considered for the study, download the pdf brochure

Market Size Estimation

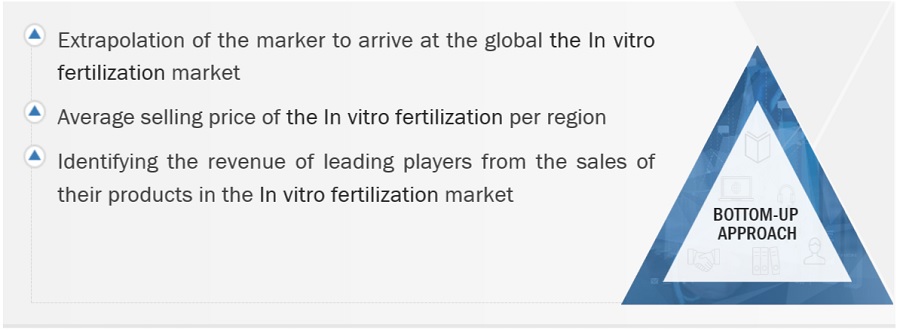
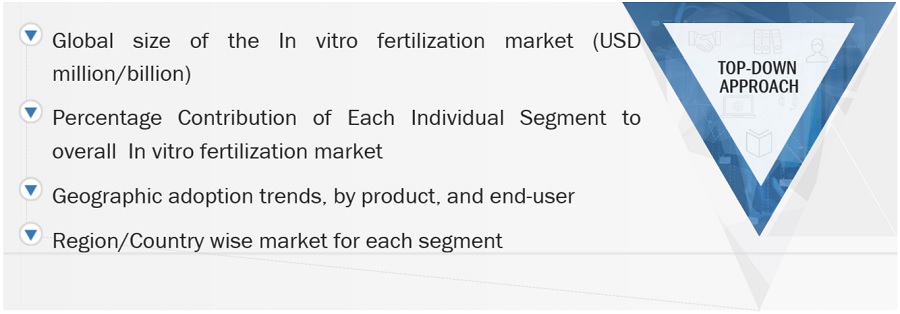
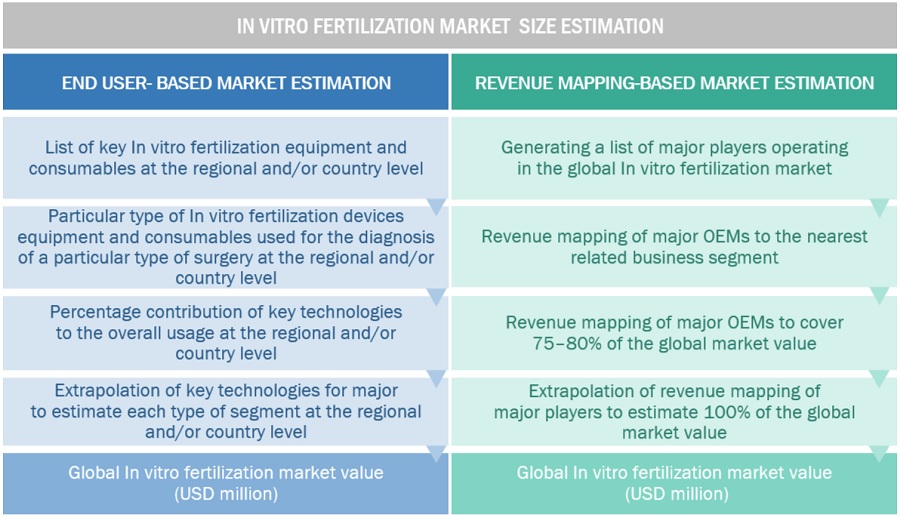
Both top-down and bottom-up approaches were used to estimate and validate the total size of the in vitro fertilization market. These methods were also used extensively to estimate the size of various subsegments in the market. The research methodology used to estimate the market size includes the following:

  • The key players in the industry and markets have been identified through extensive secondary research
  • The industry’s supply chain and market size, in terms of value, have been determined through primary and secondary research
  • All percentage shares, splits, and breakdowns have been determined using secondary sources and verified through primary sources

In vitro fertilization Market Size

In vitro fertilization Market Size

Data Triangulation

After arriving at the overall size of the global in vitro fertilization market through the above-mentioned methodology, this market was split into several segments and subsegments. The data triangulation and market breakdown procedures were employed, wherever applicable, to complete the overall market engineering process and arrive at the exact market value data for the key segments and subsegments. The extrapolated market data was triangulated by studying various macro indicators and regional trends from both demand- and supply-side participants.

Report Objectives

  • To define, describe, and forecast the global in vitro fertilization market on the basis of product, modality, usage, disease indication, and region.
  • To provide detailed information regarding the major factors influencing the market growth (such as drivers, restraints, opportunities, and challenges)
  • To strategically analyze micromarkets1 with respect to individual growth trends, future prospects, and contributions to the overall market
  • To analyze the opportunities in the market for key stakeholders and provide details of the competitive landscape for major market leaders
  • To forecast the size of the market segments with respect to five main regions, namely, North America (the US and Canada), Europe (Germany, the UK, France, Italy, Spain, and Rest of Europe), Asia Pacific (Japan, China, India, Australia, South Korea, and Rest of Asia Pacific), Latin America (Brazil, Mexico, and Rest of Latin America), and the Middle East & Africa
  • To profile the key market players and comprehensively analyze their market shares and core competencies2
  • To track and analyze competitive developments such as mergers and acquisitions, new product developments, partnerships, agreements, collaborations, and expansions in the global in vitro fertilization  market

Available Customizations

With the given market data, MarketsandMarkets offers customizations as per your company’s specific needs. The following customization options are available for the global in vitro fertilization market report

Product Analysis

  • Product Matrix, which gives a detailed comparison of the product portfolios of the top five global players.

Company Information

  • Detailed analysis and profiling of additional market players (up to 5 OEMs)

Geographic Analysis

  • Further breakdown of the Rest of Europe in vitro fertilization ;market into Belgium, Austria,
  • Denmark, Greece, Poland, and Russia, among other countries
  • Further breakdown of the Rest of Asia Pacific in vitro fertilization market into New Zealand, Vietnam, Philippines, Singapore, Malaysia, Thailand, and Indonesia, among other countries
  • Further breakdown of the Rest of Latin America in vitro fertilization market into Argentina, and Colombia, among other countries.
Custom Market Research Services

We will customize the research for you, in case the report listed above does not meet with your exact requirements. Our custom research will comprehensively cover the business information you require to help you arrive at strategic and profitable business decisions.

Request Customization

Instant Answers with GPT - Ask Now!

Ask real questions. Get complete answers !
Report Code
MD 4467
Published ON
Nov, 2021
Choose License Type
BUY NOW
  • SHARE
X
Request Customization
Speak to Analyst
Speak to Analyst
OR FACE-TO-FACE MEETING
PERSONALIZE THIS RESEARCH
  • Triangulate with your Own Data
  • Get Data as per your Format and Definition
  • Gain a Deeper Dive on a Specific Application, Geography, Customer or Competitor
  • Any level of Personalization
REQUEST A FREE CUSTOMIZATION
LET US HELP YOU!
  • What are the Known and Unknown Adjacencies Impacting the In Vitro Fertilization Market
  • What will your New Revenue Sources be?
  • Who will be your Top Customer; what will make them switch?
  • Defend your Market Share or Win Competitors
  • Get a Scorecard for Target Partners
CUSTOMIZED WORKSHOP REQUEST
+1-888-600-6441
  • Call Us
  • +1-888-600-6441 (Corporate office hours)
  • +1-888-600-6441 (US/Can toll free)
  • +44-800-368-9399 (UK office hours)
CONNECT WITH US
ABOUT TRUST ONLINE
©2024 MarketsandMarkets Research Private Ltd. All rights reserved
DMCA.com Protection Status Website Feedback