India Military EO/IR Market by Product Type (Handheld Systems, EO/IR Payloads), Cooling Technology (Cooled, Uncooled), Imaging Technology (Multispectral, Hyperspectral), Platform, Component, Sensing Technology, and Point of Sale - Forecast to 2030

icon1
USD 1.78 BN
MARKET SIZE, 2030
icon2
CAGR 10.4%
(2026-2030)
icon3
480
REPORT PAGES
icon4
250
MARKET TABLES

OVERVIEW

india-military-electro-optics-infrared-eoir-systems-market Overview

Source: Secondary Research, Interviews with Experts, MarketsandMarkets Analysis

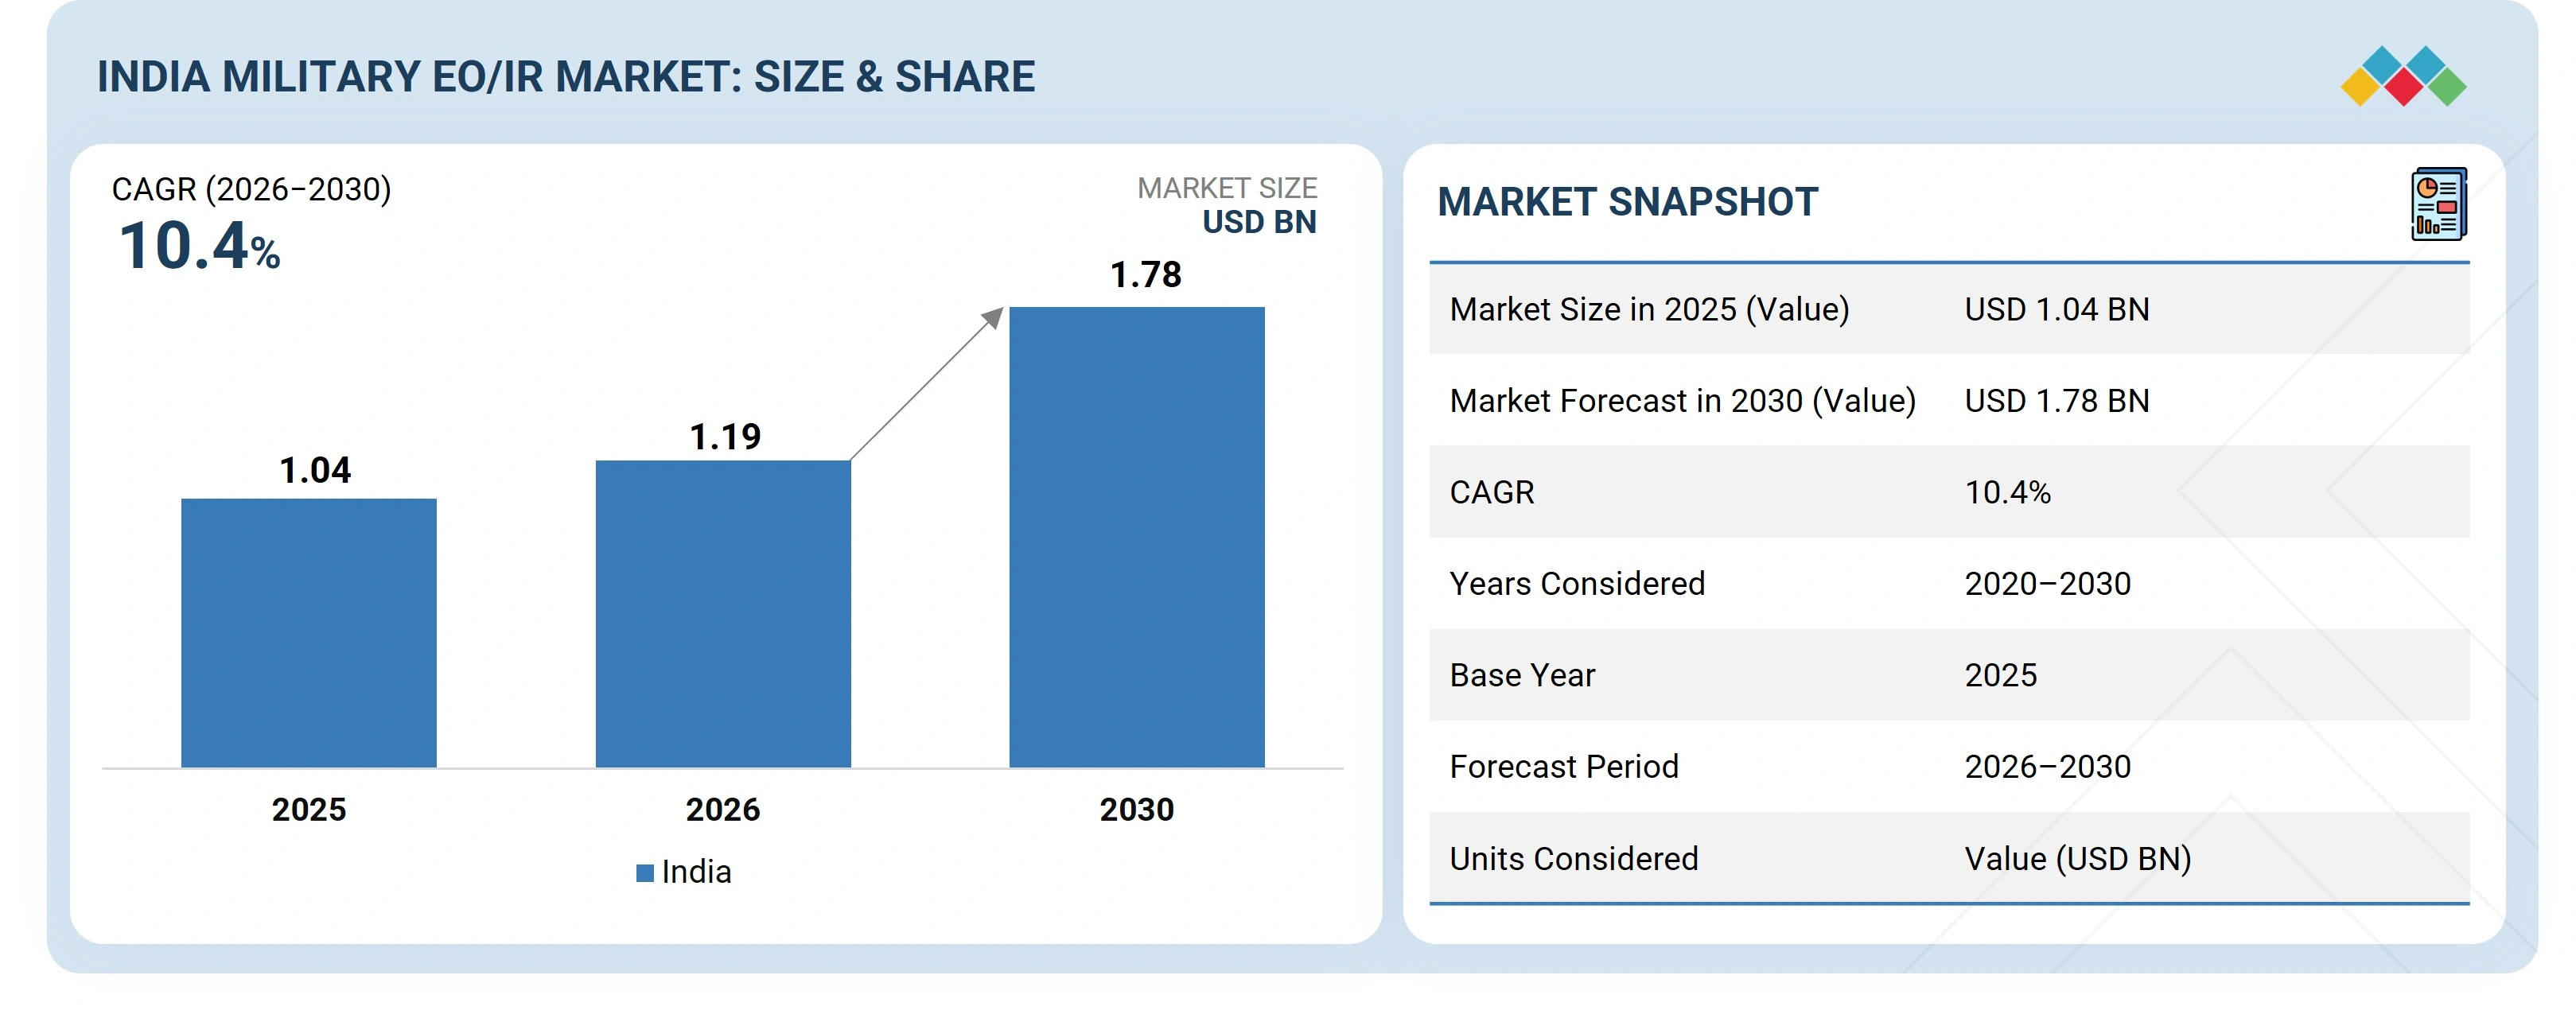
The India Military EO/IR market is projected to grow from USD 1.19 billion in 2026 to USD 1.78 billion in 2030, at a CAGR of 10.4%. India’s military EO/IR market is driven by the need for better border surveillance, night fighting capability, drone detection, missile guidance and target tracking across land, air and naval platforms supported by defense modernization and higher use of indigenous sensor systems.

KEY TAKEAWAYS

  • By Product Type
    By product type, the handheld systems segment is expected to register the highest CAGR of 10.7% during the forecast period due to increasing procurement of soldier night-vision, weapon sights, thermal imagers, and rangefinders for border, infantry, and special forces operations.
  • By Platform
    By platform, the airborne segment is expected to dominate the market during the forecast period as India is adding and upgrading EO/IR payloads across fighter aircraft, attack helicopters, transport aircraft, special mission aircraft, and UAVs for surveillance, targeting, tracking, and mission support.
  • By Component
    By component, the sensors segment is expected to dominate the market during the forecast period because they are the core part of EO/IR systems used for detection, imaging, tracking, targeting, and surveillance across handheld, airborne, land, naval, and space platforms.
  • By Point of Sale
    By point of sale, the OEM segment is expected to dominate the market during the forecast period because new aircraft, UAVs, combat vehicles, ships, and space systems are increasingly being fitted with EO/IR systems at the production stage rather than added later.
  • By Cooling Technology
    By cooling technology, the cooled segment is expected to register the highest CAGR of 17.3% from 2026 to 2030 because India needs longer-range and higher-sensitivity EO/IR sensors for airborne targeting, UAV surveillance, naval EOIRST, and border monitoring.
  • By Imaging Technology
    By imaging technology, the crewed segment is expected to register the highest CAGR of 92.2% from 2026 to 2030 as India needs better target identification, camouflage detection, terrain mapping, and space-based surveillance across military ISR missions.
  • By Sensing Technology
    By sensing technology, the crewed segment is expected to register the highest CAGR of 92.2% from 2026 to 2030 as India needs continuous wide-area detection and tracking for UAVs, aircraft, counter-drone systems, border surveillance, and space-based ISR.
  • Competitive Landscape - Key Companies
    Safran, Thales, and Rafael Advanced Defence Systems Ltd, among others, were identified as some of the star players in the India military EO/IR market, given their strong market share and product footprint.
  • Competitive Landscape - Startups/SMEs
    Sterlite Technologies Limited, BRAVECORE, and Defsys Solutions Pvt. Ltd, among others, have distinguished themselves among startups and SMEs by securing strong footholds in specialized niche areas, underscoring their potential as emerging market leaders.

The India military EO/IR market is growing due to the need to improve surveillance, target detection, and night operations along borders, coasts and high altitude areas. The growing use of drones, precision weapons, armored vehicles, aircraft, and naval platforms is increasing demand for thermal cameras, targeting sights and sensor payloads. Local defense production and modernization programs are also supporting wider use of EO/IR systems across the armed forces.

TRENDS & DISRUPTIONS IMPACTING CUSTOMERS' CUSTOMERS

The impact on customers’ customers in the India military EO/IR market comes from the wider use of EO/IR systems across soldier equipment, combat vehicles, aircraft, UAVs, naval platforms, and space-based surveillance. The market has traditionally been driven by handheld thermal imagers, weapon sights, rangefinders, tank sights, naval fire-control systems and basic airborne payloads, but demand is now shifting toward UAV EO/IR payloads, combat vehicle 360-degree awareness systems, naval EOIRST, counter-drone tracking and space-based IR and hyperspectral payloads. These changes are affecting the needs of the Indian Army, Indian Air Force, Indian Navy, Coast Guard, DRDO, vehicle OEMs, and UAV makers. As the market develops, companies need to align their products, technology investments, partnerships and upgrade plans with these new use cases.

india-military-electro-optics-infrared-eoir-systems-market Disruptions

Source: Secondary Research, Interviews with Experts, MarketsandMarkets Analysis

MARKET DYNAMICS

Drivers
Impact
Level
  • Advancements and enhancements in technology utilized for EO/IR
  • Significant investments in EO/IR systems by governments
RESTRAINTS
Impact
Level
  • Stagnant product life cycle
  • High development, production, and maintenance costs
OPPORTUNITIES
Impact
Level
  • Integration of EO/IR systems with conventional military systems
  • Surging adoption of unmanned systems across platforms
CHALLENGES
Impact
Level
  • Germanium supply constraints in optics manufacturing
  • Cryogenic packaging and cooling limitations

Source: Secondary Research, Interviews with Experts, MarketsandMarkets Analysis

Driver: Advancements and enhancements in technology utilized for EO/IR

Improvements in sensors, optics, processors, stabilization and image quality are making EO/IR systems more useful for day-night surveillance, targeting and tracking across land, air, naval and space platforms.

Restraint: Stagnant product life cycle

Many EO/IR systems have long replacement cycles because military platforms are used for several years, which can slow down fresh purchases unless upgrades or modernization programs are approved.

Opportunity:Integration of EO/IR systems with conventional military systems

EO/IR systems are increasingly being added to existing aircraft, ships, combat vehicles, UAVs and soldier equipment, creating steady demand through both new fitments and upgrades.

Challenge:Germanium supply constraints in optics manufacturing

Germanium is important for infrared optics, but limited supply and price changes can affect production cost, delivery timelines, and planning for EO/IR system makers.

INDIA MILITARY ELECTRO OPTICS INFRARED (EOIR) SYSTEMS MARKET: COMMERCIAL USE CASES ACROSS INDUSTRIES

COMPANY USE CASE DESCRIPTION BENEFITS
Supply of image intensifier night sights for Indian Army SIG 716 rifles; the MoD signed a contract with an MKU-led consortium for night sights that support target engagement in low-light conditions. Improves night use of infantry rifles | Supports dismounted soldier operations | Adds demand for weapon sights and handheld night-vision systems
Upgrade of T-90 tank commander sights with MWIR thermal imager-based day/night sights; the MoD signed a contract with BEL for 957 T-90 tanks, with target detection up to 8 km and laser ranging up to 5 km. Improves day and night target detection | Supports tank fire-control upgrades | Adds aftermarket demand for combat vehicle EO/IR systems
Use of LITENING targeting pods on Indian Air Force combat aircraft; FlightGlobal reported that Rafael would supply 164 LITENING pods for the IAF, including use on Su-30 fighters. Supports target detection and tracking from aircraft | Improves precision strike support | Adds demand for airborne EO/IR payloads and long-term support

Logos and trademarks shown above are the property of their respective owners. Their use here is for informational and illustrative purposes only.

MARKET ECOSYSTEM

The India military EO/IR market ecosystem includes manufacturers, service providers and end users working together across land, air, naval, and border security applications. Manufacturers such as Rafael Advanced Defense Systems, MKU Limited, Bharat Electronics Limited, Tata Advanced Systems, Elbit Systems, and Lockheed Martin provide EO/IR products such as weapon sights, thermal imagers, targeting systems, surveillance payloads and platform-based sensor systems. Service providers such as HAL, Larsen & Toubro, Data Patterns, Paras Defence, and ideaForge support the market through platform integration, defence electronics, UAV systems, testing, maintenance, and related engineering work. On the demand side, end users such as the Indian Army, Indian Air Force, Indian Navy, and Indian Coast Guard use EO/IR systems for night operations, target detection, surveillance, fire control, border monitoring, and maritime security.

india-military-electro-optics-infrared-eoir-systems-market Ecosystem

Logos and trademarks shown above are the property of their respective owners. Their use here is for informational and illustrative purposes only.

MARKET SEGMENTS

india-military-electro-optics-infrared-eoir-systems-market Segments

Source: Secondary Research, Interviews with Experts, MarketsandMarkets Analysis

India Military EO/IR Market, By Product Type

The EO/IR payloads segment is expected to hold the largest market share due to the extensive utilization across various platforms, including aircraft, helicopters, UAVs, naval vessels, and combat vehicles, primarily for surveillance, targeting, and tracking purposes. India is ramping up the deployment of these payloads on both new and existing platforms, leading to heightened demand for integrated sensor systems, stabilization units, and processing components throughout the forecast period.

India Military EO/IR Market, By Platform

The airborne segment is expected to hold the largest market share due to the high adoption of EO/IR systems on fighter aircraft, UAVs, and special mission aircraft for surveillance, targeting, and reconnaissance roles. These platforms require advanced, multi-sensor payloads with higher unit costs and frequent upgrades, leading to greater overall spending compared to land and naval segments.

India Military EO/IR Market, By Component

The stabilization units segment is expected to hold the largest portion of the market, as these units are essential for maintaining stability of EO/IR sensors on mobile platforms, including aircraft, UAVs, naval vessels, and vehicles. With India's growing reliance on airborne and mobile EO/IR systems, the demand for stable imaging and precise tracking is increasing, leading to a higher utilization of stabilization units in various EO/IR applications.

India Military EO/IR Market, By Point of Sale

OEMs are expected to hold the largest market share as EO/IR systems are being more frequently integrated during the manufacturing of new aircraft, UAVs, combat vehicles, naval vessels, and space systems. India's modernization programs are enhancing these platforms, leading to a more direct incorporation of sensors, payloads, and optics during the production phase instead of adding them later through upgrades or replacements.

India Military EO/IR Market, By Cooling Technology

The cooled segment is expected to have the highest growth due to the increasing demand for long-range detection, higher sensitivity, and better performance in low-light and harsh conditions. These systems are being adopted more in airborne, naval, and high-end land applications where accuracy and detection range are critical, leading to higher procurement despite higher costs.

India Military EO/IR Market, By Sensing Technology

The staring segment is expected to have the highest growth as it provides continuous imaging and faster target detection without mechanical movement. It is used more in modern EO/IR systems on UAVs, aircraft, and surveillance platforms where real-time tracking and higher reliability are required, leading to increased adoption.

India Military EO/IR Market, By Imaging Technology

The hyperspectral imaging segment is expected to have the highest growth as it can detect and identify materials more accurately by capturing detailed spectral data. It is used more in surveillance, target detection, and intelligence tasks where standard imaging is not sufficient, leading to increased adoption in advanced military applications.

INDIA MILITARY ELECTRO OPTICS INFRARED (EOIR) SYSTEMS MARKET: COMPANY EVALUATION MATRIX

In the India military EO/IR market matrix, Rafael Advanced Defense Systems Ltd (Star) has a strong position supported by its airborne EO/IR targeting pods, surveillance payloads, electro-optical systems, and experience across military aircraft, helicopters, UAVs, and land platforms. The company has a wide product base and works with several defence forces, which supports its position across targeting, tracking, surveillance, and platform-based EO/IR use cases. Bharat Electronics Limited (BEL) (Emerging Leader) is building its position through Indian defence programs, including thermal sights, electro-optical systems, night-vision products, and combat vehicle upgrades. The company benefits from its local manufacturing base, defence electronics role, and links with Indian military modernization programs, supporting steady growth in India-focused EO/IR applications.

india-military-electro-optics-infrared-eoir-systems-market Evaluation Metrics

Source: Secondary Research, Interviews with Experts, MarketsandMarkets Analysis

KEY MARKET PLAYERS

MARKET SCOPE

REPORT METRIC DETAILS
Market Size in 2025 USD 1.04 Billion
Market Size in 2026 USD 1.19 Billion
Market Forecast in 2030 USD 1.78 Billion
CAGR 10.4%
Years Considered 2021–2030
Base Year 2025
Forecast Period 2026–2030
Units Considered USD Billion / Million
Report Coverage Revenue Forecast, Company Ranking, Competitive Landscape, Growth Factors, and Trends
Segments Covered
  • By Product Type:
    • Handheld Systems
    • and EO/IR Payloads
  • By Platform:
    • Land
    • Airborne
    • Naval
    • and Space
  • Component:
    • Human Machine Interface
    • Stabilization Units
    • Control Systems
    • Sensors
    • Optics
    • Processors
    • and Others
  • Cooling Technology:
    • Cooled
    • and Uncooled
  • By Imaging Technology:
    • Multispectral Imaging
    • and Hyperspectral Imaging
  • Sensing Technology: Staring
  • Point of Sale:
    • OEM
    • and Aftermarket
Countries Covered India

WHAT IS IN IT FOR YOU: INDIA MILITARY ELECTRO OPTICS INFRARED (EOIR) SYSTEMS MARKET REPORT CONTENT GUIDE

india-military-electro-optics-infrared-eoir-systems-market Content Guide

DELIVERED CUSTOMIZATIONS

We have successfully delivered the following deep-dive customizations:

CLIENT REQUEST CUSTOMIZATION DELIVERED VALUE ADDS
Leading Manufacturer Additional segment breakdown for countries Additional country-level market sizing tables for segments/subsegments covered at the regional/global level to gain an understanding of market potential by each country
Emerging Leader Additional company profiles Competitive information on targeted players to gain granular insights into direct competition
Regional Market Leader Additional country market estimates Additional country-level deep dive for a more targeted understanding of the total addressable market

RECENT DEVELOPMENTS

  • May 2025 : The Israeli Ministry of Defense awarded a contract for USD 55 million to Elbit Systems Ltd. to supply advanced protection systems for the Israeli Air Force’s Apache and Black Hawk helicopters. The five-year contract, signed through the Directorate of Defense Research and Development (DDR&D) in collaboration with the Israeli Air Force, included Elbit’s Directional Infrared Counter Measures (DIRCM) and additional self-protection technologies designed to identify, disrupt, and neutralize threats, including guided missile deflection systems. The deal is part of a broader force build-up initiative post-October 2023 conflict, reinforcing Elbit’s strategic position as a key defense partner.
  • November 2023 : The Israeli Ministry of Defense finalized a contract with Finland to sell the David’s Sling air defense system made by Rafael Advanced Defense Systems Ltd, valued at approximately USD 339 million. Director-General Maj signed the agreement. Gen. Eyal Zamir marked a key defense cooperation milestone between Israel and Finland. The signing ceremony involved senior Finnish and Israeli defense officials, including representatives from Rafael, MAFAT, and the Homa Directorate.
  • January 2025 : Teledyne FLIR LLC received a five-year Indefinite Delivery Indefinite Quantity (IDIQ) contract for USD 74.2 million from The US Coast Guard will deliver more than 125 Electro-Optic Sensor System–Modernized (ESS-M) units for its MH-60 and MH-65 rotary-wing aircraft. The ESS-M upgrade included full-HD electrooptical and infrared imaging, enhanced processing, and software improvements. These systems will support Coast Guard operations, including search and rescue, maritime law enforcement, environmental protection, and border security.

Table of Contents

Exclusive indicates content/data unique to MarketsandMarkets and not available with any competitors.

TITLE
PAGE NO
1
STUDY OBJECTIVES, SCOPE, AND DEFINITION


31
2
NAVIGATING INDIA’S STRATEGIC LANDSCAPE


36
3
MARKET FORCES SHAPING EO/IR TRAJECTORIES


64
4
TECHNOLOGY SHIFT DEFINING EO/IR BATTLEFIELD


138
5
DISCOVERING CURRENT MARKET PENETRATION AND GROWTH POTENTIAL


258
6
MAPPING THREATS, DEPENDENCIES, AND WHITE SPACES IN INDIA’S EO/IR COMPETITIVE LANDSCAPE
Identify emerging opportunities and strategic gaps in India's EO/IR market for competitive advantage.


330
7
EVALUATING COMPETITOR PROFILES IN EO/IR CAPABILITY


370
8
VALIDATED, TRIANGULATED, AND PROGRAM-BACKED RESEARCH MODEL


469
LIST OF TABLES


TABLE 1
CURRENCY EXCHANGE RATES, 2021–2024


TABLE 2
INDIA’S CAPITAL ACQUISITION MODERNIZATION BUDGET (2016–2025)


TABLE 3
EXAMPLES OF EO/IR-RELEVANT CAPITAL PROGRAMS (FY 2024–26)


TABLE 4
EO/IR SEGMENTAL COLLABORATION OPPORTUNITY


TABLE 5
GEOPOLITICAL DRIVERS VS. EO/IR IMPACT


TABLE 6
STRATEGIC MATRIX: MACRO- AND MICRO-LEVEL DRIVERS FUELING EO/IR DEMAND


TABLE 7
EO/IR SUBSYSTEM INDIGENOUS CAPABILITY READINESS


TABLE 8
EO/IR SUBSYSTEM LOCALIZATION: INDIGENOUS CAPABILITY READINESS


TABLE 9
EO/IR SUBSYSTEM LOCALIZATION: % LOCAL CONTENT AND INTEGRATION LEAD


TABLE 10
EO/IR SUBSYSTEM LOCALIZATION: KEY MILESTONES


TABLE 11
GLOBAL R&D PRIORITIES IN EO/IR AND THEIR STRATEGIC LINKAGES TO INDIA’S DEFENSE CAPABILITIES


TABLE 12
LIST OF UPCOMING PROGRAMS IN INDIA BY PLATFORM


TABLE 13
EO/IR DEMAND SEGMENTATION, BY ISR DOMAIN


TABLE 14
EO/IR DEMAND SEGMENTATION FOR ISR DOMAIN, BY COMPONENT


TABLE 15
FORWARD INDICATORS OF BUDGET-LINKED EO/IR OPPORTUNITY


TABLE 16
SEGMENT-WISE SENSOR TECHNOLOGY IMPACT


TABLE 17
VERIFIED USE CASES OF EO/IR DEPLOYMENT ON UNMANNED PLATFORMS (INDIA)


TABLE 18
APPLICATION AND PLATFORM TRENDS


TABLE 19
MARKET ENTRY BARRIERS AND SUCCESS FACTORS


TABLE 20
GLOBAL TECHNOLOGY SHIFTS


TABLE 21
GLOBAL INNOVATIONS EMERGING IN INDIAN EO/IR ECOSYSTEM


TABLE 22
HIGH-PRIORITY MODERNIZATION PROGRAMS WITH EO/IR ALIGNMENT


TABLE 23
LIST OF NEW/UPCOMING PROCUREMENTS


TABLE 24
ENTRY CHANNELS FOR EO/IR VENDORS


TABLE 25
PROGRAM WATCHLIST HEATMAP: EO/IR RELEVANCE MATRIX


TABLE 26
VALUE CHAIN STAGE-WISE CONTRIBUTION


TABLE 27
FUNCTIONAL VALUE CHAIN MAPPING: EO/IR INDUSTRY


TABLE 28
RELATIVE POSITIONING: INDIAN PLAYERS VS. GLOBAL EO/IR GIANTS


TABLE 29
DEPENDENCY LEVEL: INDIAN PLAYERS VS. GLOBAL EO/IR GIANTS


TABLE 30
STRATEGIC INSIGHTS: WHERE TO LOCALIZE NEXT


TABLE 31
APPLICATION OF EO/IR SYSTEMS IN MARITIME SECURITY AND SURVEILLANCE


TABLE 32
LIST OF KEY EO/IR USE CASES (INDIA, 2025)


TABLE 33
PORTER’S FIVE FORCES ANALYSIS


TABLE 34
INFLUENCE OF STAKEHOLDERS ON BUYING PROCESS, BY PLATFORM (%)


TABLE 35
KEY BUYING CRITERIA, BY PLATFORM


TABLE 36
COMPARATIVE INDICATIVE PRICING BENCHMARK: GLOBAL VS. INDIAN EO/IR SYSTEMS, 2023–2025 (USD MILLION) – AIRBORNE EO/IR PAYLOADS


TABLE 37
COMPARATIVE INDICATIVE PRICING BENCHMARK: GLOBAL VS. INDIAN EO/IR SYSTEMS, 2023–2025 (USD MILLION) – COMBAT VEHICLE EO/IR PAYLOADS


TABLE 38
COMPARATIVE INDICATIVE PRICING BENCHMARK: GLOBAL VS. INDIAN EO/IR SYSTEMS, 2023–2025 (USD MILLION) – MARITIME EO/IR PAYLOADS


TABLE 39
REGIONAL PRICING RANGE OF KEY PRODUCTS, 2023–2025 (USD MILLION)


TABLE 40
COUNTRY-WISE PRODUCT BUNDLE AND PRICE, 2023–2025 (USD MILLION)


TABLE 41
DETECTOR/IDCA FAMILIES SPECIFICATIONS


TABLE 42
CRYOGENIC COOLERS SPECIFICATIONS


TABLE 43
IR LENS ASSEMBLIES SPECIFICATIONS


TABLE 44
EO/IR COMPONENT PRICING BREAKDOWN, 2023–2025 (USD THOUSAND)


TABLE 45
INDIA PRICING BENCHMARK FOR MULTI-SENSOR EO/IR SIGHTS


TABLE 46
INDIA PROGRAM PRICING SUMMARY


TABLE 47
SOUTHEAST ASIAN MILITARY EO/IR SYSTEMS MARKET, BY COUNTRY, 2020–2024 (USD MILLION)


TABLE 48
SOUTHEAST ASIAN MILITARY EO/IR SYSTEMS MARKET, BY COUNTRY, 2025–2030 (USD MILLION)


TABLE 49
SOUTHEAST ASIAN MILITARY EO/IR SYSTEMS MARKET, BY END USER, 2020–2024 (USD MILLION)


TABLE 50
SOUTHEAST ASIAN MILITARY EO/IR SYSTEMS MARKET, BY END USER, 2025–2030 (USD MILLION)


TABLE 51
SINGAPORE MILITARY EO/IR SYSTEMS MARKET, BY END USER, 2020–2024 (USD MILLION)


TABLE 52
SINGAPORE MILITARY EO/IR SYSTEMS MARKET, BY END USER, 2025–2030 (USD MILLION)


TABLE 53
INDONESIAN MILITARY EO/IR SYSTEMS MARKET, BY END USER, 2020–2024 (USD MILLION)


TABLE 54
INDONESIAN MILITARY EO/IR SYSTEMS MARKET, BY END USER, 2025–2030 (USD MILLION)


TABLE 55
PHILIPPINES MILITARY EO/IR SYSTEMS MARKET, BY END USER, 2020–2024 (USD MILLION)


TABLE 56
PHILIPPINES MILITARY EO/IR SYSTEMS MARKET, BY END USER, 2025–2030 (USD MILLION)


TABLE 57
VIETNAM MILITARY EO/IR SYSTEMS MARKET, BY END USER, 2020–2024 (USD MILLION)


TABLE 58
VIETNAM MILITARY EO/IR SYSTEMS MARKET, BY END USER, 2025–2030 (USD MILLION)


TABLE 59
MALAYSIA MILITARY EO/IR SYSTEMS MARKET, BY END USER, 2020–2024 (USD MILLION)


TABLE 60
MALAYSIA MILITARY EO/IR SYSTEMS MARKET, BY END USER, 2025–2030 (USD MILLION)


TABLE 61
THAILAND MILITARY EO/IR SYSTEMS MARKET, BY END USER, 2020–2024 (USD MILLION)


TABLE 62
THAILAND MILITARY EO/IR SYSTEMS MARKET, BY END USER, 2025–2030 (USD MILLION)


TABLE 63
DEVELOPMENTS IN AIRBORNE EO/IR SURVEILLANCE SYSTEMS, SAR, AND EO/IR FUSION


TABLE 64
DEVELOPMENTS IN DECK-MOUNTED TURRETS/MASTS, FIRE CONTROL, AND NAVAL COMBAT


TABLE 65
DEVELOPMENTS IN COMBAT VEHICLE AND DISMOUNTED SOLDIER EO/IR


TABLE 66
DEVELOPMENTS IN EARTH OBSERVATION/IR SENSING


TABLE 67
AIR/SEA PLATFORMS INDIRECTLY DRIVING EO/IR DEMAND (NEW AWARDS)


TABLE 68
MILITARY EO/IR SYSTEMS MARKET, BY COOLING TECHNOLOGY, 2021–2025 (USD MILLION)


TABLE 69
MILITARY EO/IR SYSTEMS MARKET, BY COOLING TECHNOLOGY, 2026–2030 (USD MILLION)


TABLE 70
IMPLICATIONS FOR OEM STRATEGY, COMPONENT PARTNERSHIPS, AND LOCALIZATION


TABLE 71
TECHNOLOGY-LINKED OPPORTUNITY MAPPING FOR COOLING SYSTEMS


TABLE 72
TECHNOLOGY-LINKED OPPORTUNITY MAPPING FOR UNCOOLED SYSTEMS


TABLE 73
MILITARY EO/IR SYSTEMS MARKET, BY SENSING TECHNOLOGY, 2021–2025 (USD MILLION)


TABLE 74
MILITARY EO/IR SYSTEMS MARKET, BY SENSING TECHNOLOGY, 2026–2030 (USD MILLION)


TABLE 75
IMPLICATIONS FOR COMPONENT STRATEGY AND SUPPLY POSITIONING


TABLE 76
MILITARY EO/IR SYSTEMS MARKET, BY IMAGING TECHNOLOGY, 2021–2025 (USD MILLION)


TABLE 77
MILITARY EO/IR SYSTEMS MARKET, BY IMAGING TECHNOLOGY, 2026–2030 (USD MILLION)


TABLE 78
INVESTMENT PRIORITY MATRIX (2026–2030)


TABLE 79
IMAGING TECHNOLOGY COMPONENT SUPPLY CHAIN GAPS


TABLE 80
PROGRAM WATCHLIST AND POTENTIAL ENTRY ROUTES


TABLE 81
MILITARY EO/IR SYSTEMS MARKET, BY COMPONENT, 2021–2025 (USD MILLION)


TABLE 82
PROGRAM FITMENT AND ESTIMATED VOLUME SNAPSHOT


TABLE 83
COMPONENT-WISE GROWTH AND INVESTMENT ATTRACTIVENESS


TABLE 84
MILITARY EO/IR SYSTEMS MARKET, BY COMPONENT, 2026–2030 (USD MILLION)


TABLE 85
COMPONENT LOCALIZATION FEASIBILITY MATRIX


TABLE 86
STRATEGIC RECOMMENDATIONS FOR MILITARY EO/IR MANUFACTURERS AND SYSTEM INTEGRATORS


TABLE 87
MILITARY EO/IR SYSTEMS MARKET, BY POINT OF SALE, 2021–2025 (USD MILLION)


TABLE 88
MILITARY EO/IR SYSTEMS MARKET, BY POINT OF SALE, 2026–2030 (USD MILLION)


TABLE 89
PLATFORM TIMELINES AND INTEGRATION ROLES


TABLE 90
VERIFIED COMPONENT ROLES AND LOCALIZATION GAPS


TABLE 91
STRATEGIC LEVERS AND RECOMMENDATIONS


TABLE 92
AFTERMARKET SERVICE TYPES AND GROWTH OPPORTUNITIES


TABLE 93
PROGRAM TIMELINE AND SCOPE FOR AFTERMARKET


TABLE 94
INFRASTRUCTURE GAPS AND LOCALIZATION READINESS BY AFTERMARKET FUNCTION


TABLE 95
STRATEGIC PRIORITIES ROADMAP IN AFTERMARKET


TABLE 96
MILITARY EO/IR SYSTEMS MARKET, BY PRODUCT TYPE, 2021–2025 (USD MILLION)


TABLE 97
MILITARY EO/IR SYSTEMS MARKET, BY PRODUCT TYPE, 2026–2030 (USD MILLION)


TABLE 98
HANDHELD MILITARY EO/IR SYSTEMS MARKET, BY TYPE, 2021–2025 (USD MILLION)


TABLE 99
HANDHELD MILITARY EO/IR SYSTEMS MARKET, BY TYPE, 2025–2030 (USD MILLION)


TABLE 100
EO/IR PAYLOADS MARKET, BY TYPE, 2021–2025 (USD MILLION)


TABLE 101
EO/IR PAYLOADS MARKET, BY TYPE, 2026–2030 (USD MILLION)


TABLE 102
STRATEGIC SUMMARY – EO/IR PAYLOADS


TABLE 103
REFERENCE SYSTEM – COMBAT VEHICLE EO/IR PAYLOADS


TABLE 104
COMBAT VEHICLE EO/IR PAYLOADS MARKET, BY TYPE, 2021–2025 (USD MILLION)


TABLE 105
COMBAT VEHICLE EO/IR PAYLOADS MARKET, BY TYPE, 2026–2030 (USD MILLION)


TABLE 106
REFERENCE SYSTEM – AIRBORNE EO/IR PAYLOADS


TABLE 107
AIRBORNE EO/IR PAYLOAD STRATEGIC SHIFTS


TABLE 108
AIRBORNE EO/IR PAYLOADS MARKET, BY TYPE, 2021–2025 (USD MILLION)


TABLE 109
AIRBORNE EO/IR PAYLOADS MARKET, BY TYPE, 2026–2030 (USD MILLION)


TABLE 110
OEM/COMPONENT-LEVEL STRATEGY IMPLICATIONS FOR AIRBORNE EO/IR PAYLOADS


TABLE 111
REFERENCE SYSTEM – MARITIME EO/IR PAYLOADS


TABLE 112
MARITIME EO/IR PAYLOADS MARKET, BY TYPE, 2021–2025 (USD MILLION)


TABLE 113
MARITIME EO/IR PAYLOADS MARKET, BY TYPE, 2026–2030 (USD MILLION)


TABLE 114
STRATEGIC TAKEAWAYS FOR MARITIME EO/IR PAYLOADS


TABLE 115
REFERENCE SYSTEM – SPACE EO/IR PAYLOADS


TABLE 116
SPACE EO/IR PAYLOADS MARKET, BY TYPE, 2021–2025 (USD MILLION)


TABLE 117
SPACE EO/IR PAYLOADS MARKET, BY TYPE, 2026–2030 (USD MILLION)


TABLE 118
SPACE EO/IR PAYLOAD-WISE GROWTH DRIVERS


TABLE 119
MILITARY EO/IR SYSTEMS MARKET, BY PLATFORM, 2021–2025 (USD MILLION)


TABLE 120
MILITARY EO/IR SYSTEMS MARKET, BY PLATFORM, 2026–2030 (USD MILLION)


TABLE 121
LAND MILITARY EO/IR SYSTEMS MARKET, BY PLATFORM, 2021–2025 (USD MILLION)


TABLE 122
LAND MILITARY EO/IR SYSTEMS MARKET, BY PLATFORM, 2026–2030 (USD MILLION)


TABLE 123
VEHICLE-MOUNTED MILITARY EO/IR SYSTEMS MARKET, BY PLATFORM, 2021–2025 (USD MILLION)


TABLE 124
VEHICLE-MOUNTED MILITARY EO/IR SYSTEMS MARKET, BY PLATFORM, 2026–2030 (USD MILLION)


TABLE 125
STRATEGIC RECOMMENDATIONS FOR MILITARY EO/IR MANUFACTURERS AND SYSTEM INTEGRATORS FOR LAND EO/IR PENETRATION


TABLE 126
AIRBORNE MILITARY EO/IR SYSTEMS MARKET, BY PLATFORM, 2021–2025 (USD MILLION)


TABLE 127
AIRBORNE MILITARY EO/IR SYSTEMS MARKET, BY PLATFORM, 2026–2030 (USD MILLION)


TABLE 128
MILITARY AIRCRAFT EO/IR SYSTEMS MARKET, BY PLATFORM, 2021–2025 (USD MILLION)


TABLE 129
MILITARY AIRCRAFT EO/IR SYSTEMS MARKET, BY PLATFORM, 2026–2030 (USD MILLION)


TABLE 130
NAVAL MILITARY EO/IR SYSTEMS MARKET, BY PLATFORM, 2021–2025 (USD MILLION)


TABLE 131
NAVAL MILITARY EO/IR SYSTEMS MARKET, BY PLATFORM, 2025–2030 (USD MILLION)


TABLE 132
SURFACE COMBATANTS EO/IR SYSTEMS MARKET, BY PLATFORM, 2021–2025 (USD MILLION)


TABLE 133
SURFACE COMBATANTS EO/IR SYSTEMS MARKET, BY PLATFORM, 2026–2030 (USD MILLION)


TABLE 134
TACTICAL GUIDANCE FOR MILITARY EO/IR MANUFACTURERS AND SYSTEM INTEGRATORS FOR MARITIME EO/IR PENETRATION


TABLE 135
RISKS AND SENSITIVITY CHECKS


TABLE 136
SPACE MILITARY EO/IR SYSTEMS MARKET, BY PLATFORM, 2021–2025 (USD MILLION)


TABLE 137
SPACE MILITARY EO/IR SYSTEMS MARKET, BY PLATFORM, 2026–2030 (USD MILLION)


TABLE 138
STRATEGIC RECOMMENDATIONS FOR MILITARY EO/IR MANUFACTURERS AND SYSTEM INTEGRATORS FOR SPACE EO/IR PENETRATION


TABLE 139
RISKS AND MITIGATION


TABLE 140
MARKET SHARE OF KEY PLAYERS, 2025 (%)


TABLE 141
SEGMENT-WISE COMPETITIVE MAPPING


TABLE 142
PRODUCT FOOTPRINT


TABLE 143
PLATFORM FOOTPRINT


TABLE 144
IMAGING TECHNOLOGY FOOTPRINT


TABLE 145
COOLING TECHNOLOGY FOOTPRINT


TABLE 146
LIST OF STARTUPS/SMES


TABLE 147
ELBIT SYSTEMS LTD.: COMPANY OVERVIEW


TABLE 148
ELBIT SYSTEMS LTD.: PRODUCTS OFFERED


TABLE 149
ELBIT SYSTEMS LTD.: PRODUCT LAUNCHES


TABLE 150
ELBIT SYSTEMS LTD.: DEALS


TABLE 151
ELBIT SYSTEMS LTD.: OTHER DEVELOPMENTS


TABLE 152
TONBO IMAGING: COMPANY OVERVIEW


TABLE 153
TONBO IMAGING: PRODUCTS OFFERED


TABLE 154
TONBO IMAGING.: PRODUCT LAUNCHES


TABLE 155
TONBO IMAGING: DEALS


TABLE 156
TONBO IMAGING: OTHER DEVELOPMENTS


TABLE 157
RAFAEL ADVANCED DEFENSE SYSTEMS LTD.: COMPANY OVERVIEW


TABLE 158
RAFAEL ADVANCED DEFENSE SYSTEMS LTD.: PRODUCTS OFFERED


TABLE 159
RAFAEL ADVANCED DEFENSE SYSTEMS LTD.: PRODUCT LAUNCHES


TABLE 160
RAFAEL ADVANCED DEFENSE SYSTEMS LTD.: DEALS


TABLE 161
RAFAEL ADVANCED DEFENSE SYSTEMS LTD.: OTHER DEVELOPMENTS


TABLE 162
SAFRAN: COMPANY OVERVIEW


TABLE 163
SAFRAN: PRODUCTS OFFERED


TABLE 164
SAFRAN: PRODUCT LAUNCHES


TABLE 165
SAFRAN: DEALS


TABLE 166
SAFRAN: OTHER DEVELOPMENTS


TABLE 167
TELEDYNE FLIR LLC: COMPANY OVERVIEW


TABLE 168
TELEDYNE FLIR LLC: PRODUCTS OFFERED


TABLE 169
TELEDYNE FLIR LLC: PRODUCT LAUNCHES


TABLE 170
TELEDYNE FLIR LLC: DEALS


TABLE 171
TELEDYNE FLIR LLC: OTHER DEVELOPMENTS


TABLE 172
HENSOLDT AG: COMPANY OVERVIEW


TABLE 173
HENSOLDT AG: PRODUCTS OFFERED


TABLE 174
HENSOLDT AG: PRODUCT LAUNCHES


TABLE 175
HENSOLDT AG: DEALS


TABLE 176
HENSOLDT AG: OTHER DEVELOPMENTS


TABLE 177
ALPHA DESIGN TECHNOLOGIES PRIVATE LIMITED: COMPANY OVERVIEW


TABLE 178
ALPHA DESIGN TECHNOLOGIES PRIVATE LIMITED: PRODUCTS OFFERED


TABLE 179
ALPHA DESIGN TECHNOLOGIES PRIVATE LIMITED: DEALS


TABLE 180
ALPHA DESIGN TECHNOLOGIES PRIVATE LIMITED: OTHER DEVELOPMENTS


TABLE 181
TATA ADVANCED SYSTEMS LIMITED: COMPANY OVERVIEW


TABLE 182
TATA ADVANCED SYSTEMS LIMITED: PRODUCTS OFFERED


TABLE 183
TATA ADVANCED SYSTEMS LIMITED: PRODUCT LAUNCHES


TABLE 184
TATA ADVANCED SYSTEMS LIMITED: DEALS


TABLE 185
TATA ADVANCED SYSTEMS LIMITED: OTHER DEVELOPMENTS


TABLE 186
MKU LIMITED: COMPANY OVERVIEW


TABLE 187
MKU LIMITED: PRODUCTS OFFERED


TABLE 188
MKU LIMITED: PRODUCT LAUNCHES


TABLE 189
MKU LIMITED: DEALS


TABLE 190
MKU LIMITED: OTHER DEVELOPMENTS


TABLE 191
BHARAT ELECTRONICS LIMITED: COMPANY OVERVIEW


TABLE 192
BHARAT ELECTRONICS LIMITED: PRODUCTS OFFERED


TABLE 193
BHARAT ELECTRONICS LIMITED: PRODUCT LAUNCHES


TABLE 194
BHARAT ELECTRONICS LIMITED: DEALS


TABLE 195
BHARAT ELECTRONICS LIMITED: OTHER DEVELOPMENTS


TABLE 196
THALES: COMPANY OVERVIEW


TABLE 197
THALES: PRODUCTS OFFERED


TABLE 198
THALES: DEALS


TABLE 199
THALES: OTHER DEVELOPMENTS


TABLE 200
L3HARRIS TECHNOLOGIES, INC.: COMPANY OVERVIEW


TABLE 201
L3HARRIS TECHNOLOGIES, INC.: PRODUCTS OFFERED


TABLE 202
L3HARRIS TECHNOLOGIES, INC.: PRODUCT LAUNCHES


TABLE 203
L3HARRIS TECHNOLOGIES, INC.: DEALS


TABLE 204
L3HARRIS TECHNOLOGIES, INC.: OTHER DEVELOPMENTS


TABLE 205
OPTIMIZED ELECTROTECH: COMPANY OVERVIEW


TABLE 206
OPTIMIZED ELECTROTECH: PRODUCTS OFFERED


TABLE 207
OPTIMIZED ELECTROTECH: PRODUCT LAUNCHES


TABLE 208
OPTIMIZED ELECTROTECH: DEALS


TABLE 209
OPTIMIZED ELECTROTECH: OTHER DEVELOPMENTS


TABLE 210
LOCKHEED MARTIN CORPORATION: COMPANY OVERVIEW


TABLE 211
LOCKHEED MARTIN CORPORATION: PRODUCTS OFFERED


TABLE 212
LOCKHEED MARTIN CORPORATION: PRODUCT LAUNCHES


TABLE 213
LOCKHEED MARTIN CORPORATION: OTHER DEVELOPMENTS


TABLE 214
PARAS DEFENCE & SPACE TECHNOLOGIES LIMITED: COMPANY OVERVIEW


TABLE 215
PARAS DEFENCE & SPACE TECHNOLOGIES LIMITED: PRODUCTS OFFERED


TABLE 216
PARAS DEFENCE & SPACE TECHNOLOGIES LIMITED: DEALS


TABLE 217
PARAS DEFENCE & SPACE TECHNOLOGIES LIMITED: OTHER DEVELOPMENTS


TABLE 218
RTX: COMPANY OVERVIEW


TABLE 219
RTX: PRODUCTS OFFERED


TABLE 220
RTX: PRODUCT LAUNCHES


TABLE 221
RTX: DEALS


TABLE 222
RTX: OTHER DEVELOPMENTS


TABLE 223
INDIA OPTEL LIMITED: FINANCIAL OVERVIEW


TABLE 224
INDIA OPTEL LIMITED: COMPANY OVERVIEW


TABLE 225
INDIA OPTEL LIMITED: PRODUCTS OFFERED


TABLE 226
INDIA OPTEL LIMITED: DEALS


TABLE 227
INDIA OPTEL LIMITED: OTHER DEVELOPMENTS


TABLE 228
ANALINEAR: FINANCIAL OVERVIEW


TABLE 229
ANALINEAR: COMPANY OVERVIEW


TABLE 230
ANALINEAR: PRODUCTS OFFERED


TABLE 231
ANALINEAR: OTHER DEVELOPMENTS


TABLE 232
OZAK TECHNOLOGIES PRIVATE LIMITED: FINANCIAL OVERVIEW


TABLE 233
OZAK TECHNOLOGIES PRIVATE LIMITED: COMPANY OVERVIEW


TABLE 234
OZAK TECHNOLOGIES PRIVATE LIMITED: PRODUCTS OFFERED


TABLE 235
HFCL: FINANCIAL OVERVIEW


TABLE 236
HFCL: COMPANY OVERVIEW


TABLE 237
HFCL: PRODUCTS OFFERED


TABLE 238
HFCL: DEALS


TABLE 239
HFCL: OTHER DEVELOPMENTS


TABLE 240
MEDBIT TECHNOLOGIES PRIVATE LIMITED: FINANCIAL OVERVIEW


TABLE 241
MEDBIT TECHNOLOGIES PRIVATE LIMITED: COMPANY OVERVIEW


TABLE 242
MEDBIT TECHNOLOGIES PRIVATE LIMITED: PRODUCTS OFFERED


TABLE 243
MEDBIT TECHNOLOGIES PRIVATE LIMITED: OTHER DEVELOPMENTS


TABLE 244
VEM TECHNOLOGIES PVT. LTD: FINANCIAL OVERVIEW


TABLE 245
VEM TECHNOLOGIES PVT. LTD: COMPANY OVERVIEW


TABLE 246
VEM TECHNOLOGIES PVT. LTD: PRODUCTS OFFERED


TABLE 247
VEM TECHNOLOGIES PVT. LTD: PRODUCT LAUNCHES


TABLE 248
VEM TECHNOLOGIES PVT. LTD: DEALS


TABLE 249
VEM TECHNOLOGIES PVT. LTD: OTHER DEVELOPMENTS


TABLE 250
DELOPT: FINANCIAL OVERVIEW


TABLE 251
DELOPT: COMPANY OVERVIEW


TABLE 252
DELOPT: PRODUCTS OFFERED


TABLE 253
DELOPT: DEALS


TABLE 254
DELOPT: OTHER DEVELOPMENTS


TABLE 255
ICOMM TELE LIMITED: FINANCIAL OVERVIEW


TABLE 256
ICOMM TELE LIMITED: COMPANY OVERVIEW


TABLE 257
ICOMM TELE LIMITED: PRODUCTS OFFERED


TABLE 258
THE HYPERSTEALTH: FINANCIAL OVERVIEW


TABLE 259
THE HYPERSTEALTH: COMPANY OVERVIEW


TABLE 260
THE HYPERSTEALTH: PRODUCTS OFFERED


LIST OF FIGURES


FIGURE 1
GROWTH IN AGNIPATH ALLOCATIONS, 2022–2026


FIGURE 2
INDIA’S CAPITAL ACQUISITION (MODERNIZATION) BUDGET, 2016–2025


FIGURE 3
SERVICE-WISE MODERNIZATION ALLOCATION


FIGURE 4
MOD CAPITAL PROCUREMENT (FY 2024–2025)


FIGURE 5
FDI-TO-CAPABILITY LEVERAGE CURVE


FIGURE 6
EO/IR IMPACT VS. GEOPOLITICAL SEVERITY


FIGURE 7
TIMELINE OF GEOPOLITICAL TRIGGERS, 2020–2025


FIGURE 8
MACRO- AND MICRO-LEVEL INFLUENCE OF EO/IR ACROSS DOMAINS


FIGURE 9
GLOBAL EO/IR SUBSYSTEM DEPENDENCY, BY REGION, 2021 VS. 2025


FIGURE 10
EO/IR SUBSYSTEM ECOSYSTEM: TRL LEVELS AND OWNERSHIP


FIGURE 11
IMPORT DEPENDENCE SHIFT FOR EO/IR SUBSYSTEM


FIGURE 12
INDIGENOUS CAPABILITY READINESS HEATMAP


FIGURE 1
INDIA MILITARY EO/IR SUBSYSTEM LOCALIZATION HEATMAP


FIGURE 2
EO/IR SUBSYSTEMS VS. OPTIMAL DAP 2020 PROCUREMENT CATEGORY


FIGURE 3
EO/IR SUBSYSTEM LOCALIZATION ROADMAP, 2023–2027


FIGURE 4
EO/IR SUBSYSTEM LOCALIZATION LEVERS


FIGURE 5
INDIA MILITARY EO/IR SYSTEMS MARKET DYNAMICS


FIGURE 6
R&D FOCUS HEATMAP, BY EO/IR FUNCTION, 2025


FIGURE 7
EO/IR INTEGRATION INTENSITY, BY PROGRAM


FIGURE 8
FACTORS IMPACTING INDIA MILITARY EO/IR SYSTEMS MARKET


FIGURE 9
INTRODUCTION OF TECHNOLOGY IN MILITARY APPLICATIONS, 1960–2020


FIGURE 10
TECHNOLOGICAL TRENDS IN MILITARY EO/IR SYSTEMS MARKET


FIGURE 11
VALUE CHAIN ANALYSIS


FIGURE 12
PORTER'S FIVE FORCES ANALYSIS


FIGURE 13
COUNTRY PRIORITIZATION HEATMAP BASED ON MACRO-INDICATORS


FIGURE 14
COUNTRY PRIORITIZATION HEATMAP BASED ON MARKET ATTRACTIVENESS


FIGURE 15
SOUTHEAST ASIA MILITARY EO/IR SYSTEMS MARKET PENETRATION, BY COUNTRY, 2020–2030 (USD MILLION)


FIGURE 16
SOUTHEAST ASIA MILITARY EO/IR SYSTEMS MARKET PENETRATION, BY END USER, 2020–2030 (USD MILLION)


FIGURE 17
SINGAPORE END USER MARKET PENETRATION, 2020–2030 (USD MILLION)


FIGURE 18
INDONESIA END USER MARKET PENETRATION, 2020–2030 (USD MILLION)


FIGURE 19
PHILIPPINES END USER MARKET PENETRATION, 2020–2030 (USD MILLION)


FIGURE 20
VIETNAM END USER MARKET PENETRATION, 2020–2030 (USD MILLION)


FIGURE 21
MALAYSIAN END USER MARKET PENETRATION, 2020–2030 (USD MILLION)


FIGURE 22
THAILAND END USER MARKET PENETRATION, 2020–2030 (USD MILLION)


FIGURE 23
EO/IR OPPORTUNITY HEATMAP FOR KEY COUNTRIES


FIGURE 24
EO/IR-LINKED MODERNIZATION PROGRAMS TIMELINE, 2024–2030


FIGURE 25
STRATEGIC PARAMETERS FOR EO/IR OPPORTUNITY IN SEA


FIGURE 26
STRATEGIC 2X2 OPPORTUNITY MATRIX


FIGURE 27
COOLED AND UNCOOLED TECHNOLOGY MARKET PENETRATION, 2026–2030 (USD MILLION)


FIGURE 28
STARING AND SCANNING SENSING TECHNOLOGY MARKET PENETRATION, 2026–2030 (USD MILLION)


FIGURE 29
STARING AND SCANNING SENSING TECHNOLOGY GROWTH POTENTIAL, 2026–2030 (%)


FIGURE 30
MULTISPECTRAL AND HYPERSPECTRAL IMAGING TECHNOLOGY MARKET PENETRATION, 2021–2030 (USD MILLION)


FIGURE 31
MULTISPECTRAL AND HYPERSPECTRAL IMAGING TECHNOLOGY GROWTH POTENTIAL, 2026–2030 (%)


FIGURE 32
INDIA MILITARY EO/IR SYSTEMS MARKET PENETRATION, BY COMPONENT, 2021–2030 (USD MILLION)


FIGURE 33
INDIA MILITARY EO/IR COMPONENT GROWTH POTENTIAL, 2026–2030 (%)


FIGURE 34
OEM AND AFTERMARKET PENETRATION, 2021–2030 (USD MILLION)


FIGURE 35
OEM AND AFTERMARKET SHARE TRENDLINE, 2021–2030 (%)


FIGURE 36
HANDHELD SYSTEM AND EO/IR PAYLOAD MARKET PENETRATION, 2021–2030 (USD MILLION)


FIGURE 37
HANDHELD SYSTEM AND EO/IR PAYLOAD Y-O-Y GROWTH TRENDLINE, 2021–2030 (%)


FIGURE 38
HANDHELD SYSTEMS MARKET SHARE COMPARISON, 2026 VS. 2030 (%)


FIGURE 39
EO/IR PAYLOADS MARKET PENETRATION, BY PRODUCT TYPE, 2021–2030 (USD MILLION)


FIGURE 40
EO/IR PAYLOAD GROWTH POTENTIAL, BY PRODUCT TYPE, 2026–2030 (%)


FIGURE 41
COMBAT VEHICLE EO/IR PAYLOADS MARKET SHARE COMPARISON, 2026 VS. 2030 (%)


FIGURE 42
AIRBORNE EO/IR PAYLOADS MARKET SHARE COMPARISON, 2026 VS. 2030 (%)


FIGURE 43
MARITIME EO/IR PAYLOADS MARKET SHARE COMPARISON, 2026 VS. 2030 (%)


FIGURE 44
SPACE EO/IR PAYLOADS MARKET SHARE COMPARISON, 2026 VS. 2030 (%)


FIGURE 45
PLATFORM-LEVEL MILITARY EO/IR SYSTEMS MARKET SHARE TRAJECTORY, 2021–2030 (%)


FIGURE 46
LAND MILITARY EO/IR MARKET SHARE COMPARISON, 2026 VS. 2030 (%)


FIGURE 47
COMBAT VEHICLES VS UNMANNED GROUND VEHICLES MILITARY EO/IR MARKET SHARE COMPARISON 2021-2030 (%)


FIGURE 48
AIRBORNE MILITARY EO/IR MARKET SHARE COMPARISON, 2026 VS. 2030 (%)


FIGURE 49
MILITARY AIRCRAFT EO/IR MARKET PENETRATION, 2021–2030 (USD MILLION)


FIGURE 50
NAVAL MILITARY EO/IR MARKET SHARE COMPARISON, 2026 VS. 2030 (%)


FIGURE 51
SURFACE COMBATANTS EO/IR MARKET PENETRATION, 2021–2030 (USD MILLION)


FIGURE 52
SPACE MILITARY EO/IR MARKET SHARE COMPARISON, 2026 VS. 2030 (%)


FIGURE 53
MARKET SHARE ANALYSIS OF KEY PLAYERS, 2025 (%)


FIGURE 54
BHARAT ELECTRONICS LIMITED: SWOT ANALYSIS


FIGURE 55
TATA ADVANCED SYSTEMS LIMITED: SWOT ANALYSIS


FIGURE 56
PARAS DEFENCE & SPACE TECHNOLOGIES: SWOT ANALYSIS


FIGURE 57
LOCKHEED MARTIN CORPORATION: SWOT ANALYSIS


FIGURE 58
TELEDYNE TECHNOLOGIES INCORPORATED: SWOT ANALYSIS


FIGURE 59
RTX: SWOT ANALYSIS


FIGURE 60
ISRAEL AEROSPACE INDUSTRIES: SWOT ANALYSIS


FIGURE 61
L3HARRIS TECHNOLOGIES, INC.: SWOT ANALYSIS


FIGURE 62
ELBIT SYSTEMS LTD.: SWOT ANALYSIS


FIGURE 63
BAE SYSTEMS: SWOT ANALYSIS


FIGURE 64
ALPHA DESIGN TECHNOLOGIES: SWOT ANALYSIS


FIGURE 65
RAFAEL ADVANCED DEFENSE SYSTEMS LTD.: SWOT ANALYSIS


FIGURE 66
NORTHROP GRUMMAN: SWOT ANALYSIS


FIGURE 67
SAFRAN: SWOT ANALYSIS


FIGURE 68
THALES (VIA BEL/SAMTEL JV CHANNEL): SWOT ANALYSIS


FIGURE 69
GENERAL DYNAMICS CORPORATION: SWOT ANALYSIS


FIGURE 70
MKU LIMITED: SWOT ANALYSIS


FIGURE 71
RHEINMETALL AG: SWOT ANALYSIS


FIGURE 72
HENSOLDT AG: SWOT ANALYSIS


FIGURE 73
MILITARY EO/IR MANUFACTURERS AND SYSTEM INTEGRATORS SWOT ANALYSIS


FIGURE 74
INDIA OPTEL LIMITED: SWOT ANALYSIS


FIGURE 75
ANALINEAR: SWOT ANALYSIS


FIGURE 76
HFCL: SWOT ANALYSIS


FIGURE 77
MEDBIT TECHNOLOGIES PRIVATE LIMITED: SWOT ANALYSIS


FIGURE 78
VEM TECHNOLOGIES PVT. LTD: SWOT ANALYSIS


FIGURE 79
DELOPT: SWOT ANALYSIS


FIGURE 80
ICOMM TELE LIMITED: SWOT ANALYSIS


FIGURE 81
THE HYPERSTEALTH: SWOT ANALYSIS


FIGURE 82
OZAK TECHNOLOGIES PRIVATE LIMITED: SWOT ANALYSIS


FIGURE 83
EO/IR STRATEGIC AND TECHNICAL EVALUATION: COMPANY COMPARISON TABLE


FIGURE 84
EO/IR COMPANY HEATMAP: TRL VS. PLATFORM TYPE


FIGURE 85
COMPANY EVALUATION MATRIX (KEY PLAYERS), 2025


FIGURE 86
COMPANY FOOTPRINT


FIGURE 87
COMPANY EVALUATION MATRIX (STARTUPS/SMES), 2025


FIGURE 88
ELBIT SYSTEMS LTD.: FINANCIAL OVERVIEW


FIGURE 89
RAFAEL ADVANCED DEFENSE SYSTEMS LTD. FINANCIAL OVERVIEW


FIGURE 90
SAFRAN: FINANCIAL OVERVIEW


FIGURE 91
HENSOLDT AG: FINANCIAL OVERVIEW


FIGURE 92
BHARAT ELECTRONICS LIMITED: FINANCIAL OVERVIEW


FIGURE 93
THALES: FINANCIAL OVERVIEW


FIGURE 94
L3HARRIS TECHNOLOGIES, INC.: FINANCIAL OVERVIEW


FIGURE 95
LOCKHEED MARTIN CORPORATION: FINANCIAL OVERVIEW


FIGURE 96
PARAS DEFENCE & SPACE TECHNOLOGIES LIMITED: FINANCIAL OVERVIEW


FIGURE 97
RTX: FINANCIAL OVERVIEW


FIGURE 98
HFCL: FINANCIAL OVERVIEW


FIGURE 99
REPORT PROCESS FLOW


FIGURE 100
STEP 1: INFORMATION PROCUREMENT


FIGURE 101
STEP 2: SECONDARY RESEARCH DESIGN


FIGURE 102
STEP 3: PRIMARY RESEARCH DESIGN


FIGURE 103
DATA TRIANGULATION


Methodology

The study involved four major activities to estimate the current size of the India military EO/IR market. Exhaustive secondary research was conducted to gather information on the India military EO/IR market, its adjacent markets, and its parent market. The next step was to validate these findings, assumptions, and sizing with industry experts across the value chain through primary research. Demand-side analysis was conducted to estimate the overall market size. Thereafter, data triangulation procedures were employed to estimate the sizes of various segments and subsegments within the India military EO/IR market.

Secondary Research

During the secondary research process, various sources were consulted to identify and collect information for this study. The secondary sources included government sources, such as SIPRI; corporate filings, including annual reports, press releases, and investor presentations; white papers, journals, and certified publications; and articles from recognized authors, directories, and databases.

Primary Research

Extensive primary research was conducted after acquiring information on the India military EO/IR market through secondary research. Several primary interviews were conducted with market experts from the demand and supply sides across major countries of North America, Europe, the Asia Pacific, and the Rest of the World (RoW). Primary data was collected through questionnaires, emails, and telephonic interviews.

India Military Electro Optics Infrared (EOIR) Systems Market 
 Size, and Share

To know about the assumptions considered for the study, download the pdf brochure

Market Size Estimation

Top-down and bottom-up approaches were used to estimate and validate the size of the India military EO/IR market. The research methodology used to estimate the size of the market included the following details:

  • Key players in the India military EO/IR market were identified through secondary research, and their market shares were determined through a combination of primary and secondary research. This included a study of the annual and financial reports of the top market players, as well as extensive interviews with leaders, including directors, engineers, marketing executives, and other key stakeholders of leading companies operating in the market.
  • All percentage shares, splits, and breakdowns were determined using secondary sources and verified through primary sources.
  • All possible parameters that affect the markets covered in this research study were accounted for, viewed in extensive detail, verified through primary research, and analyzed to obtain the final quantitative and qualitative data on the India military EO/IR market. This data was consolidated, enhanced with detailed inputs, analyzed by MarketsandMarkets, and presented in this report.

India Military Electro Optics Infrared (EOIR) Systems Market Top Down and Bottom Up Approach

Data Triangulation

After determining the overall market size, the total market was classified into several segments and subsegments. The data triangulation and market breakdown procedures explained below were implemented, wherever applicable, to complete the overall market engineering process and arrive at the estimated market numbers for the market segments and subsegments. The data was triangulated by examining various factors and trends on both the demand and supply sides. Additionally, the market size was validated using top-down and bottom-up approaches.

Market Definition

The India military EO/IR market refers to systems and components used by the armed forces for imaging, detection, tracking, and targeting using electro-optical and infrared technologies. It includes handheld systems such as thermal imagers, weapon sights, rangefinders, and designators, as well as EO/IR payloads used on combat vehicles, aircraft, UAVs, naval platforms, and space systems. The market covers key components such as sensors, optics, processors, control systems, stabilization units, and human-machine interfaces. It also includes both cooled and uncooled technologies, multispectral and hyperspectral imaging, and staring and scanning systems. The market includes systems supplied through OEM integration in new platforms and aftermarket upgrades, maintenance, and replacements across land, air, naval, and space operations.

Key Stakeholders

  • Government and procurement bodies
  • End users
  • R&D organizations
  • Manufacturers and OEMs
  • System integrators
  • Component suppliers
  • Service providers
  • Platform OEMs

Report Objectives

  • To define, describe, and forecast the India military EO/IR market based on product type, platform, component, point of sale, cooling technology, sensing technology, and imaging technology, in terms of value
  • To forecast the size of various segments of the market.
  • To identify and analyze the drivers, restraints, opportunities, and challenges influencing the growth of the market
  • To identify industry trends, market trends, and technology trends currently prevailing in the India military EO/IR market
  • To provide an overview of India’s strategic landscape with respect to India military EO/IR market.
  • To analyze micromarkets with respect to individual growth trends, prospects, and their contribution to the overall market
  • To analyze opportunities in the market for stakeholders by identifying key market trends
  • To profile key market players and comprehensively analyze their market share and core competencies
  • To evaluate the degree of competition in the market by analyzing recent developments, such as contracts, agreements, and acquisitions adopted by leading market players
  • To identify detailed financial positions, key products, and unique selling points of leading companies in the market
  • To provide a detailed competitive landscape of the market, along with market share analysis and revenue analysis of key players

Available customizations:

MarketsandMarkets offers the following customizations for this market report:

  • Profiling of other market players (up to 5)

Product Analysis

  • Product matrix, which provides a detailed comparison of the product portfolios of each company in the India military EO/IR market.


Personalize This Research

  • Triangulate with your Own Data
  • Get Data as per your Format and Definition
  • Gain a Deeper Dive on a Specific Application, Geography, Customer or Competitor
  • Any level of Personalization
Request A Free Customisation

Let Us Help You

  • What are the Known and Unknown Adjacencies Impacting the India Military EO/IR Market

  • What will your New Revenue Sources be?
  • Who will be your Top Customer; what will make them switch?
  • Defend your Market Share or Win Competitors
  • Get a Scorecard for Target Partners
Customized Workshop Request

Custom Market Research Services

We Will Customise The Research For You, In Case The Report Listed Above Does Not Meet With Your Requirements

Get 10% Free Customisation

TESTIMONIALS

Growth opportunities and latent adjacency in India Military EO/IR Market

DMCA.com Protection Status