TABLE OF CONTENTS
1 INTRODUCTION (Page No. - 23)
1.1 STUDY OBJECTIVES
1.2 COMPETITIVE INTELLIGENCE
1.3 MARKET DEFINITION
1.3.1 INCLUSIONS AND EXCLUSIONS
1.4 MARKET SCOPE
1.4.1 REGIONAL SCOPE
1.4.2 YEARS CONSIDERED
1.4.3 CURRENCY CONSIDERED
1.5 LIMITATIONS
1.6 STAKEHOLDERS
1.7 SUMMARY OF CHANGES
2 RESEARCH METHODOLOGY (Page No. - 28)
2.1 RESEARCH DATA
2.1.1 SECONDARY DATA
2.1.1.1 Key data from secondary sources
2.1.2 PRIMARY DATA
2.1.2.1 Key data from primary sources
2.1.2.2 Breakdown of primary interviews
2.2 MATRIX CONSIDERED FOR DEMAND-SIDE ANALYSIS
2.3 MARKET SIZE ESTIMATION
2.3.1 BOTTOM-UP APPROACH
2.3.2 TOP-DOWN APPROACH
2.3.2.1 Calculations for supply-side analysis
2.4 GROWTH RATE ASSUMPTIONS/GROWTH FORECAST
2.5 DATA TRIANGULATION
2.6 IMPACT OF RECESSION
2.7 KEY ASSUMPTIONS WHILE CALCULATING DEMAND- SIDE MARKET SIZE
2.8 RESEARCH LIMITATIONS
2.9 RISK ANALYSIS
3 EXECUTIVE SUMMARY (Page No. - 38)
4 PREMIUM INSIGHTS (Page No. - 41)
4.1 ATTRACTIVE OPPORTUNITIES FOR PLAYERS IN INDUSTRIAL BATTERIES MARKET
4.2 INDUSTRIAL BATTERIES MARKET, BY REGION
4.3 INDUSTRIAL BATTERIES MARKET, BY MAJOR COUNTRIES
5 MARKET OVERVIEW (Page No. - 43)
5.1 INTRODUCTION
5.2 MARKET DYNAMICS
5.2.1 DRIVERS
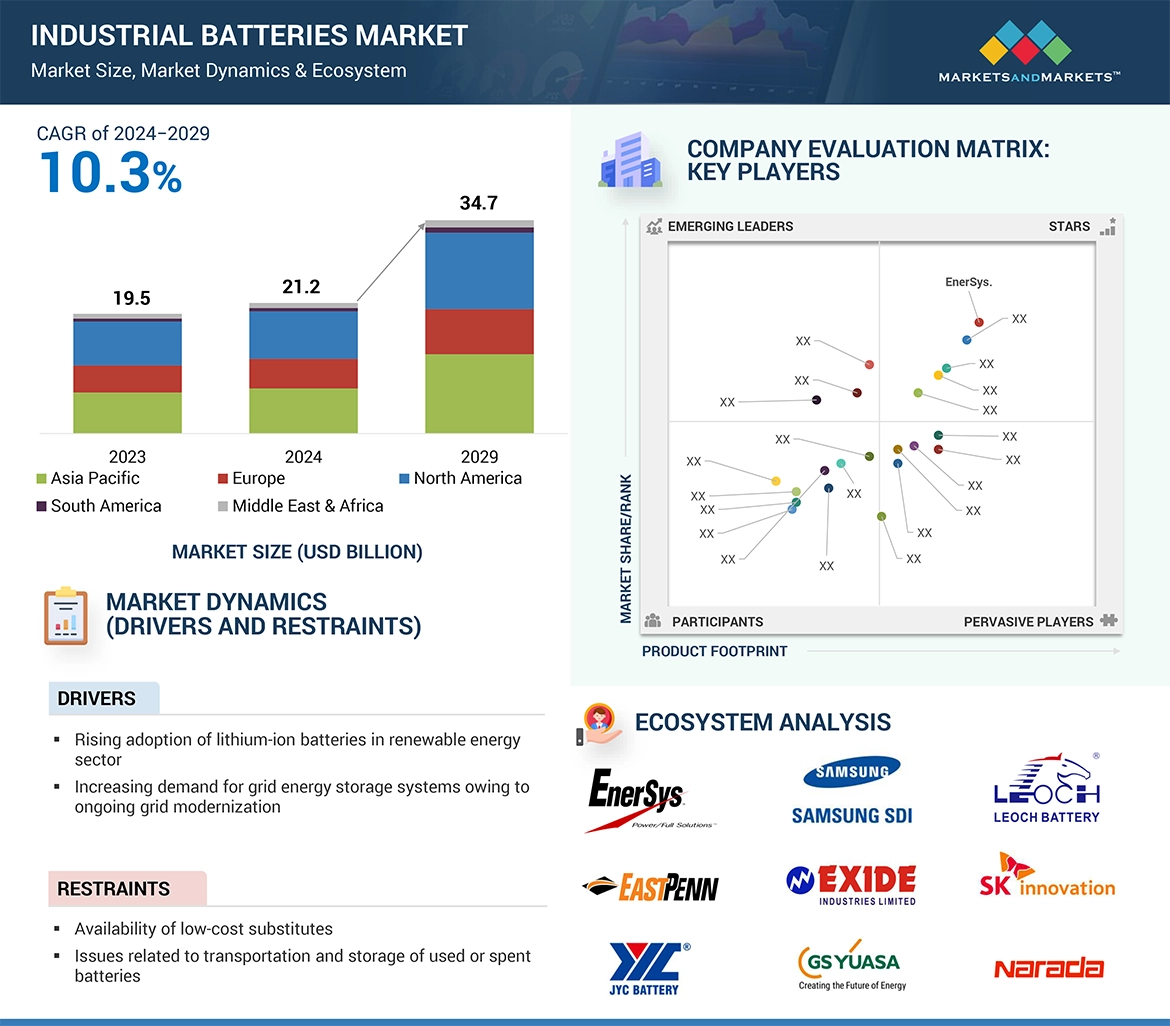
5.2.1.1 Rising adoption of lithium-ion batteries in renewable energy sector
5.2.1.2 Increasing demand for grid energy storage systems owing to ongoing grid modernization
5.2.2 RESTRAINTS
5.2.2.1 Availability of low-cost substitutes
5.2.2.2 Issues related to transportation and storage of used or spent batteries
5.2.3 OPPORTUNITIES
5.2.3.1 Advancements in telecommunications sector
5.2.3.2 Increasing battery innovation initiatives by established players
5.2.4 CHALLENGES
5.2.4.1 Limited usage and overheating
5.3 PORTER’S FIVE FORCES ANALYSIS
5.3.1 BARGAINING POWER OF SUPPLIERS
5.3.2 BARGAINING POWER OF BUYERS
5.3.3 THREAT OF NEW ENTRANTS
5.3.4 THREAT OF SUBSTITUTES
5.3.5 INTENSITY OF COMPETITIVE RIVALRY
6 INDUSTRY TRENDS (Page No. - 51)
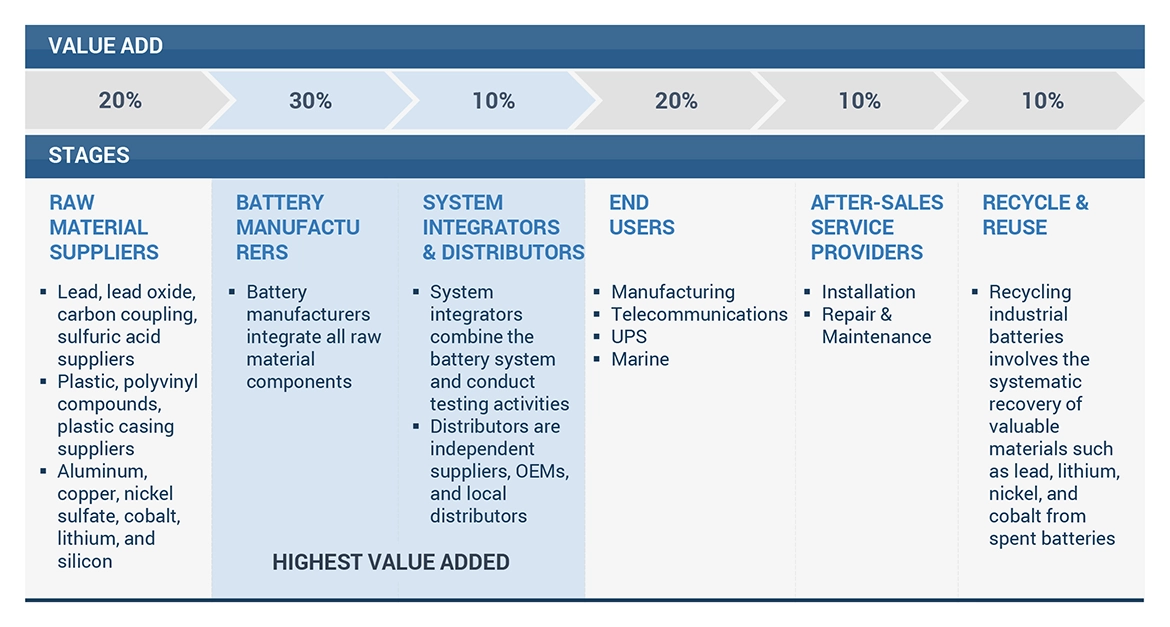
6.1 VALUE CHAIN ANALYSIS
6.2 ECOSYSTEM ANALYSIS
6.3 PRICING ANALYSIS
6.3.1 AVERAGE SELLING PRICE OF LITHIUM-ION BATTERIES, BY REGION
6.3.2 AVERAGE SELLING PRICE OF LITHIUM-ION BATTERIES, BY CHEMISTRY
6.4 TARIFF AND REGULATORY LANDSCAPE
6.4.1 REGULATORY BODIES, GOVERNMENT AGENCIES, AND OTHER ORGANIZATIONS
6.5 KEY CONFERENCES AND EVENTS
6.6 KEY STAKEHOLDERS AND BUYING CRITERIA
6.6.1 KEY STAKEHOLDERS IN BUYING PROCESS
6.6.2 BUYING CRITERIA
6.7 PATENT ANALYSIS
6.7.1 METHODOLOGY
6.7.2 MAJOR PATENTS
6.8 CASE STUDY ANALYSIS
6.8.1 GRID-CONNECTED LITHIUM-ION BATTERY ENERGY STORAGE SYSTEM BY NEXCHARGE AND TATA POWER DELHI DISTRIBUTION
6.8.2 DEPLOYMENT OF OFF-GRID BATTERY ENERGY STORAGE SYSTEMS FOR RENEWABLE ENERGY PROJECT
6.9 TECHNOLOGY ANALYSIS
6.9.1 KEY TECHNOLOGIES
6.9.1.1 Lithium metal battery
6.9.1.2 Sodium-sulfur batteries
6.9.1.3 Metal-air batteries
6.9.1.4 Liquid-metal batteries
6.9.2 ADJACENT TECHNOLOGIES
6.9.2.1 Modern off-grid technology
6.10 TRADE ANALYSIS
6.10.1 IMPORT DATA
6.10.2 EXPORT DATA
6.11 TRENDS/ DISRUPTIONS IMPACTING CUSTOMER BUSINESS
6.12 INVESTMENT AND FUNDING SCENARIO
7 INDUSTRIAL BATTERIES MARKET, BY BATTERY TYPE (Page No. - 68)
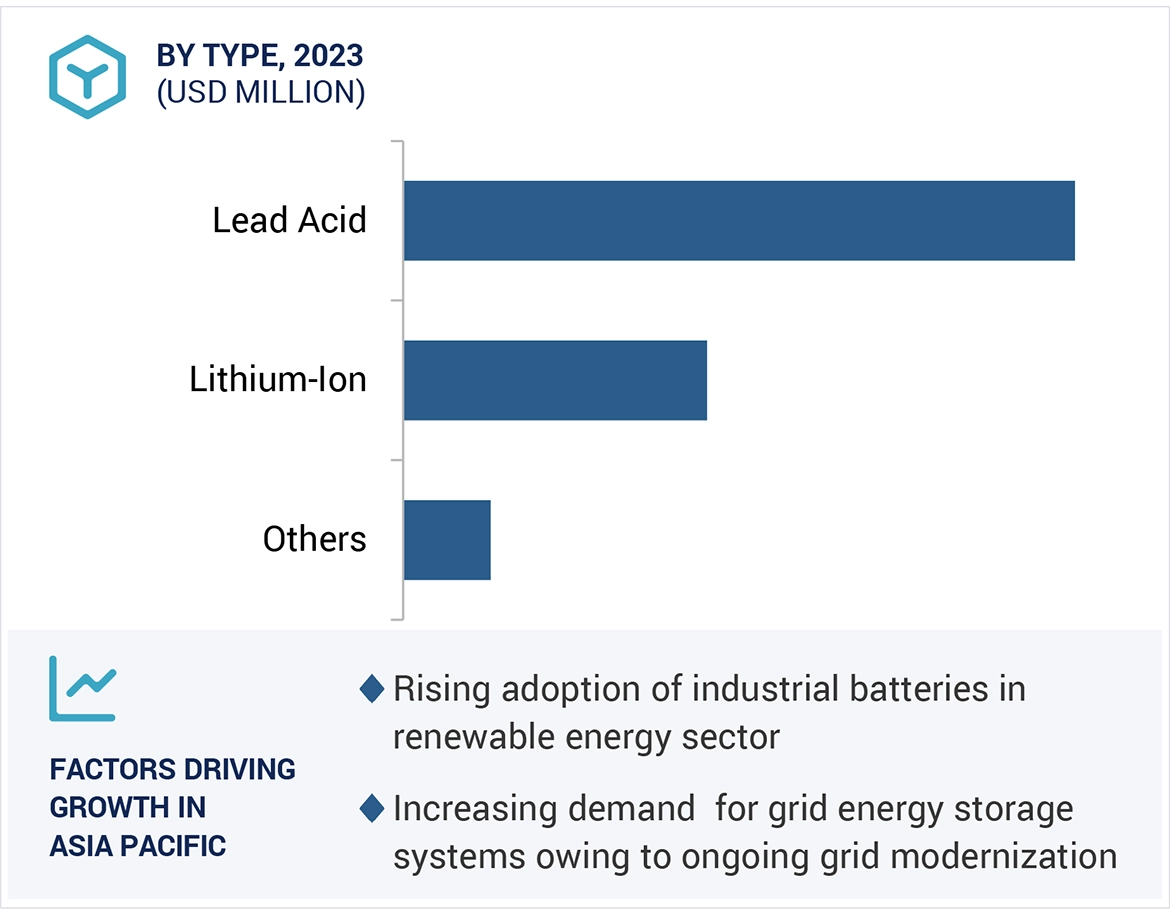
7.1 INTRODUCTION
7.2 LEAD-ACID
7.2.1 INCREASING ADOPTION IN GRID ENERGY STORAGE TO DRIVE GROWTH
7.3 LITHIUM-ION
7.3.1 DECREASE IN PRICES TO DRIVE GROWTH
7.4 OTHERS
8 INDUSTRIAL BATTERIES MARKET, BY END-USE INDUSTRY (Page No. - 81)
8.1 INTRODUCTION
8.2 STATIONARY BATTERY
8.2.1 INCREASING GRID-LEVEL APPLICATIONS TO DRIVE GROWTH
8.2.2 TELECOMMUNICATIONS
8.2.3 UNINTERRUPTIBLE POWER SUPPLY
8.2.4 GRID LEVEL
8.3 MOTIVE BATTERY
8.3.1 EFFICIENT STORAGE OF ELECTRICITY FROM RENEWABLE ENERGY SOURCES TO DRIVE GROWTH
8.3.2 LOW-SPEED ELECTRIC VEHICLE
8.3.3 FLOOR SCRUBBER
8.3.4 MATERIAL HANDLING
8.3.5 MARINE
8.3.6 RECREATIONAL VEHICLE
9 INDUSTRIAL BATTERIES MARKET, BY REGION (Page No. - 89)
9.1 INTRODUCTION
9.2 NORTH AMERICA
9.2.1 US
9.2.1.1 Increasing demand for batteries in grid-level energy storage to drive growth
9.2.2 CANADA
9.2.2.1 Innovations in grid-connected solutions to drive growth
9.2.3 MEXICO
9.2.3.1 Expansion of domestic automotive sector to drive growth
9.3 ASIA PACIFIC
9.3.1 CHINA
9.3.1.1 Increasing production of electric vehicles to drive growth
9.3.2 JAPAN
9.3.2.1 Expansion of R&D resources by battery giants to drive growth
9.3.3 INDIA
9.3.3.1 Rising adoption of electric vehicles to drive growth
9.3.4 REST OF ASIA PACIFIC
9.4 EUROPE
9.4.1 GERMANY
9.4.1.1 Increasing expansion of residential energy storage sector to drive growth
9.4.2 UK
9.4.2.1 Investments in lithium-ion battery materials for electric vehicles to drive growth
9.4.3 FRANCE
9.4.3.1 Diversified electricity production goals to drive growth
9.4.4 REST OF EUROPE
9.5 MIDDLE EAST & AFRICA
9.5.1 GCC
9.5.1.1 Saudi Arabia
9.5.1.1.1 Government initiatives toward renewable energy sector to drive growth
9.5.1.2 UAE
9.5.1.2.1 Development of telecom & data communications sector to drive growth
9.5.2 SOUTH AFRICA
9.5.2.1 Rising demand for portable devices to drive growth
9.5.3 REST OF MIDDLE EAST & AFRICA
9.6 SOUTH AMERICA
9.6.1 BRAZIL
9.6.1.1 Rising demand for consumer and automotive batteries to drive growth
9.6.2 REST OF SOUTH AMERICA
10 COMPETITIVE LANDSCAPE (Page No. - 123)
10.1 INTRODUCTION
10.2 KEY PLAYER STRATEGIES/RIGHT TO WIN
10.2.1 OVERVIEW OF STRATEGIES ADOPTED BY KEY MARKET PLAYERS
10.3 REVENUE ANALYSIS
10.4 MARKET SHARE ANALYSIS
10.4.1 MARKET RANKING ANALYSIS
10.4.1.1 EnerSys. (US)
10.4.1.2 GS Yuasa International Ltd. (Japan)
10.4.1.3 Leoch International Technology Limited Inc (China)
10.4.1.4 Exide Industries Ltd. (India)
10.4.1.5 C&D Technologies, Inc. (US)
10.5 BRAND/PRODUCT COMPARISON
10.5.1 DATASAFE XE BATTERIES
10.5.2 LCT-HP FLOODED BATTERY
10.5.3 NP SERIES
10.5.4 EXIDE POWERSAFE EHP
10.5.5 PU UPS SHORT-TIME BACKUP POWER SERIES
10.6 COMPANY EVALUATION MATRIX: KEY PLAYERS, 2023
10.6.1 STARS
10.6.2 EMERGING LEADERS
10.6.3 PERVASIVE PLAYERS
10.6.4 PARTICIPANTS
10.6.5 COMPANY FOOTPRINT
10.7 COMPANY EVALUATION MATRIX: START-UP/SMES, 2023
10.7.1 PROGRESSIVE COMPANIES
10.7.2 RESPONSIVE COMPANIES
10.7.3 DYNAMIC COMPANIES
10.7.4 STARTING BLOCKS
10.7.5 COMPETITIVE BENCHMARKING
10.8 COMPANY VALUATION AND FINANCIAL METRICS
10.9 COMPETITIVE SCENARIOS AND TRENDS
10.9.1 PRODUCT LAUNCHES
10.9.2 DEALS
11 COMPANY PROFILES (Page No. - 142)
11.1 MAJOR PLAYERS
11.1.1 ENERSYS.
11.1.1.1 Business overview
11.1.1.2 Products offered
11.1.1.3 MnM view
11.1.1.3.1 Right to win
11.1.1.3.2 Strategic choices
11.1.1.3.3 Weaknesses and competitive threats
11.1.2 C&D TECHNOLOGIES, INC.
11.1.2.1 Business overview
11.1.2.2 Products offered
11.1.2.3 Recent developments
11.1.2.4 MnM view
11.1.2.4.1 Right to Win
11.1.2.4.2 Strategic choices
11.1.2.4.3 Weaknesses and competitive threats
11.1.3 GS YUASA INTERNATIONAL LTD.
11.1.3.1 Business overview
11.1.3.2 Products offered
11.1.3.3 MnM view
11.1.3.3.1 Right to Win
11.1.3.3.2 Strategic choices
11.1.3.3.3 Weaknesses and competitive threats
11.1.4 EXIDE INDUSTRIES LTD.
11.1.4.1 Business overview
11.1.4.2 Products offered
11.1.4.3 MnM view
11.1.4.3.1 Right to win
11.1.4.3.2 Strategic choices
11.1.4.3.3 Weaknesses and competitive threats
11.1.5 LEOCH INTERNATIONAL TECHNOLOGY LIMITED INC
11.1.5.1 Business overview
11.1.5.2 Products offered
11.1.5.3 Recent developments
11.1.5.4 MnM view
11.1.5.4.1 Right to Win
11.1.5.4.2 Strategic choices
11.1.5.4.3 Weaknesses and competitive threats
11.1.6 CROWN BATTERY
11.1.6.1 Business overview
11.1.6.2 Products offered
11.1.7 EAST PENN MANUFACTURING COMPANY
11.1.7.1 Business overview
11.1.7.2 Products offered
11.1.8 SAMSUNG SDI CO., LTD.
11.1.8.1 Business overview
11.1.8.2 Products offered
11.1.9 SK INNOVATION CO., LTD
11.1.9.1 Business overview
11.1.9.2 Products offered
11.1.10 NARADA POWER
11.1.10.1 Business overview
11.1.10.2 Products offered
11.1.10.3 Recent developments
11.1.11 VISION GROUP
11.1.12 LG CHEM
11.1.13 YUASA BATTERY (THAILAND) PUBLIC COMPANY LTD.
11.1.14 CONTEMPORARY AMPEREX TECHNOLOGY CO., LIMITED
11.1.15 HOPPECKE BATTERIEN GMBH & CO. KG
11.1.15.3.1 Others
11.1.15.3.2 Deals
11.1.16 THE SUNLIGHT GROUP
11.1.16.3.1 Product launches
11.1.16.3.2 Deals
11.1.17 TAB
11.1.17.3.1 Deals
11.1.18 RITAR INTERNATIONAL GROUP
11.1.19 U.S. BATTERY
11.1.19.1 Business overview
11.1.19.2 Products offered
11.1.19.3 Recent developments
11.1.19.3.1 Product launches
11.1.19.3.2 Deals
11.1.20 AMARA RAJA ENERGY & MOBILITY LIMITED
11.1.20.1 Business overview
11.1.20.2 Products offered
11.1.20.3 Recent developments
11.1.21 IPOWER BATTERIES
11.1.21.1 Business overview
11.1.21.2 Products offered
11.1.21.3 Recent developments
11.1.21.3.1 Product launches
11.1.21.3.2 Deals
11.1.22 JYC BATTERY MANUFACTURER CO., LTD
11.1.22.1 Business overview
11.1.22.2 Products offered
11.1.22.3 Recent developments
11.1.22.3.1 Product launches
11.2 OTHER PLAYERS
11.2.1 AMARON BATTERIES
11.2.2 SAFT GROUPE
11.2.2.1 Recent developments
11.2.3 ROLLS BATTERY
11.2.4 VICTRON ENERGY
11.2.5 NORTHVOLT AB
11.2.5.1 Recent developments
12 ADJACENT AND RELATED MARKETS (Page No. - 233)
12.1 INTRODUCTION
12.2 LIMITATIONS
12.3 INTERCONNECTED MARKETS
12.4 LITHIUM-ION BATTERY MARKET
12.4.1 MARKET DEFINITION
12.4.2 MARKET OVERVIEW
12.4.3 LITHIUM-ION BATTERY MARKET, BY VOLTAGE
12.4.3.1 Low voltage
12.4.3.2 Medium voltage
12.4.3.3 High voltage
13 APPENDIX (Page No. - 236)
13.1 DISCUSSION GUIDE
13.2 KNOWLEDGESTORE: MARKETSANDMARKETS’ SUBSCRIPTION PORTAL
13.3 CUSTOMIZATION OPTIONS
13.4 RELATED REPORTS
13.5 AUTHOR DETAILS
LIST OF TABLES (228 TABLES)
TABLE 1 INDUSTRIAL BATTERIES MARKET: INCLUSIONS AND EXCLUSIONS
TABLE 2 INDUSTRIAL BATTERIES MARKET SNAPSHOT: 2024 VS. 2029
TABLE 3 PORTER’S FIVE FORCES ANALYSIS
TABLE 4 ROLE OF COMPANIES IN ECOSYSTEM
TABLE 5 TARIFF DATA
TABLE 6 NORTH AMERICA: REGULATORY BODIES, GOVERNMENT AGENCIES, AND OTHER ORGANIZATIONS
TABLE 7 EUROPE: REGULATORY BODIES, GOVERNMENT AGENCIES, AND OTHER ORGANIZATIONS
TABLE 8 ASIA PACIFIC: REGULATORY BODIES, GOVERNMENT AGENCIES, AND OTHER ORGANIZATIONS
TABLE 9 REST OF THE WORLD: REGULATORY BODIES, GOVERNMENT AGENCIES, AND OTHER ORGANIZATIONS
TABLE 10 INDUSTRIAL BATTERIES MARKET: KEY CONFERENCES AND EVENTS, 2024−2025
TABLE 11 INFLUENCE OF STAKEHOLDERS ON BUYING PROCESS FOR TOP END USES (%)
TABLE 12 KEY BUYING CRITERIA FOR TOP END USES
TABLE 13 IMPORT DATA ON LITHIUM CELLS AND BATTERIES (USD BILLION), 2019−2022
TABLE 14 EXPORT DATA ON LITHIUM CELLS AND BATTERIES (USD BILLION), 2019−2022
TABLE 15 INDUSTRIAL BATTERIES MARKET, BY BATTERY TYPE, 2019–2022 (USD MILLION)
TABLE 16 INDUSTRIAL BATTERIES MARKET, BY BATTERY TYPE, 2023–2029 (USD MILLION)
TABLE 17 LEAD-ACID BATTERY MARKET, BY END-USE INDUSTRY, 2019–2022 (USD MILLION)
TABLE 18 LEAD-ACID BATTERY MARKET, BY END-USE INDUSTRY, 2023–2029 (USD MILLION)
TABLE 19 LEAD-ACID BATTERY MARKET, BY REGION, 2019–2022 (USD MILLION)
TABLE 20 LEAD-ACID BATTERY MARKET, BY REGION, 2023–2029 (USD MILLION)
TABLE 21 LEAD-ACID BATTERY MARKET IN STATIONARY BATTERY END-USE INDUSTRY, 2019–2022 (USD MILLION)
TABLE 22 LEAD-ACID BATTERY MARKET IN STATIONARY BATTERY END-USE INDUSTRY, 2023–2029 (USD MILLION)
TABLE 23 STATIONARY LEAD-ACID BATTERY MARKET, BY REGION, 2019–2022 (USD MILLION)
TABLE 24 STATIONARY LEAD-ACID BATTERY MARKET, BY REGION, 2023–2029 (USD MILLION)
TABLE 25 MOTIVE LEAD-ACID BATTERY MARKET, BY REGION, 2019–2022 (USD MILLION)
TABLE 26 MOTIVE LEAD-ACID BATTERY MARKET, BY REGION, 2023–2029 (USD MILLION)
TABLE 27 LITHIUM-ION BATTERY MARKET, BY END-USE INDUSTRY, 2019–2022 (USD MILLION)
TABLE 28 LITHIUM-ION BATTERY MARKET, BY END-USE INDUSTRY, 2023–2029 (USD MILLION)
TABLE 29 LITHIUM-ION BATTERY MARKET, BY REGION, 2019–2022 (USD MILLION)
TABLE 30 LITHIUM-ION BATTERY MARKET, BY REGION, 2023–2029 (USD MILLION)
TABLE 31 LITHIUM-ION BATTERY MARKET IN STATIONARY BATTERY END-USE INDUSTRY, 2019–2022 (USD MILLION)
TABLE 32 LITHIUM-ION BATTERY MARKET IN STATIONARY BATTERY END-USE INDUSTRY, 2023–2029 (USD MILLION)
TABLE 33 STATIONARY LITHIUM-ION BATTERY MARKET, BY REGION, 2019–2022 (USD MILLION)
TABLE 34 STATIONARY LITHIUM-ION BATTERY MARKET, BY REGION, 2023–2029 (USD MILLION)
TABLE 35 MOTIVE LITHIUM-ION BATTERY MARKET, BY REGION, 2019–2022 (USD MILLION)
TABLE 36 MOTIVE LITHIUM-ION BATTERY MARKET, BY REGION, 2023–2029 (USD MILLION)
TABLE 37 OTHER INDUSTRIAL BATTERIES MARKET, BY END-USE INDUSTRY, 2019–2022 (USD MILLION)
TABLE 38 OTHER INDUSTRIAL BATTERIES MARKET, BY END-USE INDUSTRY, 2023–2029 (USD MILLION)
TABLE 39 OTHER INDUSTRIAL BATTERIES MARKET, BY REGION, 2019–2022 (USD MILLION)
TABLE 40 OTHER INDUSTRIAL BATTERIES MARKET, BY REGION, 2023–2029 (USD MILLION)
TABLE 41 OTHER INDUSTRIAL BATTERIES MARKET IN STATIONARY BATTERY END-USE INDUSTRY, 2019–2022 (USD MILLION)
TABLE 42 OTHER INDUSTRIAL BATTERIES MARKET IN STATIONARY BATTERY END-USE INDUSTRY, 2023–2029 (USD MILLION)
TABLE 43 OTHER STATIONARY INDUSTRIAL BATTERIES MARKET, BY REGION, 2019–2022 (USD MILLION)
TABLE 44 OTHER STATIONARY INDUSTRIAL BATTERIES MARKET, BY REGION, 2023–2029 (USD MILLION)
TABLE 45 OTHER MOTIVE INDUSTRIAL BATTERIES MARKET, BY REGION, 2019–2022 (USD MILLION)
TABLE 46 OTHER MOTIVE INDUSTRIAL BATTERIES MARKET, BY REGION, 2023–2029 (USD MILLION)
TABLE 47 INDUSTRIAL BATTERIES MARKET, BY END-USE INDUSTRY, 2019–2022 (USD MILLION)
TABLE 48 INDUSTRIAL BATTERIES MARKET, BY END-USE INDUSTRY, 2023–2029 (USD MILLION)
TABLE 49 STATIONARY INDUSTRIAL BATTERIES MARKET, BY END-USE INDUSTRY, 2019–2022 (USD MILLION)
TABLE 50 STATIONARY INDUSTRIAL BATTERIES MARKET, BY END-USE INDUSTRY, 2023–2029 (USD MILLION)
TABLE 51 STATIONARY INDUSTRIAL BATTERIES MARKET, BY REGION, 2019–2022 (USD MILLION)
TABLE 52 STATIONARY INDUSTRIAL BATTERIES MARKET, BY REGION, 2023–2029 (USD MILLION)
TABLE 53 STATIONARY INDUSTRIAL BATTERIES MARKET, BY BATTERY TYPE, 2019–2022 (USD MILLION)
TABLE 54 STATIONARY INDUSTRIAL BATTERIES MARKET, BY BATTERY TYPE, 2023–2029 (USD MILLION)
TABLE 55 MOTIVE INDUSTRIAL BATTERIES MARKET, BY APPLICATION, 2019–2022 (USD MILLION)
TABLE 56 MOTIVE INDUSTRIAL BATTERIES MARKET, BY APPLICATION, 2023–2029 (USD MILLION)
TABLE 57 MOTIVE INDUSTRIAL BATTERIES MARKET, BY REGION, 2019–2022 (USD MILLION)
TABLE 58 MOTIVE INDUSTRIAL BATTERIES MARKET, BY REGION, 2023–2029 (USD MILLION)
TABLE 59 MOTIVE INDUSTRIAL BATTERIES MARKET, BY BATTERY TYPE, 2019–2022 (USD MILLION)
TABLE 60 MOTIVE INDUSTRIAL BATTERIES MARKET, BY BATTERY TYPE, 2023–2029 (USD MILLION)
TABLE 61 INDUSTRIAL BATTERIES MARKET, BY REGION, 2019–2022 (USD MILLION)
TABLE 62 INDUSTRIAL BATTERIES MARKET, BY REGION, 2023–2029 (USD MILLION)
TABLE 63 NORTH AMERICA: INDUSTRIAL BATTERIES MARKET, BY COUNTRY, 2019–2022 (USD MILLION)
TABLE 64 NORTH AMERICA: INDUSTRIAL BATTERIES MARKET, BY COUNTRY, 2023–2029 (USD MILLION)
TABLE 65 NORTH AMERICA: INDUSTRIAL BATTERIES MARKET, BY END-USE INDUSTRY, 2019–2022 (USD MILLION)
TABLE 66 NORTH AMERICA: INDUSTRIAL BATTERIES MARKET, BY END-USE INDUSTRY, 2023–2029 (USD MILLION)
TABLE 67 NORTH AMERICA: INDUSTRIAL BATTERIES MARKET, BY MOTIVE BATTERY END-USE INDUSTRY, 2019–2022 (USD MILLION)
TABLE 68 NORTH AMERICA: INDUSTRIAL BATTERIES MARKET, BY MOTIVE BATTERY END-USE INDUSTRY, 2023–2029 (USD MILLION)
TABLE 69 NORTH AMERICA: INDUSTRIAL BATTERIES MARKET, BY STATIONARY BATTERY END-USE INDUSTRY, 2019–2022 (USD MILLION)
TABLE 70 NORTH AMERICA: INDUSTRIAL BATTERIES MARKET, BY STATIONARY BATTERY END-USE INDUSTRY, 2023–2029 (USD MILLION)
TABLE 71 NORTH AMERICA: INDUSTRIAL BATTERIES MARKET, BY BATTERY TYPE, 2019–2022 (USD MILLION)
TABLE 72 NORTH AMERICA: INDUSTRIAL BATTERIES MARKET, BY BATTERY TYPE, 2023–2029 (USD MILLION)
TABLE 73 US: INDUSTRIAL BATTERIES MARKET, BY END-USE INDUSTRY, 2019–2022 (USD MILLION)
TABLE 74 US: INDUSTRIAL BATTERIES MARKET, BY END-USE INDUSTRY, 2023–2029 (USD MILLION)
TABLE 75 CANADA: INDUSTRIAL BATTERIES MARKET, BY END-USE INDUSTRY, 2019–2022 (USD MILLION)
TABLE 76 CANADA: INDUSTRIAL BATTERIES MARKET, BY END-USE INDUSTRY, 2023–2029 (USD MILLION)
TABLE 77 MEXICO: INDUSTRIAL BATTERIES MARKET, BY END-USE INDUSTRY, 2019–2022 (USD MILLION)
TABLE 78 MEXICO: INDUSTRIAL BATTERIES MARKET, BY END-USE INDUSTRY, 2023–2029 (USD MILLION)
TABLE 79 ASIA PACIFIC: INDUSTRIAL BATTERIES MARKET, BY COUNTRY, 2019–2022 (USD MILLION)
TABLE 80 ASIA PACIFIC: INDUSTRIAL BATTERIES MARKET, BY COUNTRY, 2023–2029 (USD MILLION)
TABLE 81 ASIA PACIFIC: INDUSTRIAL BATTERIES MARKET, BY END-USE INDUSTRY, 2019–2022 (USD MILLION)
TABLE 82 ASIA PACIFIC: INDUSTRIAL BATTERIES MARKET, BY END-USE INDUSTRY, 2023–2029 (USD MILLION)
TABLE 83 ASIA PACIFIC: INDUSTRIAL BATTERIES MARKET, BY MOTIVE BATTERY END-USE INDUSTRY, 2019–2022 (USD MILLION)
TABLE 84 ASIA PACIFIC: INDUSTRIAL BATTERIES MARKET, BY MOTIVE BATTERY END-USE INDUSTRY, 2023–2029 (USD MILLION)
TABLE 85 ASIA PACIFIC: INDUSTRIAL BATTERIES MARKET, BY STATIONARY BATTERY END-USE INDUSTRY, 2019–2022 (USD MILLION)
TABLE 86 ASIA PACIFIC: INDUSTRIAL BATTERIES MARKET, BY STATIONARY BATTERY END-USE INDUSTRY, 2023–2029 (USD MILLION)
TABLE 87 ASIA PACIFIC: INDUSTRIAL BATTERIES MARKET, BY BATTERY TYPE, 2019–2022 (USD MILLION)
TABLE 88 ASIA PACIFIC: INDUSTRIAL BATTERIES MARKET, BY BATTERY TYPE, 2023–2029 (USD MILLION)
TABLE 89 CHINA: INDUSTRIAL BATTERIES MARKET, BY END-USE INDUSTRY, 2019–2022 (USD MILLION)
TABLE 90 CHINA: INDUSTRIAL BATTERIES MARKET, BY END-USE INDUSTRY, 2023–2029 (USD MILLION)
TABLE 91 JAPAN: INDUSTRIAL BATTERIES MARKET, BY END-USE INDUSTRY, 2019–2022 (USD MILLION)
TABLE 92 JAPAN: INDUSTRIAL BATTERIES MARKET, BY END-USE INDUSTRY, 2023–2029 (USD MILLION)
TABLE 93 INDIA: INDUSTRIAL BATTERIES MARKET, BY END-USE INDUSTRY, 2019–2022 (USD MILLION)
TABLE 94 INDIA: INDUSTRIAL BATTERIES MARKET, BY END-USE INDUSTRY, 2023–2029 (USD MILLION)
TABLE 95 REST OF ASIA PACIFIC: INDUSTRIAL BATTERIES MARKET, BY END-USE INDUSTRY, 2019–2022 (USD MILLION)
TABLE 96 REST OF ASIA PACIFIC: INDUSTRIAL BATTERIES MARKET, BY END-USE INDUSTRY, 2023–2029 (USD MILLION)
TABLE 97 EUROPE: INDUSTRIAL BATTERIES MARKET, BY COUNTRY, 2019–2022 (USD MILLION)
TABLE 98 EUROPE: INDUSTRIAL BATTERIES MARKET, BY COUNTRY, 2023–2029 (USD MILLION)
TABLE 99 EUROPE: INDUSTRIAL BATTERIES MARKET, BY END-USE INDUSTRY, 2019–2022 (USD MILLION)
TABLE 100 EUROPE: INDUSTRIAL BATTERIES MARKET, BY END-USE INDUSTRY, 2023–2029 (USD MILLION)
TABLE 101 EUROPE: INDUSTRIAL BATTERIES MARKET, BY MOTIVE BATTERY END-USE INDUSTRY, 2019–2022 (USD MILLION)
TABLE 102 EUROPE: INDUSTRIAL BATTERIES MARKET, BY MOTIVE BATTERY END-USE INDUSTRY, 2023–2029 (USD MILLION)
TABLE 103 EUROPE: INDUSTRIAL BATTERIES MARKET, BY STATIONARY BATTERY END-USE INDUSTRY, 2019–2022 (USD MILLION)
TABLE 104 EUROPE: INDUSTRIAL BATTERIES MARKET, BY STATIONARY BATTERY END-USE INDUSTRY, 2023–2029 (USD MILLION)
TABLE 105 EUROPE: INDUSTRIAL BATTERIES MARKET, BY BATTERY TYPE, 2019–2022 (USD MILLION)
TABLE 106 EUROPE: INDUSTRIAL BATTERIES MARKET, BY BATTERY TYPE, 2023–2029 (USD MILLION)
TABLE 107 GERMANY: INDUSTRIAL BATTERIES MARKET, BY END-USE INDUSTRY, 2019–2022 (USD MILLION)
TABLE 108 GERMANY: INDUSTRIAL BATTERIES MARKET, BY END-USE INDUSTRY, 2023–2029 (USD MILLION)
TABLE 109 UK: INDUSTRIAL BATTERIES MARKET, BY END-USE INDUSTRY, 2019–2022 (USD MILLION)
TABLE 110 UK: INDUSTRIAL BATTERIES MARKET, BY END-USE INDUSTRY, 2023–2029 (USD MILLION)
TABLE 111 FRANCE: INDUSTRIAL BATTERIES MARKET, BY END-USE INDUSTRY, 2019–2022 (USD MILLION)
TABLE 112 FRANCE: INDUSTRIAL BATTERIES MARKET, BY END-USE INDUSTRY, 2023–2029 (USD MILLION)
TABLE 113 REST OF EUROPE: INDUSTRIAL BATTERIES MARKET, BY END-USE INDUSTRY, 2019–2022 (USD MILLION)
TABLE 114 REST OF EUROPE: INDUSTRIAL BATTERIES MARKET, BY END-USE INDUSTRY, 2023–2029 (USD MILLION)
TABLE 115 MIDDLE EAST & AFRICA: INDUSTRIAL BATTERIES MARKET, BY COUNTRY, 2019–2022 (USD MILLION)
TABLE 116 MIDDLE EAST & AFRICA: INDUSTRIAL BATTERIES MARKET, BY COUNTRY, 2023–2029 (USD MILLION)
TABLE 117 MIDDLE EAST & AFRICA: INDUSTRIAL BATTERIES MARKET, BY END-USE INDUSTRY, 2019–2022 (USD MILLION)
TABLE 118 MIDDLE EAST & AFRICA: INDUSTRIAL BATTERIES MARKET, BY END-USE INDUSTRY, 2023–2029 (USD MILLION)
TABLE 119 MIDDLE EAST & AFRICA: INDUSTRIAL BATTERIES MARKET, BY MOTIVE BATTERY END-USE INDUSTRY, 2019–2022 (USD MILLION)
TABLE 120 MIDDLE EAST & AFRICA: INDUSTRIAL BATTERIES MARKET, BY MOTIVE BATTERY END-USE INDUSTRY, 2023–2029 (USD MILLION)
TABLE 121 MIDDLE EAST & AFRICA: INDUSTRIAL BATTERIES MARKET, BY STATIONARY BATTERY END-USE INDUSTRY, 2019–2022 (USD MILLION)
TABLE 122 MIDDLE EAST & AFRICA: INDUSTRIAL BATTERIES MARKET, BY STATIONARY BATTERY END-USE INDUSTRY, 2023–2029 (USD MILLION)
TABLE 123 MIDDLE EAST & AFRICA: INDUSTRIAL BATTERIES MARKET, BY BATTERY TYPE, 2019–2022 (USD MILLION)
TABLE 124 MIDDLE EAST & AFRICA: INDUSTRIAL BATTERIES MARKET, BY BATTERY TYPE, 2023–2029 (USD MILLION)
TABLE 125 SAUDI ARABIA: INDUSTRIAL BATTERIES MARKET, BY END-USE INDUSTRY, 2019–2022 (USD MILLION)
TABLE 126 SAUDI ARABIA: INDUSTRIAL BATTERIES MARKET, BY END-USE INDUSTRY, 2023–2029 (USD MILLION)
TABLE 127 UAE: INDUSTRIAL BATTERIES MARKET, BY END-USE INDUSTRY, 2019–2022 (USD MILLION)
TABLE 128 UAE: INDUSTRIAL BATTERIES MARKET, BY END-USE INDUSTRY, 2023–2029 (USD MILLION)
TABLE 129 SOUTH AFRICA: INDUSTRIAL BATTERIES MARKET, BY END-USE INDUSTRY, 2019–2022 (USD MILLION)
TABLE 130 SOUTH AFRICA: INDUSTRIAL BATTERIES MARKET, BY END-USE INDUSTRY, 2023–2029 (USD MILLION)
TABLE 131 REST OF MIDDLE EAST & AFRICA: INDUSTRIAL BATTERIES MARKET, BY END-USE INDUSTRY, 2019–2022 (USD MILLION)
TABLE 132 REST OF MIDDLE EAST & AFRICA: INDUSTRIAL BATTERIES MARKET, BY END-USE INDUSTRY, 2023–2029 (USD MILLION)
TABLE 133 SOUTH AMERICA: INDUSTRIAL BATTERIES MARKET, BY COUNTRY, 2019–2022 (USD MILLION)
TABLE 134 SOUTH AMERICA: INDUSTRIAL BATTERIES MARKET, BY COUNTRY, 2023–2029 (USD MILLION)
TABLE 135 SOUTH AMERICA: INDUSTRIAL BATTERIES MARKET, BY END-USE INDUSTRY, 2019–2022 (USD MILLION)
TABLE 136 SOUTH AMERICA: INDUSTRIAL BATTERIES MARKET, BY END-USE INDUSTRY, 2023–2029 (USD MILLION)
TABLE 137 SOUTH AMERICA: INDUSTRIAL BATTERIES MARKET, BY MOTIVE BATTERY END-USE INDUSTRY, 2019–2022 (USD MILLION)
TABLE 138 SOUTH AMERICA: INDUSTRIAL BATTERIES MARKET, BY MOTIVE BATTERY END-USE INDUSTRY, 2023–2029 (USD MILLION)
TABLE 139 SOUTH AMERICA: INDUSTRIAL BATTERIES MARKET, BY STATIONARY BATTERY END-USE INDUSTRY, 2019–2022 (USD MILLION)
TABLE 140 SOUTH AMERICA: INDUSTRIAL BATTERIES MARKET, BY STATIONARY BATTERY END-USE INDUSTRY, 2023–2029 (USD MILLION)
TABLE 141 SOUTH AMERICA: INDUSTRIAL BATTERIES MARKET, BY BATTERY TYPE, 2019–2022 (USD MILLION)
TABLE 142 SOUTH AMERICA: INDUSTRIAL BATTERIES MARKET, BY BATTERY TYPE, 2023–2029 (USD MILLION)
TABLE 143 BRAZIL: INDUSTRIAL BATTERIES MARKET, BY END-USE INDUSTRY, 2019–2022 (USD MILLION)
TABLE 144 BRAZIL: INDUSTRIAL BATTERIES MARKET, BY END-USE INDUSTRY, 2023–2029 (USD MILLION)
TABLE 145 REST OF SOUTH AMERICA: INDUSTRIAL BATTERIES MARKET, BY END-USE INDUSTRY, 2019–2022 (USD MILLION)
TABLE 146 REST OF SOUTH AMERICA: INDUSTRIAL BATTERIES MARKET, BY END-USE INDUSTRY, 2023–2029 (USD MILLION)
TABLE 147 DEGREE OF COMPETITION: INDUSTRIAL BATTERIES MARKET
TABLE 148 INDUSTRIAL BATTERIES MARKET: REGION FOOTPRINT (21 COMPANIES)
TABLE 149 INDUSTRIAL BATTERIES MARKET: BATTERY TYPE FOOTPRINT (21 COMPANIES)
TABLE 150 INDUSTRIAL BATTERIES MARKET: END-USE INDUSTRY FOOTPRINT (21 COMPANIES)
TABLE 151 INDUSTRIAL BATTERIES MARKET: LIST OF KEY START-UPS/SMES
TABLE 152 INDUSTRIAL BATTERIES MARKET: COMPETITIVE BENCHMARKING OF KEY START-UPS/SMES
TABLE 153 INDUSTRIAL BATTERIES MARKET: PRODUCT LAUNCHES (JANUARY 2021–APRIL 2024)
TABLE 154 INDUSTRIAL BATTERIES MARKET: DEALS (JANUARY 2021–DECEMBER 2023)
TABLE 155 ENERSYS.: COMPANY OVERVIEW
TABLE 156 ENERSYS.: PRODUCTS OFFERED
TABLE 157 C&D TECHNOLOGIES, INC.: COMPANY OVERVIEW
TABLE 158 C&D TECHNOLOGIES, INC.: PRODUCTS OFFERED
TABLE 159 C&D TECHNOLOGIES, INC.: PRODUCT LAUNCHES
TABLE 160 GS YUASA INTERNATIONAL LTD.: COMPANY OVERVIEW
TABLE 161 GS YUASA INTERNATIONAL LTD.: PRODUCTS OFFERED
TABLE 162 EXIDE INDUSTRIES LTD.: COMPANY OVERVIEW
TABLE 163 EXIDE INDUSTRIES LTD.: PRODUCTS OFFERED
TABLE 164 LEOCH INTERNATIONAL TECHNOLOGY LIMITED INC: COMPANY OVERVIEW
TABLE 165 LEOCH INTERNATIONAL TECHNOLOGY LIMITED INC: PRODUCTS OFFERED
TABLE 166 LEOCH INTERNATIONAL TECHNOLOGY LIMITED INC: PRODUCT LAUNCHES
TABLE 167 CROWN BATTERY: COMPANY OVERVIEW
TABLE 168 CROWN BATTERY: PRODUCTS OFFERED
TABLE 169 EAST PENN MANUFACTURING COMPANY: COMPANY OVERVIEW
TABLE 170 EAST PENN MANUFACTURING COMPANY: PRODUCTS OFFERED
TABLE 171 SAMSUNG SDI CO., LTD.: COMPANY OVERVIEW
TABLE 172 SAMSUNG SDI CO., LTD.: PRODUCTS OFFERED
TABLE 173 SK INNOVATION CO., LTD: COMPANY OVERVIEW
TABLE 174 SK INNOVATION CO., LTD: PRODUCTS OFFERED
TABLE 175 NARADA POWER: COMPANY OVERVIEW
TABLE 176 NARADA POWER: PRODUCTS OFFERED
TABLE 177 NARADA POWER: OTHERS
TABLE 178 NARADA POWER: PRODUCT LAUNCHES
TABLE 179 VISION GROUP: COMPANY OVERVIEW
TABLE 180 VISION GROUP: PRODUCTS OFFERED
TABLE 181 LG CHEM: COMPANY OVERVIEW
TABLE 182 LG CHEM: PRODUCTS OFFERED
TABLE 183 LG CHEM: DEALS
TABLE 184 LG CHEM: OTHERS
TABLE 185 YUASA BATTERY (THAILAND) PUBLIC COMPANY LTD.: COMPANY OVERVIEW
TABLE 186 YUASA BATTERY (THAILAND) PUBLIC COMPANY LTD.: PRODUCTS OFFERED
TABLE 187 CONTEMPORARY AMPEREX TECHNOLOGY CO., LIMITED: COMPANY OVERVIEW
TABLE 188 CONTEMPORARY AMPEREX TECHNOLOGY CO., LIMITED: PRODUCTS OFFERED
TABLE 189 CONTEMPORARY AMPEREX TECHNOLOGY CO., LIMITED: PRODUCT LAUNCHES
TABLE 190 CONTEMPORARY AMPEREX TECHNOLOGY CO., LIMITED: DEALS
TABLE 191 HOPPECKE BATTERIEN GMBH & CO. KG.: COMPANY OVERVIEW
TABLE 192 HOPPECKE BATTERIEN GMBH & CO. KG.: PRODUCTS OFFERED
TABLE 193 HOPPECKE BATTERIEN GMBH & CO. KG: OTHERS
TABLE 194 HOPPECKE BATTERIEN GMBH & CO. KG.: DEALS
TABLE 195 THE SUNLIGHT GROUP: COMPANY OVERVIEW
TABLE 196 THE SUNLIGHT GROUP: PRODUCTS OFFERED
TABLE 197 THE SUNLIGHT GROUP: PRODUCT LAUNCHES
TABLE 198 THE SUNLIGHT GROUP: DEALS
TABLE 199 TAB: COMPANY OVERVIEW
TABLE 200 TAB: PRODUCTS OFFERED
TABLE 201 TAB: DEALS
TABLE 202 RITAR INTERNATIONAL GROUP: COMPANY OVERVIEW
TABLE 203 RITAR INTERNATIONAL GROUP: PRODUCTS OFFERED
TABLE 204 RITAR INTERNATIONAL GROUP: OTHERS
TABLE 205 U.S. BATTERY: COMPANY OVERVIEW
TABLE 206 U.S. BATTERY: PRODUCT OFFERED
TABLE 207 U.S. BATTERY.: PRODUCT LAUNCHES
TABLE 208 U.S. BATTERY.: DEALS
TABLE 209 AMARA RAJA ENERGY & MOBILITY LIMITED: COMPANY OVERVIEW
TABLE 210 AMARA RAJA ENERGY & MOBILITY LIMITED.: PRODUCTS OFFERED
TABLE 211 AMARA RAJA ENERGY & MOBILITY LIMITED: OTHERS
TABLE 212 IPOWER BATTERIES: COMPANY OVERVIEW
TABLE 213 IPOWER BATTERIES: PRODUCTS OFFERED
TABLE 214 IPOWER BATTERIES.: PRODUCT LAUNCHES
TABLE 215 IPOWER BATTERIES.: DEALS
TABLE 216 JYC BATTERY MANUFACTURER CO., LTD.: COMPANY OVERVIEW
TABLE 217 JYC BATTERY MANUFACTURER CO., LTD.: PRODUCT OFFERINGS
TABLE 218 JYC BATTERY MANUFACTURER CO., LTD.: PRODUCT LAUNCHES
TABLE 219 AMARON BATTERIES: COMPANY OVERVIEW
TABLE 220 SAFT GROUPE: COMPANY OVERVIEW
TABLE 221 SAFT GROUPE: DEALS
TABLE 222 SAFT GROUPE: OTHERS
TABLE 223 ROLLS BATTERY: COMPANY OVERVIEW
TABLE 224 VICTRON ENERGY: COMPANY OVERVIEW
TABLE 225 NORTHVOLT AB: COMPANY OVERVIEW
TABLE 226 NORTHVOLT AB: PRODUCT LAUNCHES
TABLE 227 LITHIUM-ION BATTERY MARKET, BY VOLTAGE, 2019–2022 (USD BILLION)
TABLE 228 LITHIUM-ION BATTERY MARKET, BY VOLTAGE, 2023–2032 (USD BILLION)
LIST OF FIGURES (51 FIGURES)
FIGURE 1 INDUSTRIAL BATTERIES MARKET: MARKET SEGMENTATION
FIGURE 2 INDUSTRIAL BATTERIES MARKET: RESEARCH DESIGN
FIGURE 3 MAIN MATRIX CONSIDERED WHILE CONSTRUCTING AND ASSESSING DEMAND IN INDUSTRIAL BATTERIES MARKET
FIGURE 4 MARKET SIZE ESTIMATION METHODOLOGY: BOTTOM-UP APPROACH
FIGURE 5 MARKET SIZE ESTIMATION METHODOLOGY: TOP-DOWN APPROACH
FIGURE 6 METHODOLOGY FOR SUPPLY-SIDE SIZING OF INDUSTRIAL BATTERIES MARKET (1/2)
FIGURE 7 METHODOLOGY FOR SUPPLY-SIDE SIZING OF INDUSTRIAL BATTERIES MARKET (2/2)
FIGURE 8 INDUSTRIAL BATTERIES MARKET: DATA TRIANGULATION
FIGURE 9 LEAD-ACID SEGMENT TO ACCOUNT FOR LARGEST MARKET SHARE DURING FORECAST PERIOD
FIGURE 10 STATIONARY SEGMENT TO ACCOUNT FOR DOMINANT MARKET SHARE DURING FORECAST PERIOD
FIGURE 11 ASIA PACIFIC TO REGISTER FASTEST GROWTH DURING FORECAST PERIOD
FIGURE 12 SHIFT TO SUSTAINABLE ENERGY TO DRIVE MARKET
FIGURE 13 ASIA PACIFIC TO BE FASTEST-GROWING MARKET DURING FORECAST PERIOD
FIGURE 14 CHINA TO GROW AT HIGHEST RATE DURING FORECAST PERIOD
FIGURE 15 DRIVERS, RESTRAINTS, OPPORTUNITIES, AND CHALLENGES IN INDUSTRIAL BATTERIES MARKET
FIGURE 16 LITHIUM-ION BATTERY PACK PRICE, 2018−2023
FIGURE 17 INDUSTRIAL BATTERIES MARKET: PORTER’S FIVE FORCES ANALYSIS
FIGURE 18 VALUE CHAIN ANALYSIS FOR INDUSTRIAL BATTERIES MARKET
FIGURE 19 ECOSYSTEM OF INDUSTRIAL BATTERIES MARKET
FIGURE 20 AVERAGE SELLING PRICE OF LITHIUM-ION BATTERIES, BY REGION, 2019−2023
FIGURE 21 AVERAGE SELLING PRICE OF LITHIUM-ION BATTERIES, BY CHEMISTRY, 2023
FIGURE 22 INFLUENCE OF STAKEHOLDERS ON BUYING PROCESS FOR TOP END USES
FIGURE 23 KEY BUYING CRITERIA FOR TOP END USES
FIGURE 24 LIST OF MAJOR PATENTS FOR INDUSTRIAL BATTERIES
FIGURE 25 TRENDS/ DISRUPTIONS IMPACTING CUSTOMER BUSINESS
FIGURE 26 INVESTMENT AND FUNDING SCENARIO FOR STARTUPS/SMES IN INDUSTRIAL BATTERIES MARKET
FIGURE 27 LEAD-ACID SEGMENT TO HOLD LARGEST MARKET SHARE DURING FORECAST PERIOD
FIGURE 28 STATIONARY BATTERY END-USE INDUSTRY TO LEAD INDUSTRIAL BATTERIES MARKET DURING FORECAST PERIOD
FIGURE 29 ASIA PACIFIC TO REGISTER HIGHEST CAGR DURING FORECAST PERIOD
FIGURE 30 NORTH AMERICA: INDUSTRIAL BATTERIES MARKET SNAPSHOT
FIGURE 31 ASIA PACIFIC: INDUSTRIAL BATTERIES MARKET SNAPSHOT
FIGURE 32 EUROPE: INDUSTRIAL BATTERIES MARKET SNAPSHOT
FIGURE 33 REVENUE ANALYSIS OF KEY COMPANIES, 2019–2023
FIGURE 34 INDUSTRIAL BATTERIES MARKET SHARE ANALYSIS, 2023
FIGURE 35 RANKING OF TOP 5 PLAYERS IN INDUSTRIAL BATTERIES MARKET, 2023
FIGURE 36 BRAND/PRODUCT COMPARISON
FIGURE 37 COMPANY EVALUATION MATRIX: KEY PLAYERS, 2023
FIGURE 38 INDUSTRIAL BATTERIES MARKET: COMPANY FOOTPRINT (21 COMPANIES)
FIGURE 39 START-UP/SME EVALUATION MATRIX, 2023
FIGURE 40 COMPANY VALUATION
FIGURE 41 COMPANY FINANCIAL METRICS
FIGURE 42 YEAR-TO-DATE (YTD) PRICE TOTAL RETURN AND 5-YEAR STOCK BETA OF KEY MANUFACTURERS
FIGURE 43 ENERSYS.: COMPANY SNAPSHOT
FIGURE 44 GS YUASA INTERNATIONAL LTD.: COMPANY SNAPSHOT
FIGURE 45 EXIDE INDUSTRIES LTD.: COMPANY SNAPSHOT
FIGURE 46 LEOCH INTERNATIONAL TECHNOLOGY LIMITED INC: COMPANY SNAPSHOT
FIGURE 47 SAMSUNG SDI CO., LTD.: COMPANY SNAPSHOT
FIGURE 48 SK INNOVATION CO., LTD: COMPANY SNAPSHOT
FIGURE 49 LG CHEM: COMPANY SNAPSHOT
FIGURE 50 YUASA BATTERY (THAILAND) PUBLIC COMPANY LTD.: COMPANY SNAPSHOT
FIGURE 51 CONTEMPORARY AMPEREX TECHNOLOGY CO., LIMITED: COMPANY SNAPSHOT


Growth opportunities and latent adjacency in Industrial Batteries Market