
Industrial Nitrogen Generator Market

Industrial Nitrogen Generator Market by Size (Stationary, Portable), Design (Cylinder Based, Plug & Play), Technology Type (PSA-based, Membrane-based, Cryogenic), End-use Industry (Food & Beverage, Medical & Pharmaceutical, Transportation, Electrical & Electronics, Chemical & Petrochemical, Manufacturing, Packaging), and Region - Global Forecast to 2030


OVERVIEW
Source: Secondary Research, Interviews with Experts, MarketsandMarkets Analysis
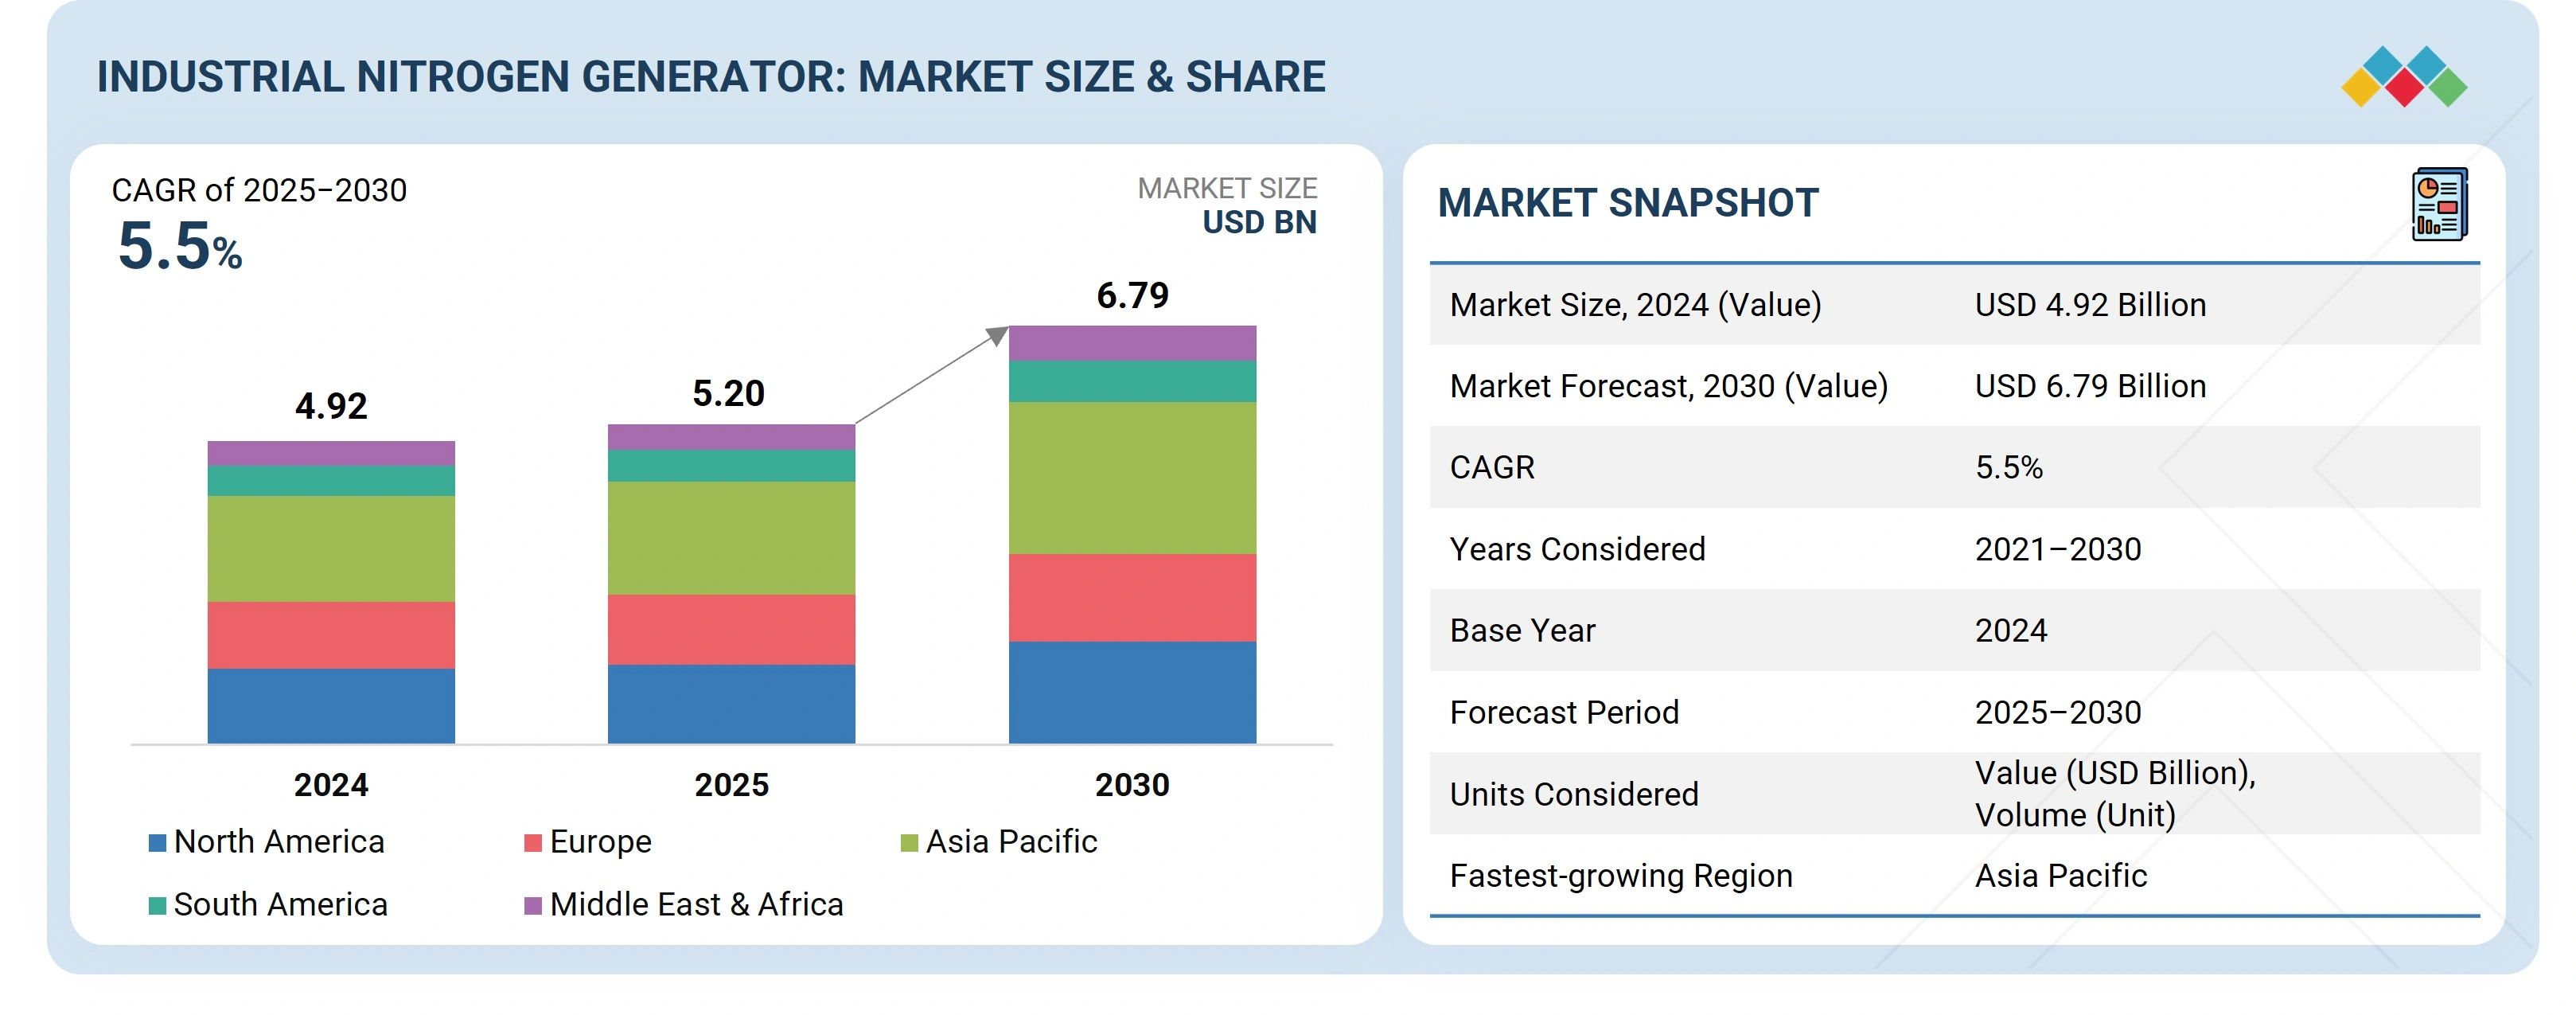
The industrial nitrogen generator market is projected to reach USD 6.79 billion by 2030 from USD 5.20 billion in 2025, at a CAGR of 5.5%. The market is growing due to rising demand in food packaging, electronics manufacturing, healthcare applications, metal fabrication, and cost-efficient on-site gas generation.
KEY TAKEAWAYS
-
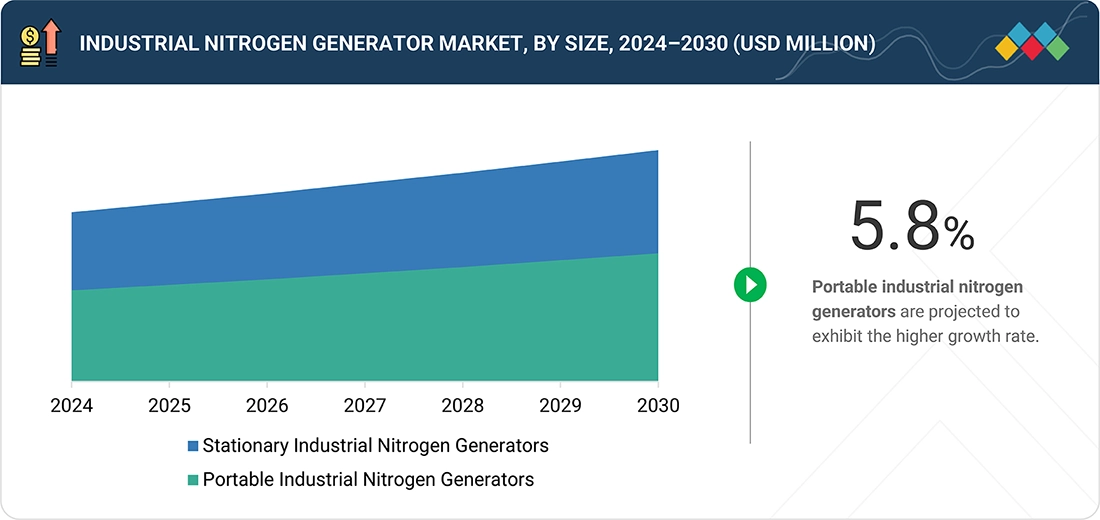
BY SIZEThe industrial nitrogen generator market is segmented on the basis of size into stationary industrial nitrogen generators and portable industrial nitrogen generators. Stationary industrial nitrogen generators dominate in large-scale manufacturing and continuous operations, while portable generators are gaining traction in on-site, remote, and mobile applications where flexibility and ease of deployment are critical.
-
BY DESIGNIndustrial nitrogen generators are classified on the basis of design into cylinder-based and plug & play designs. Plug & play industrial nitrogen generators are estimated to account for a greater market share due to their ease of use, fast installation, and limited infrastructure requirements. These units are shipped as a stand-alone, fully integrated, and pre-tested system.
-
BY TECHNOLOGY TYPEKey technologies include pressure swing adsorption (PSA), membrane-based, and cryogenic-based nitrogen generators. PSA-based nitrogen generators are estimated to account for the largest market due to their cost-effectiveness and high purity levels. Membrane-based units are preferred for moderate purity and compact designs, while cryogenic systems cater to industries requiring ultra-high purity nitrogen. Nitrogen by the PSA generator is given by separating it from the compressed air with Carbon molecular sieves (CMS) with a purity of up to 99.999% required by those industries involved in electronic fabrication, pharmaceutical processing, and food processing.
-
BY END-USE INDUSTRYEnd-use industries include food & beverage, medical & pharmaceutical, transportation, electrical & electronics, chemical & petrochemical, manufacturing, packaging, and other end-use industries. The food & beverage industry leads due to nitrogen’s role in packaging and preservation, followed by electrical & electronics for component cooling, soldering, and manufacturing processes, and medical & pharmaceutical for drug manufacturing and storage. In the food & beverage industry, nitrogen is often used in modified atmosphere packaging (MAP) to displace oxygen, which slows down the oxidation process and, therefore, microbial growth to prevent spoilage, especially with perishable food items such as meat, dairy, baked goods, snacks, and ready-to-eat meals.
-
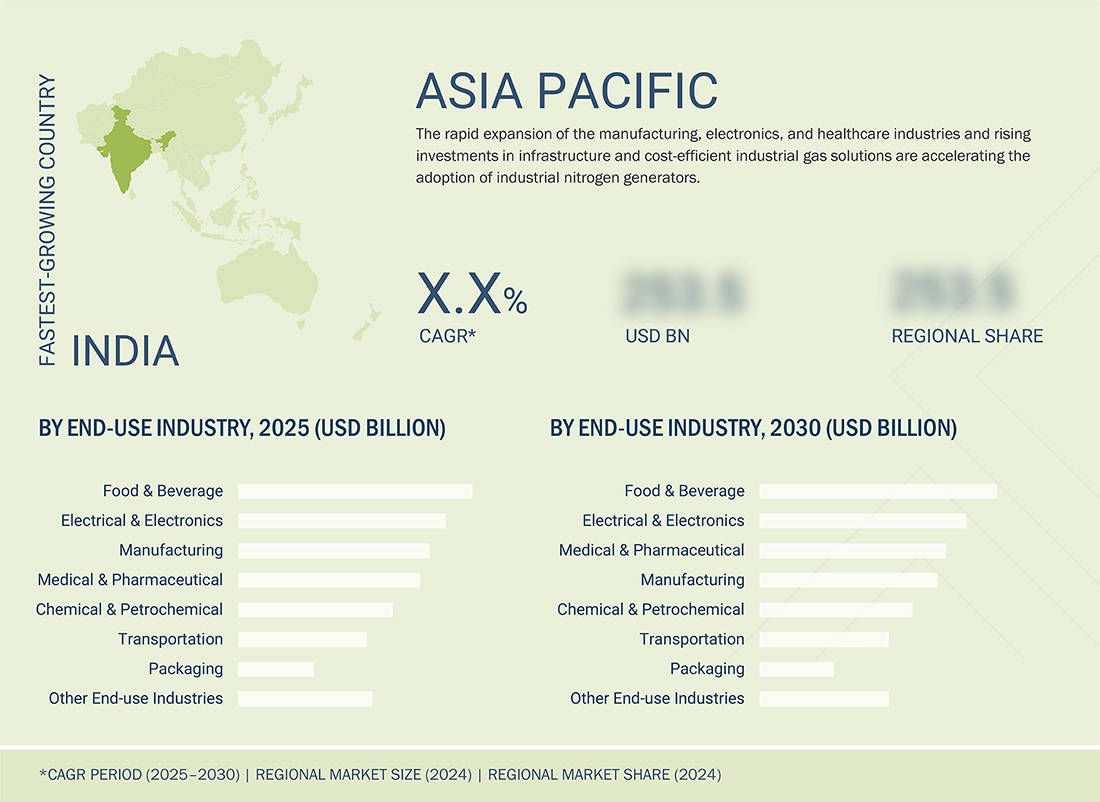
BY REGIONAsia Pacific is projected to grow fastest, at a CAGR of 6.1%, fueled by rapid industrialization and expansion of manufacturing activities in countries like China, Japan, and India.
-
COMPETITIVE LANDSCAPEThe major market players have adopted both organic and inorganic strategies including partnerships and investments. For instance, Parker Hannifin Corp, Air Products and Chemicals, Inc., Atlas Copco Group, Ingersoll Rand, and Air Liquide, are entered into number of agreements and partnerships to cater the growing demand for industrial nitrogen generator across innovative applications.
The growth of the industrial nitrogen generator market is driven by an increase in demand for low-cost, high-purity nitrogen in food packaging, electronics, metal fabrication, and pharmaceuticals, which are satisfied by on-site and on-demand use of industrial nitrogen gas generators. The demand for gas solutions that are energy efficient, reduce operating costs, and have accessible alternatives, including on-site nitrogen generation and sustainable solutions, is also providing a further boost to the industrial nitrogen generator market. Additionally, government safety regulations around the quality or purity of gas sources are required to ensure worker safety.
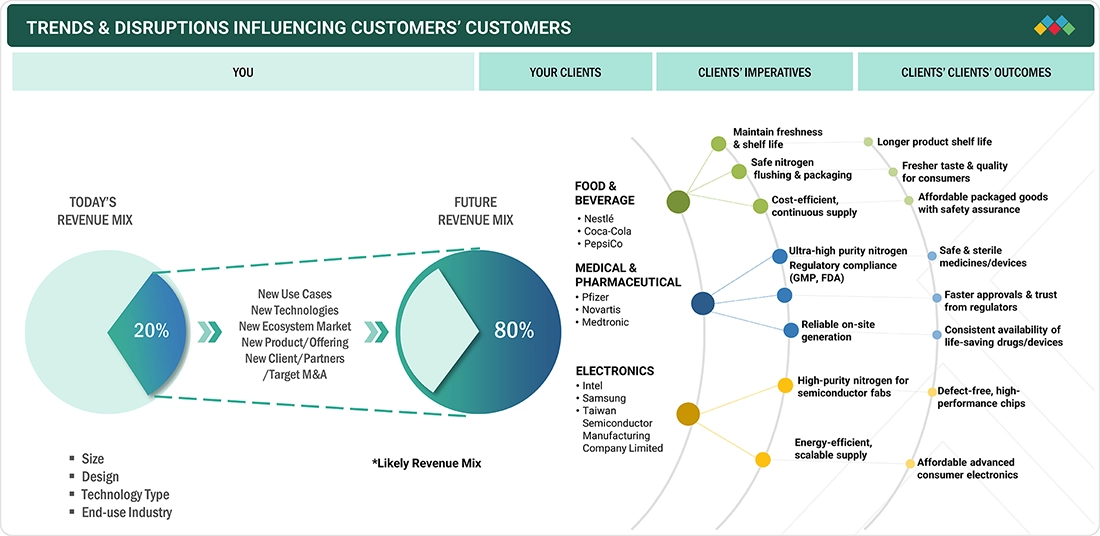
TRENDS & DISRUPTIONS IMPACTING CUSTOMERS' CUSTOMERS
The impact on consumers' business emerges from customer trends or disruptions. The industrial nitrogen generator market is undergoing a structural shift, with revenue diversification expected between 2024 and 2030, driven by new use cases, technologies, and ecosystem partnerships. The food & beverage, medical & pharmaceutical, and chemical sectors led in 2024, but electronics end-use industries are anticipated to capture a larger share by 2030. Leading clients such as Nestlé, Coca-Cola, Pfizer, and Samsung are prioritizing imperatives like ultra-high purity, regulatory compliance (GMP/FDA), cost-efficient supply, and reliable on-site generation, aligning outcomes with eco-friendly solutions, reduced emissions, and enhanced safety.
Source: Secondary Research, Interviews with Experts, MarketsandMarkets Analysis
MARKET DYNAMICS
Level
-
Rising demand for on-site nitrogen gas generators

-
Stringent quality and safety standards

Level
-
High initial capital investment

-
Limited awareness in developing regions

Level
-
Expansion of emerging markets

-
Customization and scalability of industrial nitrogen generator

Level
-
Technological complexity

-
Lack of a skilled workforce

Source: Secondary Research, Interviews with Experts, MarketsandMarkets Analysis
Driver: Rising demand for on-site industrial nitrogen generator
The industrial nitrogen generator market is being driven by the increase in transitioning to on-site nitrogen production for material supply that provides economic, operational, and environmental benefits compared to traditional bulk deliveries and gas cylinders. On-site systems are designed for uninterrupted supply and increase reliability while reducing costs by as much as 50% through a combination of eliminating logistics and cylinder rental fees and reducing gas losses. Additionally, because on-site systems allow for purity customization, they also increase efficiency and can reduce wastage. Beyond the economic benefits of on-site nitrogen systems, there are better safety aspects since there is less handling and the ability to enhance sustainability by eliminating energy wastage involved with transport and liquefaction. On-site generation systems can be flexible or scalable to meet the user's requirements, which is very appealing to many industries and helps drive growth in the market.
Restraint: High initial capital investment
The high upfront capital cost continues to be a significant limitation for the industrial nitrogen generator industry. The cost of the components required to purchase, install, and commission the generator could be substantial, as it often requires significant cost items such as a compressor, filtration unit, and advanced controls. Capital requirements could include additional infrastructure, including power connection requirements to make the system operational, so many businesses may struggle to justify the adoption costs, even if they have an immediate fulfillment requirement for nitrogen. Relatively small capital requirements, more lengthy payback periods, and additional ongoing maintenance or energy costs for operation often discourage buyers sensitive to price, especially for industries that are more conservative with technological advancements, often resulting in buyers continuing to rely on a traditional nitrogen supply.
Opportunity: Expansion of emerging markets
Emerging markets represent excellent growth opportunities for the industrial nitrogen generator market due to ongoing rapidly expanding industrialization and a need for cost-effective production methods. Additionally, sectors such as food & beverage, electronics, pharmaceuticals, and metal fabrication utilize a growing demand for high-purity nitrogen to reach their packaging, inerting, and processing requirements. On-site nitrogen generation via PSA or membrane technology provides a sustainable, low-cost alternative to using bottled or liquid nitrogen, and with all logistics costs reduced while improving efficiency, on-site nitrogen generators will also support environmental objectives while also following stricter regulations.
Challenge: Technological complexity
Technological complexity is a serious problem in the industrial nitrogen generator market because systems are integrating automation, IoT, and optimizations based on AI decision-making. While these innovations enhance the efficiency of gas production, they often require technical knowledge that small to medium-sized enterprises (SME) do not have. Also, installation of the systems and integration with production lines and compressed air systems can be tricky, and once delegated to their team, inadequate tech training can lead to lengthy downtimes or malfunctions in equipment. The integration of purity sensors, PLC interfaces, and IoT connectivity often requires involvement from an appropriate technical service, as treatment and calibration/updates of hardware and software are needed to make critical system settings, and for the unprepared or end user, this can be overwhelming and limit adoption.
Industrial Nitrogen Generator Market: COMMERCIAL USE CASES ACROSS INDUSTRIES
| COMPANY | USE CASE DESCRIPTION | BENEFITS |
|---|---|---|
 |
On-site membrane and PSA nitrogen generators for food packaging, beverage, and pharmaceutical industries | Continuous nitrogen supply, reduced gas procurement costs, compact design suitable for facility integration |
 |
Energy-efficient PSA nitrogen generators for electronics, metal fabrication, and laser cutting applications | High-purity nitrogen (up to 99.999%), reduced energy consumption, and lower operational costs |
 |
Modular nitrogen generators for automotive, chemical, and industrial manufacturing | Flexible design, scalable capacity, minimized downtime with reliable system integration |
 |
Advanced nitrogen generation solutions for oil & gas, healthcare, and electronics sectors | Stable high-purity nitrogen supply, enhanced safety, global service network with remote monitoring |
 |
On-site nitrogen generator systems for refining, petrochemicals, and food industries | Cost savings from on-site generation, consistent purity levels, reduced logistics, and cylinder handling |
Logos and trademarks shown above are the property of their respective owners. Their use here is for informational and illustrative purposes only.
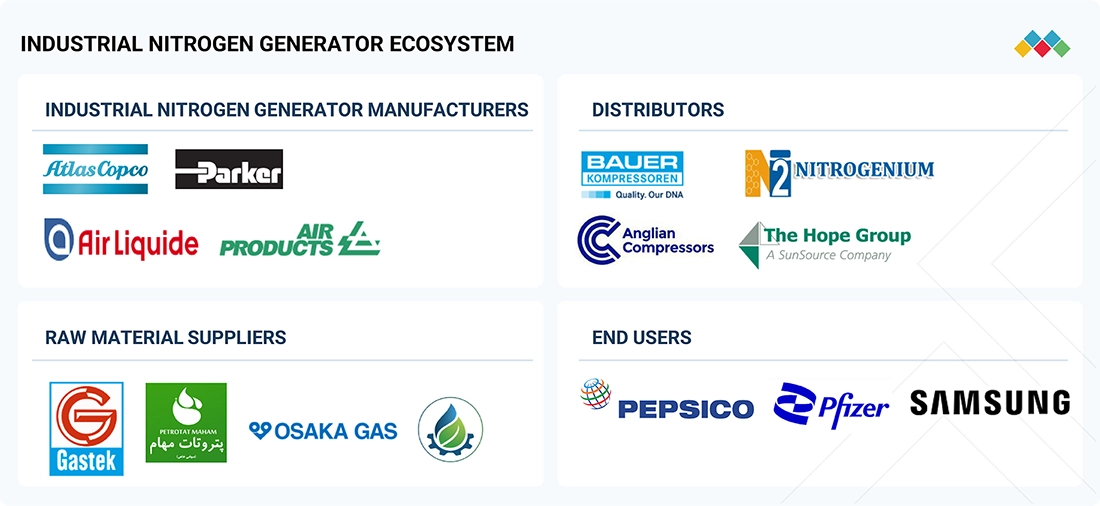
MARKET ECOSYSTEM
The industrial nitrogen generator ecosystem analysis involves identifying and analyzing interconnected relationships among various stakeholders, including raw material suppliers (Gastek Engineering), manufacturers (Parker Hannifin Corp, Air Products and Chemicals, Inc., Atlas Copco Group), distributors, and end users. The raw material suppliers provide metal to industrial nitrogen generator manufacturers. The distributors and suppliers establish contact between the manufacturing companies and end users to streamline the supply chain, increasing operational efficiency and profitability.
Logos and trademarks shown above are the property of their respective owners. Their use here is for informational and illustrative purposes only.
MARKET SEGMENTS
Source: Secondary Research, Interviews with Experts, MarketsandMarkets Analysis
Industrial Nitrogen Generator Market, By Size
The portable industrial nitrogen generator segment is projected to be the fastest-growing in the market due to its flexibility, mobility, and cost-effective uses in a variety of applications. Portable units, unlike stationary systems, can be transported and used in various settings such as remote locations, construction sites, oilfields, or in quick response situations. They eliminate the need for storage and use of nitrogen cylinders and remove logistical challenges of receiving and storing gases. Portable units have the capacity to provide gas on demand and allow a steady flow of gas without interruptions. Portable nitrogen generators have small dimensions, are low maintenance, and can benefit a range of industries, from food packaging to aerospace.
Industrial Nitrogen Generator Market, By Design
In the design category, plug & play industrial nitrogen generators are the most common due to operator convenience, quick setup, and low infrastructure requirements. They come as a pre-tested, fully integrated system that only needs the most essential connections, usually just electric power and compressed air lines, which saves setup time and, in turn, setup costs. Their modular and compact design is advantageous for sites that are already limited on space, as it supports incremental expansion of capacity. Moreover, setup times are minimized to eliminate downtime and do not require specific skilled technicians. While commonly found in both small to medium-sized enterprises (SME) and larger manufacturers, they are able to support decentralized supplies of nitrogen, and now include smart controls and remote monitoring capabilities, which reflect a growing trend in automation, while being cost-effective.
Industrial Nitrogen Generator Market, By Size
Membrane-based nitrogen generators are pegged to form the fastest-growing technology type segment due to their relative simplicity, reliability, and cost-effectiveness in multiple end-user industries. They operate based on the principle of using hollow fiber membranes to separate nitrogen from compressed air and deliver a continuous supply of gas for relatively low-energy consumption and operational complexity. They also have fewer moving parts than PSA systems, fewer maintenance and space requirements, and they are ideal for distributing nitrogen at decentralized or remote sites (e.g., oil & gas platforms), food packaging, and laboratories. Their compact modular design allows for flexible installation and scalability, applicability at purity levels from 95–99.5% depending on the process, and the ability to operate in extreme environments, all of which add to the desirability for accelerated adoption.
Industrial Nitrogen Generator Market, By End-use Industry
The food & beverage industry is estimated as the largest end-use sector in the industrial nitrogen generator market, as it has an important reliance on nitrogen to maintain product quality, safety, and shelf life. Nitrogen is mainly used in modified atmosphere packaging to reduce oxidation and microbial growth and to preserve items such as meat, produce, dairy, baked products, snacks, and ready-to-eat meals. It is also used for tank blanketing, line purging, and bottling beverages such as wine, beer, and soft drinks. Industries are transitioning to onsite generation with the increasing need for hygienic, cost-effective, on-demand supply of nitrogen, allowing for continuous food-grade nitrogen production and further solidifying its market position.
REGION
Asia Pacific to be fastest-growing region in global industrial nitrogen generator market during forecast period
The Asia Pacific region leads in the growth of the industrial nitrogen generator market, spurred by accelerated industrialization, expansion in manufacturing, and a quest for sustainable and more affordable gas solutions. With strong demand in food & beverage, electronics, pharmaceuticals, chemicals, and metals fabrication, nitrogen generators are being adopted in industrial applications such as purging, inerting, packaging, and blanketing. A growing trend toward automation and on-site generated nitrogen versus cylinders will reduce long-term costs. Additionally, supportive government policies and the high number of SMEs in the market continue to support growth. With a growing local manufacturing and service capability, along with a growing uptake of energy-efficient membrane and PSA systems, the Asia Pacific region will continue to dominate the industrial nitrogen generator market.
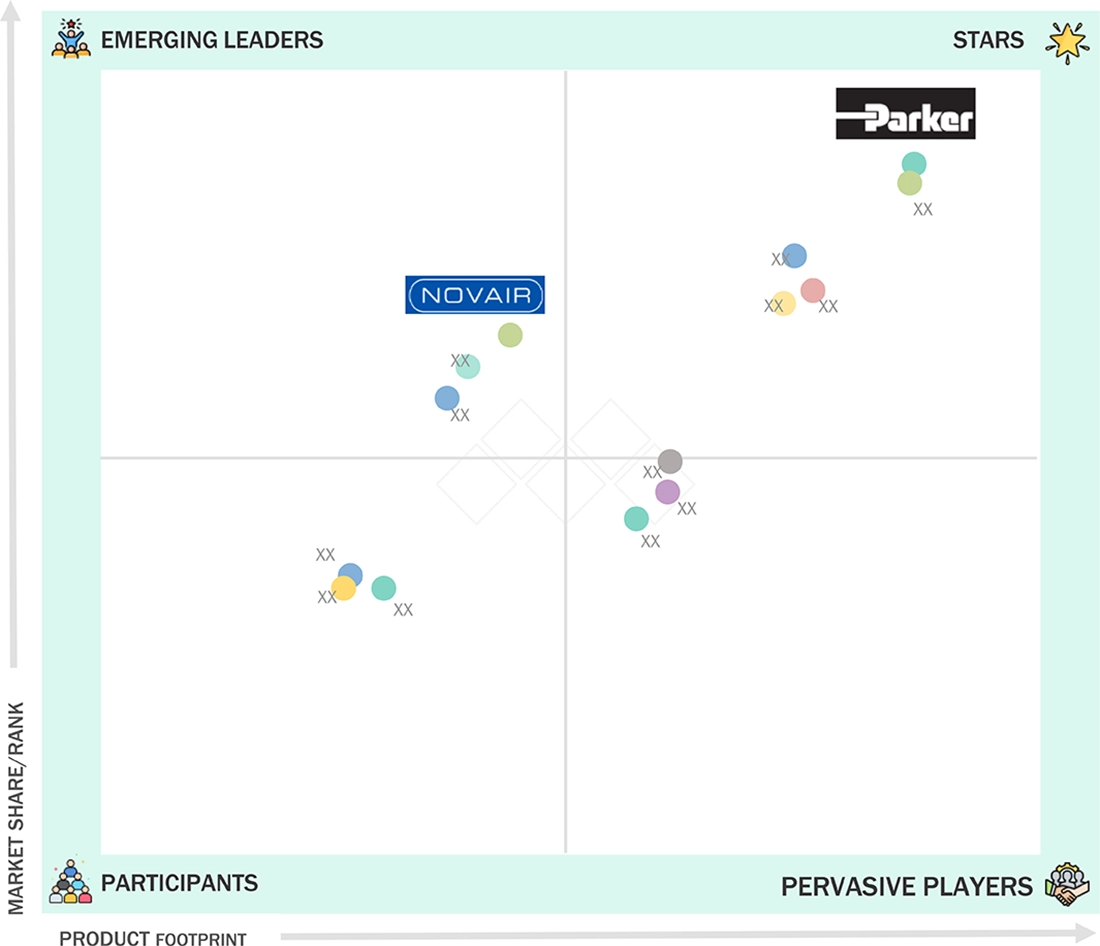
Industrial Nitrogen Generator Market: COMPANY EVALUATION MATRIX
In the industrial nitrogen generator market, Parker Hannifin (Star) is a global player and well-established leader with its broad portfolio of advanced PSA and membrane-based systems for multiple applications across food & beverage, pharmaceuticals, chemicals, and electronics. Parker Hannifin benefits from a robust brand reputation, considerable manufacturing capabilities, and an expansive global distribution system—all of which bolster its efforts to remain a leader in the category. At the same time, NOVAIR (Emerging Leader) is advancing quickly with innovative on-site nitrogen generation solutions and various cost-effective designs - all of which demonstrate clear potential to enter the leaders quadrant in the future.
Source: Secondary Research, Interviews with Experts, MarketsandMarkets Analysis
KEY MARKET PLAYERS
- Parker Hannifin Corp (US)
- Air Products and Chemicals, Inc. (US)
- Atlas Copco Group (Sweden)
- Ingersoll Rand (US)
- Air Liquide (France)
- Linde PLC (UK)
- Hitachi Industrial Equipment Systems Co., Ltd. (Japan)
- Inmatec (Germany)
- Novair SAS (France)
- OXYMAT A/S (Germany)
- Airpack (Netherlands)
- Claind (Italy)
- Compressed Gas Technologies, Inc. (US)
- Erre Due s.p.a. (Italy)
- Foxolution (South Africa)
MARKET SCOPE
| REPORT METRIC | DETAILS |
|---|---|
| Market Size, 2024 (Value) | USD 4.92 Billion |
| Market Forecast, 2030 (Value) | USD 6.79 Billion |
| Growth Rate | CAGR of 5.5% from 2025 to 2030 |
| Years Considered | 2022–2030 |
| Base Year | 2024 |
| Forecast Period | 2025–2030 |
| Units Considered | Value (USD Billion), Volume (Unit) |
| Report Coverage | Revenue forecast, company ranking, competitive landscape, growth factors, and trends |
| Segments Covered |
|
| Regions Covered | North America, Europe, Asia Pacific, Middle East & Africa, and South America |
WHAT IS IN IT FOR YOU: Industrial Nitrogen Generator Market REPORT CONTENT GUIDE
DELIVERED CUSTOMIZATIONS
We have successfully delivered the following deep-dive customizations:
| CLIENT REQUEST | CUSTOMIZATION DELIVERED | VALUE ADDS |
|---|---|---|
| US-based Industrial Nitrogen Generator Manufacturer |
|
|
| Portable Industrial Nitrogen Generator Composite Manufacturer |
|
|
| Food & Beverage Industrial Nitrogen Generator Customer |
|
|
| Cryogenic Based Industrial Nitrogen Generator |
|
|
RECENT DEVELOPMENTS
- March 2025 : Atlas Copco Group purchased MSS Nitrogen Ltd. and three affiliated companies to further strengthen its leadership in the on-site gas generation industry. MSS Nitrogen designs and manufactures nitrogen generators, gas mixers, and filtration systems for laser cutting applications. It has operational footprints in the UK and the US. The acquisition extended its range of products for the laser cutting sector as well as reinforced its position in nitrogen generation. The company was integrated into the Air and Gas Applications operations within the Compressor Technique Business Area. The acquisition enhanced Atlas Copco’s capabilities in nitrogen generator solutions and fulfilled part of its mandate to grow in highly demanded industrial applications.
- December 2024 : Atlas Copco Group acquired Metalplan Equipamentos LTDA, a Brazilian manufacturer involved in the manufacturing of gas generation, air treatment systems and solutions, screw compressors, chillers, and renewable energy solutions. The acquisition extended the original equipment manufacturer’s presence in the industrial gas generation segment, especially the nitrogen generator segment, by providing local manufacturing capacity and a much larger service footprint. Metalplan's broad product range and experience across various industries further supported Atlas Copco's strategy to offer integrated, on-site nitrogen solutions for its customers more efficiently in the region. Metalplan was integrated into the Industrial Air division under the Compressor Technique Business Area.
- June 2024 : Air Products and Chemicals, Inc. began its USD 70 million investment to expand its manufacturing, and logistics center in Maryland Heights, St. Louis, Missouri. This decision is the result of increasing demand for biogas, hydrogen recovery, nitrogen during aerospace processes, and cleaner marine fuels. The expansion increased the company's production capacity and assisted innovation for sustainable energy solutions and continued to invest in the local community. At the same time, Air Products is enhancing its global competitiveness, increasing customer demand, and, importantly, further supporting its leadership role in the energy transition space.
- November 2023 : Air Products launched its membrane-based nitrogen generation system. In 2024, more than 50 countries and over 2,000 vessels would adopt this vessel-based solution originally designed at its facility in Norway. The membrane-based nitrogen-generating system will enable shipowners to switch from heavy fuels to cleaner options and, therefore, reduce emissions at sea from vessels that burn high-sulfur fuels. This enhanced Air Products' leadership position as a supplier of marine gas solutions, extension of global market reach, and advancement of its mandate of sustainable energy and transitioning energy within the maritime market.
- April 2023 : Linde increased its nitrogen generator capacity at its Tangjeong facility in South Korea to accommodate Samsung Display's transition from LCD to OLED production. The company added a new SPECTRA plant producing above 2,000 tons/day of high-purity nitrogen for use in cooling and purging, with an investment of approximately USD 100 million.
Table of Contents
 Exclusive indicates content/data unique to MarketsandMarkets and not available with any competitors.
Methodology
The study involved four major activities for estimating the current size of the global industrial nitrogen generator market. Exhaustive secondary research was conducted to collect information on the market, the peer product market, and the parent product group market. The next step was to validate these findings, assumptions, and sizes with the industry experts across the value chain through primary research. Both the top-down and bottom-up approaches were employed to estimate the overall size of the industrial nitrogen generator market. After that, market breakdown and data triangulation procedures were used to determine the size of different segments and subsegments of the market.
Secondary Research
In the secondary research process, various secondary sources, such as D&B Hoovers, Factiva, Bloomberg BusinessWeek, and Dun & Bradstreet, were referred to identify and collect information for this study on the industrial nitrogen generator market. These secondary sources included annual reports, press releases & investor presentations of companies, white papers, certified publications, and articles by recognized authors, regulatory bodies, trade directories, and databases.
Primary Research
The industrial nitrogen generator market comprises several stakeholders in the supply chain, which include raw material suppliers, distributors, end-product manufacturers, buyers, and regulatory organizations. Various primary sources from the supply and demand sides of the markets have been interviewed to obtain qualitative and quantitative information. The primary participants from the demand side include key opinion leaders, executives, vice presidents, and CEOs of companies in the industrial nitrogen generator market. Primary sources from the supply side include associations and institutions involved in the industrial nitrogen generator market, key opinion leaders, and processing players.
Following is the breakdown of primary respondents:

To know about the assumptions considered for the study, download the pdf brochure
Market Size Estimation
The bottom-up and top-down approaches have been used to estimate the industrial nitrogen generator market by size, design, technology type, end-use industry, and region. The research methodology used to calculate the market size includes the following steps:
- The key players in the industry and markets were identified through extensive secondary research
- In terms of value, the industry’s supply chain and market size were determined through primary and secondary research processes
- All percentage shares, splits, and breakdowns were determined using secondary sources and verified through primary sources
- All possible parameters that affect the markets covered in this research study were accounted for, viewed in extensive detail, verified through primary research, and analyzed to obtain the final quantitative and qualitative data
- The research included studying reports, reviews, and newsletters of top market players and extensive interviews with leaders, such as directors and marketing executives, to obtain opinions
The following figure illustrates the overall market size estimation process employed for this study.

Data Triangulation
After arriving at the overall size of the industrial nitrogen generator market from the estimation process explained above, the total market was split into several segments and subsegments. The data triangulation and market breakdown procedures were employed, wherever applicable, to complete the overall market engineering process and arrive at the exact statistics for all segments and subsegments. The data was triangulated by studying various factors and trends from both the demand and supply sides. Along with this, the market size was validated using both the top-down and bottom-up approaches.
Market Definition
The industrial nitrogen generator refers to the global industry related to the production, distribution, and implementation of systems to produce nitrogen gas on-site for industrial purposes. These systems incorporate a variety of technologies, including pressure swing adsorption (PSA), membrane separation, and cryogenic distillation, which are used to separate nitrogen from atmospheric air. Industrial nitrogen generators are used across a variety of industries, including food and beverage, pharmaceuticals, chemicals, electronics, and oil & gas. Applications include inerting, blanketing, and packaging, among others. Industrial nitrogen generator market participants include original equipment manufacturers, technology providers, and service providers. This is a growing demand market seeking low-cost, low-energy, and continuous nitrogen supply for many different production processes.
Stakeholders
- Industrial Nitrogen Generator Manufacturers
- Raw Material Suppliers
- Regulatory Bodies and Government Agencies
- Distributors and Suppliers
- End-use Industries
- Associations and Industrial Bodies
- Market Research and Consulting Firms
Report Objectives
- To define, describe, and forecast the size of the industrial nitrogen generator market in terms of value and volume
- To provide detailed information regarding the key factors influencing the growth of the market (drivers, restraints, opportunities, and challenges)
- To forecast the market size based on size, design, technology type, end-use industry, and region
- To forecast the market size for the five main regions—North America, Europe, Asia Pacific (APAC), South America, and the Middle East & Africa (MEA), along with their key countries
- To strategically analyze micromarkets with respect to individual growth trends, prospects, and contributions to the total market
- To analyze the opportunities in the market for stakeholders and provide details of the competitive landscape for the market leaders
- To strategically profile leading players and comprehensively analyze their key developments, such as product launches, expansions, and deals in the Industrial nitrogen generator market
- To strategically profile the key players and comprehensively analyze their market shares and core competencies
- To study the impact of AI/Gen AI on the market under study, along with the macroeconomic outlook
Key Questions Addressed by the Report
Which factors are propelling the growth of the industrial nitrogen generator market?
Rising demand for on-site nitrogen gas generators, stringent quality and safety standards, and growth of industries such as metal fabrication, oil & gas, and chemical processing are the primary factors propelling the growth of the industrial nitrogen generator market.
What are the major challenges to the growth of the industrial nitrogen generator market?
Technological complexity and lack of a skilled workforce are the major challenges impacting the growth of the industrial nitrogen generator market.
What are the major opportunities in the industrial nitrogen generator market?
Expansion of emerging markets and customization and scalability of industrial nitrogen generators are expected to create lucrative opportunities for players in the industrial nitrogen generator market in the coming years.
What are the major factors restraining the growth of the industrial nitrogen generator market?
High initial capital investment and limited awareness in developing regions are the major factors restraining the growth of the industrial nitrogen generator market.
Who are the major players in the industrial nitrogen generator market?
Major players include Parker Hannifin Corp (US), Air Products and Chemicals, Inc. (US), Atlas Copco Group (Sweden), Ingersoll Rand (US), and Air Liquide (France).
Need a Tailored Report?
Customize this report to your needs
Get 10% FREE Customization
Customize This ReportPersonalize This Research
- Triangulate with your Own Data
- Get Data as per your Format and Definition
- Gain a Deeper Dive on a Specific Application, Geography, Customer or Competitor
- Any level of Personalization
Let Us Help You
- What are the Known and Unknown Adjacencies Impacting the Industrial Nitrogen Generator Market
- What will your New Revenue Sources be?
- Who will be your Top Customer; what will make them switch?
- Defend your Market Share or Win Competitors
- Get a Scorecard for Target Partners

Custom Market Research Services
We Will Customise The Research For You, In Case The Report Listed Above Does Not Meet With Your Requirements
Get 10% Free CustomisationTESTIMONIALS

We at Nissan Chemicals Corporation have been clients of MarketsandMarkets for more than a year now. We recently consulted MarketsandMarkets for a study, the team at MarketsandMarkets was extremely professional and organized. The business insights were very detailed and aligned well with our expectations that really helped us formulate the Business Plans and device new strategies for development themes. MarketsandMarkets offers a unique combination of expertise and dedicated engagement model. Their research findings have helped us in designing our Pricing Strategy which will make it easier for us to predict the future sales and profits for the next ten years. We look forward to working with MarketsandMarkets in the future.
VP of Strategy & New Business Development
Leading Specialty Chemical Company
The MarketsandMarkets Engagement Model, composed of both the Knowledge Store and advisory custom research, has greatly helped us in understanding our markets and making strategic decisions. The Knowledge Store is a fast way to allow everyone in our organization to understand more about most any market they are interested in. The ability to then get custom research done and get answers to specific strategic questions and market insight has been spectacular. The Markets and Markets team feel more like colleagues than vendors and their services have helped us change our culture where statements of things like growth opportunities and competitive position are always backed by industry research.

Rich Gibson,
Director, Corporate Strategy
Milliken & Company,
Leading Industrial Manufacturer of specialty chemical, floor covering, performance and protective textile materials, and healthcaremilliken.com
MarketsandMarkets is a trusted resource that helps us to better understand markets that are near-adjacencies-whether its technology, value chain or geography. Their Knowledge Store platform provides a dashboard of markets and their characteristics which is easy to use and saves us time.
Adam Shaw,
Market Development and Strategy Manager
AdvanSix Inc. USA,
An American Leader in Chemicalswww.advansix.com
The Knowledge Store from MarketsandMarkets is a valuable tool which has helped my team acquire greater insight in to the end markets that our business serves. This has enabled us to help our company build stronger strategies throughout our planning process.
TOSHIO KINOSHITA
Senior Chif Consultion Research & Consulting Division
Mitsubishi Chemical Research Corporation,
Leading Manufacturer of Chemical Productswww.mitsubishichem-res.co.jp/en/

We recently engaged with MarketsandMarkets for a study, the team not only clearly understood our business objectives but was also extremely professional in the way they handled the entire project. The study was efficiently conducted in a phase-wise manner, and the engagement model furnished us with high-quality business insights that far exceeded our expectations at each phase. We were especially happy that MarketsandMarkets could provide us with both, an English as well as a Japanese version of the study. A special thanks to the Analyst Team and Client Services Team, whose fluency in Japanese enhanced our comfort level, as we could converse with them in our preferred language.
Independent entrepreneurs
Arrow Precision
We approached MarketsandMarkets for study on Proppants Market, and their work exceeded our expectations. The study conducted was comprehensive and enabled us to view the market through the various dimensions. In addition, the team was extraordinarily responsive throughout the process and resolved our queries on time. I strongly recommend MarketsandMarkets and will certainly consider them for additional market assessments we will need in the future.
Global engineering company, Japan
Deputy Manager,
Strategic Planning OfficeThe high-quality insights shared by the MarketsandMarkets team helped us understand the pharmaceutical plant designers in a specific geography. It also captured the risks that we may likely face in communicating with our potential partners. The study would enable us identify partners, which would impact our future growth.


Growth opportunities and latent adjacency in Industrial Nitrogen Generator Market