Industrial Oxygen Generator Market by Gas Type and Flow Rate (Industrial oxygen, Medical Oxygen), Size (Stationary, Portable), Design (Cylinder, Plug & Play), Technology (Pressure Swing Adsorption (PSA) Based Generator, Membrane-Based Generator, Cryogenic-Based Industrial Generator), End-Use Industry, and Region - Global Forecast to 2030

icon1
USD 10.05 BN
MARKET SIZE, 2030
icon2
CAGR 8.3%
(2025-2030)
icon3
300
REPORT PAGES
icon4
230
MARKET TABLES

INDUSTRIAL OXYGEN GENERATOR MARKET OVERVIEW

Source: Secondary Research, Interviews with Experts, MarketsandMarkets Analysis

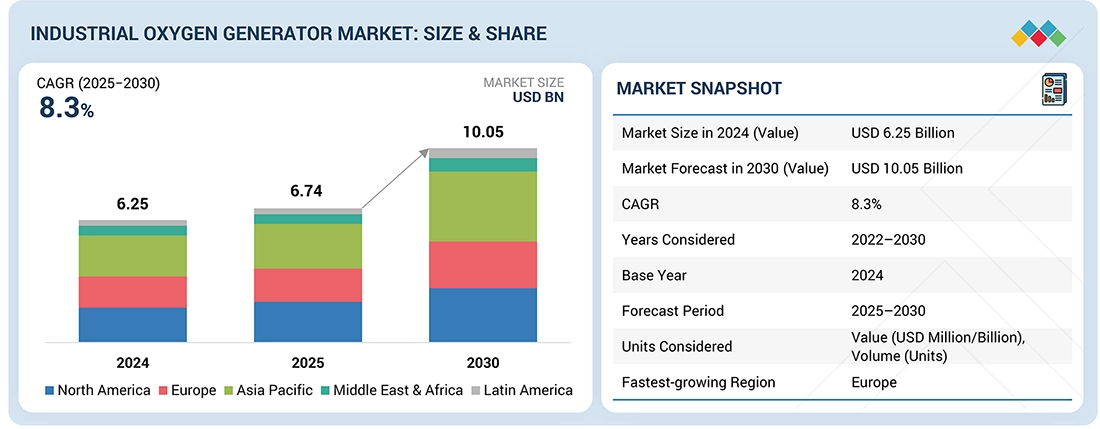
The market for industrial oxygen generators is predicted to rise from USD 6.75 billion in 2025 to USD 10.05 billion in 2030, at a CAGR of 8.3%. The industrial oxygen generator market is driven by increasing demand across various industries due to technological advancements and a focus on efficiency. These generators use methods like pressure swing adsorption (PSA), membrane-based systems, and cryogenic processes to produce oxygen. Manufacturers can customize these systems to meet specific needs in sectors like healthcare and industry. As the demand for on-site oxygen production grows for operational efficiency and environmental benefits, the need for advanced oxygen generation technology is expected to rise.

KEY TAKEAWAYS

  • By Gas Type and Flow Rate
    Industrial oxygen generators form the faster-growing segment over medical oxygen generators. Industrial oxygen generation demands solutions across varied flow rate ranges to match sector-specific needs. Small units serve niche operations with precise oxygen delivery, mid-range systems support medium-scale industries with modular, cost-efficient designs, and high-capacity plants power large-scale sectors like petrochemicals, glass, and metals with reliable, automated performance.
  • By Size
    Stationary oxygen generators are estimated to account for the larger market share in the industrial oxygen generator market primarily because they are best suited for industries that require a continuous and large-volume oxygen supply, such as steel, chemicals, and water treatment. These systems offer cost efficiency by eliminating the need for purchasing and transporting oxygen cylinders or liquid oxygen, making them more economical over time despite higher initial investment.
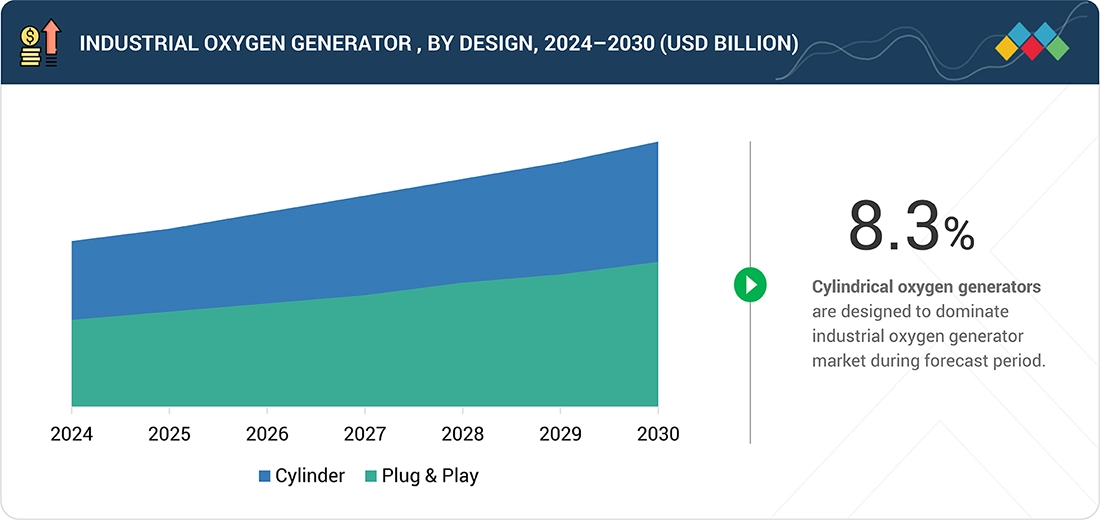
  • By Design
    Cylinder-based oxygen generators are estimated to account for the larger market share by size in the industrial oxygen generator market, mainly due to their wide applicability, convenience, and established distribution infrastructure. These systems are commonly used across diverse industries such as healthcare, welding, metal fabrication, food processing, and small-scale manufacturing, where on-site generation is not feasible or cost-effective.
  • By Technology
    Pressure swing adsorption (PSA) technology is estimated to account for the largest market share in the industrial oxygen generator market because it offers the best balance of efficiency, reliability, and cost-effectiveness for on-site oxygen production. PSA systems can generate oxygen with high purity levels (typically 90–99%) directly from ambient air, making them ideal for a wide range of industrial applications such as metal cutting, glass manufacturing, wastewater treatment, and chemical processing.
  • By End-use Industry
    The medical & healthcare end use industry is set to register the highest market share during the forecast period. In the health and medical fields, oxygen generators are designed to provide on-demand, continuous high-purity oxygen in accordance with strict biomedical and regulatory requirements for hospitals, clinics, emergency care departments, and pharmaceutical producers. Manufacturers include considerations for reliability, redundancy, and maintenance of the systems to support continuous patient care, while also maintaining small footprints to fit limited medical physical infrastructure.
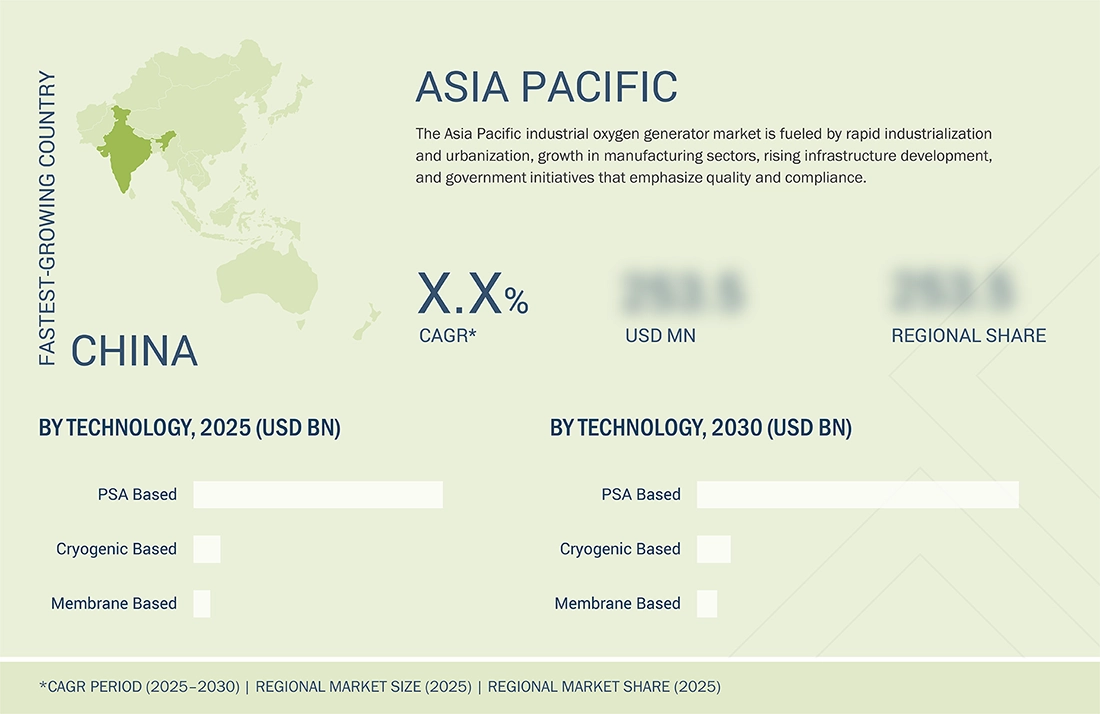
  • By Region
    The industrial oxygen generator market is led by Asia Pacific based on the industrial demand for oxygen as it is home to the largest manufacturing regions in the world.
  • Competitive Landscape
    Leading companies in the industrial oxygen generator market are embracing both organic and inorganic strategies, including exciting partnerships and smart investments, to satisfy the growing demand across innovative applications. Notable players like Air Liquide (France), Air Products and Chemicals, Inc. (US), Atlas Copco (Sweden), and Linde plc (UK) are actively collaborating to improve their product offerings, showcasing their commitment to innovation and customer satisfaction.

The industrial oxygen generator market is experiencing steady growth, fueled by rising demand across industries for reliable, high-purity, and cost-efficient oxygen supply. Drivers include the need to enhance operational efficiency, reduce dependency on bulk cylinder logistics, and comply with strict environmental and safety standards. Market dynamics are being reshaped by new collaborations between equipment manufacturers and end-use industries, investments in energy-efficient generation technologies, and innovations such as smart plug-and-play systems and hybrid PSA–membrane solutions.

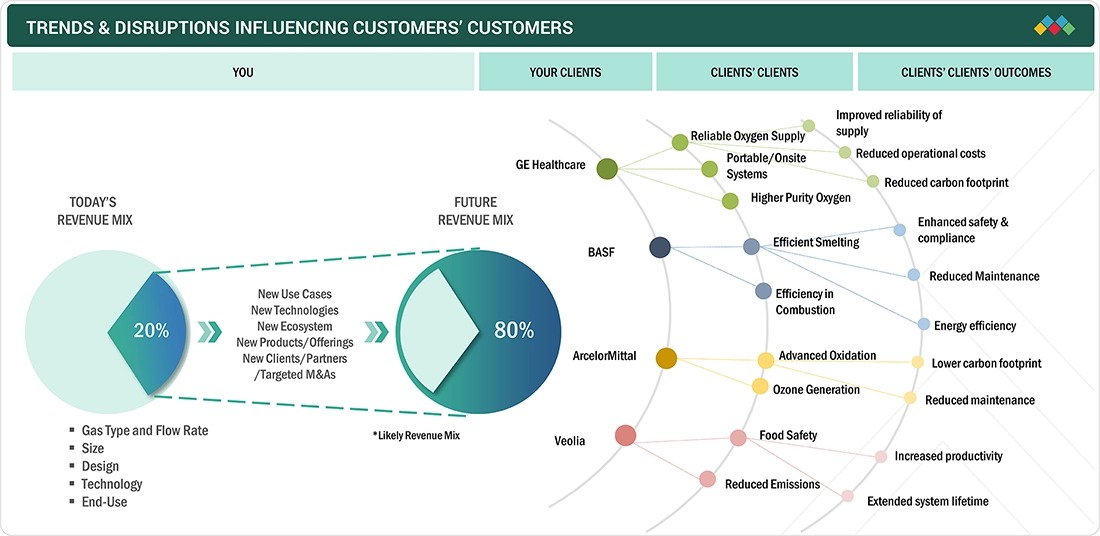
TRENDS & DISRUPTIONS IMPACTING CUSTOMERS' CUSTOMERS

Industrial oxygen generators are vital for daily operations across multiple industries, including healthcare, metal processing, chemicals & petrochemicals, aquaculture, oil & gas, manufacturing, and packaging. Healthcare remains one of the most important applications, alongside metal fabrication, wastewater treatment, chemical processing, and aquaculture oxygenation. Growing demand for reliable, high-purity oxygen in both industrial and medical settings and the need for energy-efficient on-site production are driving adoption in both developed and emerging economies. Increased urbanization, expanding industrial activity, and growing healthcare infrastructure in countries such as Brazil, India, China, and throughout the ASEAN region are expected to further boost market growth, as industries aim to reduce reliance on bulk oxygen deliveries and enhance operational resilience.

Source: Secondary Research, Interviews with Experts, MarketsandMarkets Analysis

INDUSTRIAL OXYGEN GENERATOR MARKET DYNAMICS

Drivers
Impact
Level
  • Rising development of healthcare infrastructure
  • Increasing prevalence of chronic respiratory diseases
RESTRAINTS
Impact
Level
  • Stringent compliance standards
OPPORTUNITIES
Impact
Level
  • Increasing demand in aquaculture industry
  • Rising demand for high-purity oxygen in ozone generation
CHALLENGES
Impact
Level
  • High installation and integration costs
  • Specialized Maintenance Needs

Source: Secondary Research, Interviews with Experts, MarketsandMarkets Analysis

Driver: Rising development of healthcare infrastructure

The growth of government healthcare infrastructure, coupled with coordinated investments from international donors and development organizations, is significantly driving the oxygen generator market. On-site oxygen generation systems have become essential medical assets globally, particularly in emerging economies, as they provide a dependable, cost-effective source of oxygen that operates independently from centralized health systems. The US government, for instance, has donated oxygen generation plants to Peru in response to the COVID-19 third wave, while Ghana has launched a new liquid oxygen plant. Additionally, Unitaid's Oxygen Access Program in East Africa is now securing an initial USD 22 million in capital funding for further expansion into Tanzania, following its successful launch in Kenya in October 2024.

Restraint: Stringent compliance standards

The global oxygen generator market suffers from strict and complex regulations in all key markets that impact commercialization timelines, costs of operations, and product development timelines. In Europe, medical oxygen generators are defined as medical devices in the Medical Device Regulation (MDR) 2017/745 and the previous Directive 93/42/EEC, including ISO 10083 for the plant specification and also requiring compliance with European Pharmacopoeia medical oxygen 93 for purity. Manufacturers must have ISO 13485 certification and plan on redundant sources for safety.

Opportunity: Increasing demand in aquaculture industry

The aquaculture industry presents significant growth potential for oxygen generator products, with a portion of the need for high-purity oxygen for fish health, growth, and sustainable operations within the industry. Leading manufacturers, through strategic alliances or technologies, continue to take the lead in the niche. OXYMAT has developed a unique aquaculture-oriented suite of product offerings, both modular PSA systems and frame-mounted X-series units and Nordic configurations designed to provide flexibility, application, and reliability in land-based or offshore aquaculture. The partnership with Oxzo, a Norwegian aquaculture oxygenation company, is advancing energy-efficient oxygenation systems that improve the operational efficiencies and sustainability for fish operations.

Challenge: High installation and integration costs

The oxygen generator market continues to face challenges from limited parts availability and servicing network capacity, which impact uptime and reliability. Delays in sourcing spare parts can exacerbate downtime, decrease oxygen purity, lead to no gas availability, and interrupt medical and industrial work. In healthcare, disruptions can endanger patient safety, while in industrial environments, interruptions result in loss of production. Challenges sourcing spare parts in a robust supply chain significantly deteriorate oxygen concentration output and performance overall.

Industrial Oxygen Generator Market: COMMERCIAL USE CASES ACROSS INDUSTRIES

COMPANY USE CASE DESCRIPTION BENEFITS
Uses oxygen generators to supply medical-grade oxygen for hospitals, clinics, and mobile healthcare units Reliable on-site supply, reduced dependence on cylinders, ensures compliance with medical standards
Deploys oxygen generators in chemical processing and oxidation reactions within specialty chemical plants Continuous high-purity oxygen flow, improved process efficiency, lower logistics and energy costs
Integrates oxygen generators into steelmaking and metallurgy operations for combustion, oxidation, and decarburization Enhanced furnace efficiency, reduced fuel consumption, consistent oxygen availability on-site
Utilizes oxygen generators in wastewater treatment plants for aeration and biological processes Improved water quality, reduced chemical usage, sustainable operations, lower operating costs

Logos and trademarks shown above are the property of their respective owners. Their use here is for informational and illustrative purposes only.

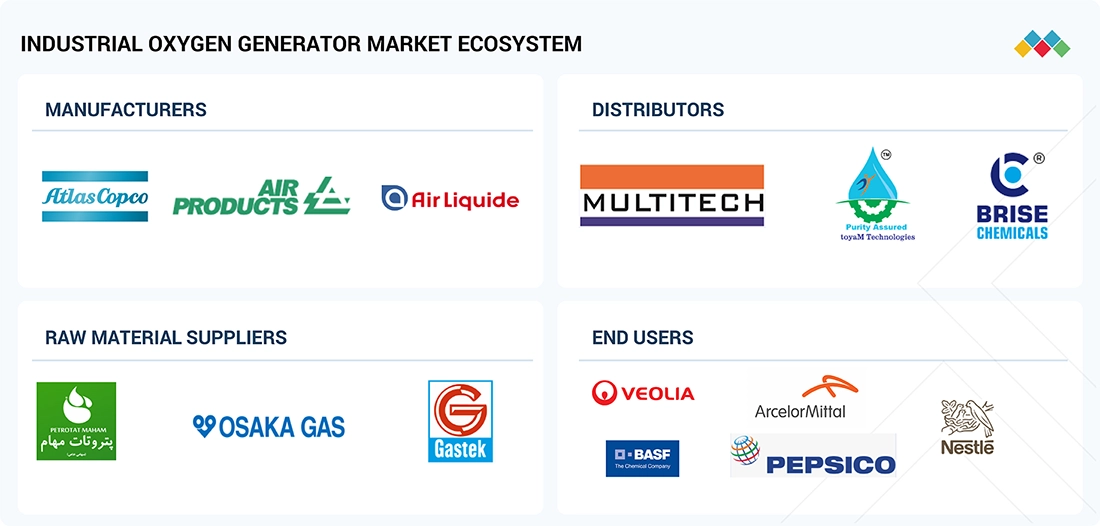
INDUSTRIAL OXYGEN GENERATOR MARKET ECOSYSTEM

The industrial oxygen generator ecosystem consists of a complicated network of component suppliers, technology partners, manufacturers, system integrators, service providers, and end users. The main components consist of air compressors, filtration equipment, oxygen generation device (PSA or membrane), control panel, and storage tank. Technology partners offer automation, IoT, and AI enhancements that will improve efficiency and monitoring capabilities. Manufacturers can assemble configurable generators based on specific customer needs within the industry, while integrators will introduce the ambient oxygen to production line activities. Service providers provide up-front consultation and ongoing installation, maintenance, and technical support. End-users derive from all industries, including food processing, pharmaceuticals, electronics, and metal fabrication, which are all potential players, as are regulators, government policies, and sustainability standards that influence development and market viability.

Logos and trademarks shown above are the property of their respective owners. Their use here is for informational and illustrative purposes only.

INDUSTRIAL OXYGEN GENERATOR MARKET SEGMENTS

Source: Secondary Research, Interviews with Experts, MarketsandMarkets Analysis

Industrial Oxygen Generator Market, by Gas Type and Flow Rate

The medical oxygen generator sector must focus on reliability, compliance, and patient safety across various flow rates. For lower flow applications (up to 2 NM3/HR), compact, portable, or modular devices are essential for use in rural clinics, emergency response, and specialized care, requiring easy deployment, redundancy, and continuous oxygen supply. In the mid-capacity range (2.1–14 NM3/HR), there is a growing demand from mid-sized hospitals and regional facilities, necessitating a balance between scalable flow rates and features such as built-in purification, monitoring systems, and alarms, while ensuring regulatory compliance.

Industrial Oxygen Generator Market, by Size

Manufacturers of stationary oxygen generators regard these systems as essential infrastructure assets due to their reliability, scalability, and operational efficiency. These generators ensure a continuous and uninterrupted supply of oxygen for various infrastructures, typically in settings that are less critical than their original applications, such as large medical centers, industrial workplaces, and municipal utilities. Industry leaders like Air Liquide offer advanced solutions, including UPOX VSA and FLOXAL O2 VSA and PSA Oxygen Generators, which deliver high-purity oxygen consistently. Additionally, Linde plc provides PSA Oxygen Plants designed for on-site production of oxygen at 93% purity, ensuring seamless integration with facility gas grids.

Industrial Oxygen Generator Market, by Design

While developing cylinder-based oxygen solutions, manufacturers must prioritize durability, effective refill logistics, and the retention of saleable purity over extended periods to withstand the demands of the cylinder refilling process. Key design considerations include the engineering of pressure vessels, ensuring portability and usability, and adhering to international safety standards for gas transportation containers. One notable advantage of oxygen cylinders is their function as independent energy sources, enabling immediate utilization of high-pressure gas upon demand, which supports unique operational mechanics within the using facility.

Industrial Oxygen Generator Market, by Technology Type

Pressure swing adsorption (PSA) technology dominates the oxygen generator market due to its optimal balance of cost, efficiency, and versatility across various industries. Unlike cryogenic systems, which require substantial capital investment and are primarily designed for large-scale production, PSA units are more economical and easier to install, operate, and maintain. They enable onsite oxygen generation, thereby reducing dependence on bulk suppliers and cylinders, which leads to significant savings in logistics and operational costs. PSA systems typically produce oxygen with a purity level of 90–95%, a range that meets the requirements for diverse applications in healthcare, metal processing, water treatment, aquaculture, and food packaging.

Industrial Oxygen Generator Market, by End Use

In the health and medical sectors, oxygen generators are meticulously engineered to deliver on-demand, continuous high-purity oxygen, adhering to stringent biomedical and regulatory standards required by hospitals, clinics, emergency care departments, and pharmaceutical manufacturers. Manufacturers prioritize reliability, redundancy, and system maintenance to ensure uninterrupted patient care while accommodating space constraints inherent in medical facilities. The Air Liquide FLOXAL O2, available in VSA-i, SIGMA, and PSA formats, enables medical institutions to generate their own oxygen on-site, thereby enhancing supply security and minimizing reliance on bulk deliveries.

REGION

Asia Pacific to be fastest-growing region in industrial oxygen generator market during forecast period

The industrial oxygen generator market exhibits substantial growth in the Asia Pacific region, driven by robust industrial demand and economic expansion, as well as significant infrastructure development initiatives. This region, which encompasses China, India, Japan, and South Korea, serves as a critical hub for some of the largest manufacturing sectors globally. Industries that exhibit a high demand for substantial volumes of gases and a reliable supply of oxygen include steelmaking, metal processing, chemicals, glass production, shipbuilding, pulp and paper manufacturing, and wastewater treatment. This diverse industrial landscape underscores the vital importance of oxygen generators in facilitating various manufacturing and processing operations throughout the region.

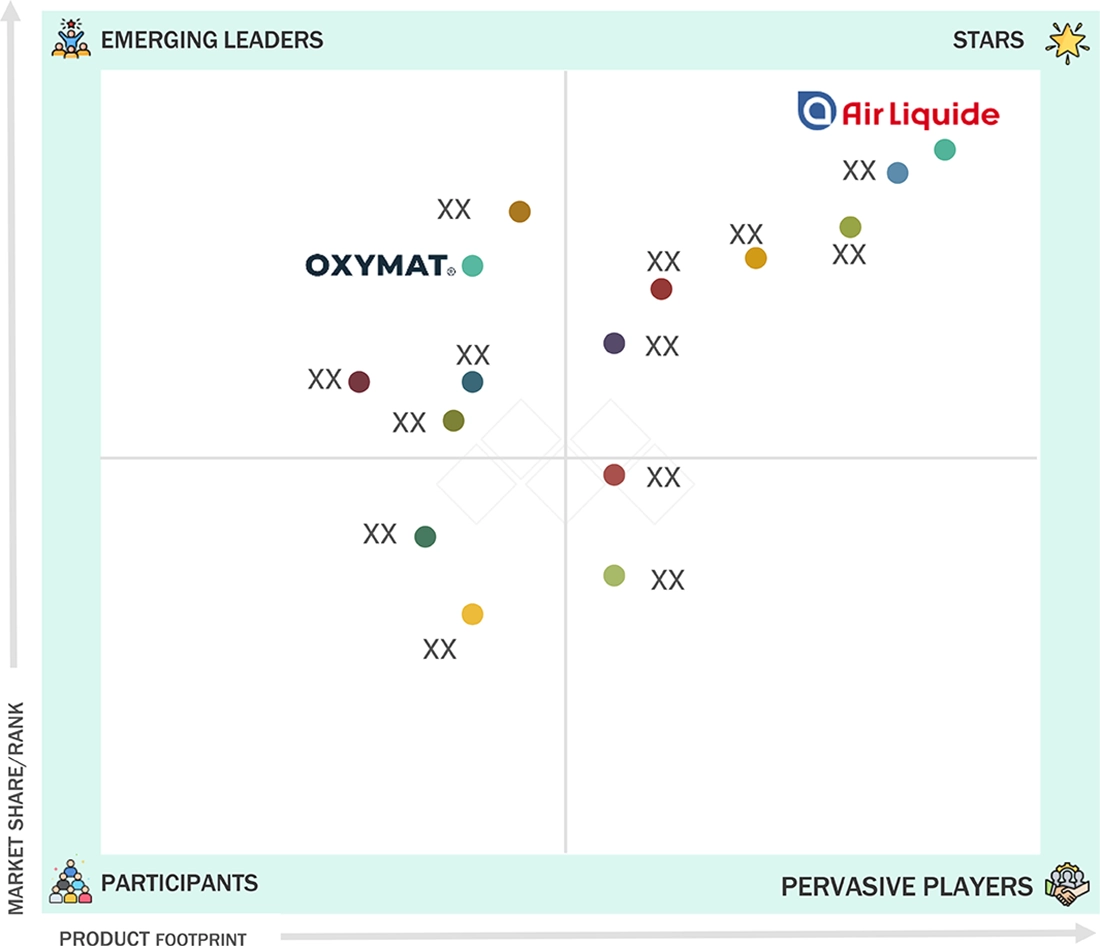
Industrial Oxygen Generator Market: COMPANY EVALUATION MATRIX

In the oxygen generator market matrix, Air Liquide (Star) leads with a strong market share and a broad product portfolio, supported by its advanced PSA and cryogenic oxygen generation systems that are widely adopted across medical, industrial, and energy sectors. Oxymat (Emerging Leader) is steadily gaining recognition with its specialized PSA solutions and customized systems designed for diverse applications, strengthening its position through innovation and tailored offerings. While Air Liquide dominates through scale, global presence, and a diverse range of technologies, Oxymat shows strong potential to move toward the leaders’ quadrant as demand for onsite and modular oxygen generation solutions continues to rise across end-use industries.

Source: Secondary Research, Interviews with Experts, MarketsandMarkets Analysis

INDUSTRIAL OXYGEN GENERATOR MARKET SCOPE

REPORT METRIC DETAILS
Market Size, 2024 (Value) USD 6.25 Billion
Market Forecast, 2030 (value) USD 10.05 Billion
Growth Rate CAGR of 8.3% from 2025 to 2030
Years Considered 2022–2030
Base Year 2024
Forecast Period 2025–2030
Units Considered Value (USD Million), Volume (Units)
Report Coverage Revenue Forecast, Company Ranking, Competitive Landscape, Growth Factors, and Trends
Segments Covered
  • By Gas Type and Flow Rate:
    • Industrial Oxygen
    • Medical Oxygen
  • By Size:
    • Stationary Oxygen Generators
    • Portable Oxygen Generators
  • By Design:
    • Cylinder
    • Plug & Play
  • By Technology Type:
    • Pressure Swing Adsorption (PSA)-based Generators
    • Membrane-based Generators
    • Cryogenic-based Industrial Generators
  • By End-use Industry:
    • Medical & Healthcare
    • Chemicals & Petrochemicals
    • Metal Processing & Mining
    • Power Generation
    • Water Treatment
    • Aquaculture
    • Other End-use Industries
Regions Covered North America, Asia Pacific, Europe, South America, Middle East & Africa

WHAT IS IN IT FOR YOU: Industrial Oxygen Generator Market REPORT CONTENT GUIDE

DELIVERED CUSTOMIZATIONS

We have successfully delivered the following deep-dive customizations:

CLIENT REQUEST CUSTOMIZATION DELIVERED VALUE ADDS
Medical Gas Equipment Manufacturer (US)
  • Competitive benchmarking of PSA vs cryogenic vs membrane oxygen generator technologies
  • Analysis of hospital demand trends (urban vs rural, centralized vs decentralized)
  • US FDA & ISO certification pathway mapping
  • Identify high-growth healthcare clusters for targeted sales
  • Strengthen regulatory compliance positioning
  • Optimize technology offering for market-specific requirements
Industrial Gases Company (Global Player)
  • Regional market sizing for on-site vs delivered oxygen (steel, glass, paper, chemicals)
  • Price benchmarking across capacity segments (Nm³/hr)
  • Strategic partnerships & M&A tracker (2020–2025)
  • Enhance pricing strategies by market maturity & segment
  • Uncover inorganic growth opportunities
  • Inform investment in local production hubs
Aquaculture Solutions Provider
  • Demand forecast for oxygen generators in fish farming (by region & water type)
  • Energy consumption and OPEX benchmarking of available systems
  • Competitive analysis of dissolved oxygen system vendors
  • Unlock new revenue streams in fast-growing aquaculture markets
  • Offer cost-effective, energy-efficient solutions
  • Position as sustainability enabler for precision aquaculture
Oxygen Generator OEM (India-based)
  • Trade flow analysis: Imports/exports of oxygen generator components (compressors, zeolites)
  • Local competitor mapping and distributor channel profiling
  • Government policy impact (PLI schemes, healthcare infra push)
  • Refine go-to-market strategy for public & private sectors
  • Expand distributor footprint in underserved regions
  • Align product roadmap with policy-driven demand
Hospital Infrastructure EPC Contractor (MENA)
  • Installed base mapping of oxygen generators in hospitals by GCC country
  • Procurement model benchmarking: leasing vs ownership
  • Technology partner analysis: local vs international OEMs
  • Win bids with data-backed procurement strategies
  • Secure cost advantages through regional sourcing
  • Streamline vendor evaluation and technology fit

RECENT DEVELOPMENTS

  • June 2025 : Air Liquide’s USD-200-million investment in modernizing its Louisiana ASU and expanding pipeline infrastructure supports a long-term oxygen and nitrogen supply contract with Dow, enhancing delivery efficiency and reliability. This development strengthened Air Liquide’s foothold in the onsite oxygen generation market by expanding its pipeline network and capacity to serve large industrial clients along the Gulf Coast.
  • June 2024 : Air Liquide planned to invest up to USD 850 million to build four large modular air separation units in Baytown, TX, supporting ExxonMobil’s low-carbon hydrogen project and boosting its oxygen capacity in Texas by 50%, marking its largest-ever industrial investment. This strengthened Air Liquide’s position in the oxygen generators market by expanding low-carbon production capacity and reinforcing its leadership in sustainable industrial gas solutions in the US.
  • October 2024 : Linde announced that it has started supplying industrial gases to PT Freeport Indonesia, a major mining company. Linde invested USD 120 million to build, own, and operate a new on-site air separation unit (ASU), the largest in Indonesia and Linde’s biggest in Southeast Asia. This ASU supplies oxygen and nitrogen to PT Freeport’s new copper smelter and refining facility in Manyar, one of the largest copper processing sites globally.
  • September 2023 : The Air Products and Chemicals, Inc. announced that it will supply advanced oxygen generation equipment for a wastewater treatment plant in Montreal, Canada. This project aimed at enhancing the plant’s oxygen supply capabilities, improving the efficiency and environmental performance of wastewater treatment processes. The partnership demonstrated Air Products' commitment to providing innovative solutions for sustainable water treatment infrastructure.
  • December 2022 : Atlas Copco acquired Shandong Meditech Medical Technology, a Chinese company specializing in manufacturing oxygen generators and onsite oxygen generation solutions for medical and home use. Founded in 2003 with about 70 employees, Shandong Meditech was a well-established brand in one of the world's largest healthcare oxygen markets. The acquisition would enhance Atlas Copco's product portfolio and global service reach through its Medical Gas Solutions Division.


Table of Contents

Exclusive indicates content/data unique to MarketsandMarkets and not available with any competitors.

TITLE
PAGE NO
1
INTRODUCTION


28
2
RESEARCH METHODOLOGY


32
3
EXECUTIVE SUMMARY


40
4
PREMIUM INSIGHTS


44
5
MARKET OVERVIEW
Healthcare and industrial sectors drive oxygen market growth amid compliance and cost challenges.


48
 
5.1
INTRODUCTION


5.2
MARKET DYNAMICS


5.2.1
DRIVERS


5.2.1.1
Rising development of healthcare infrastructure


5.2.1.2
Increasing prevalence of chronic respiratory diseases


5.2.1.3
Sustainable oxygen supply through reduced energy use


5.2.1.4
Expanding steel production capacity


5.2.2
RESTRAINTS


5.2.2.1
Stringent compliance standards


5.2.3
OPPORTUNITIES


5.2.3.1
Increasing demand in aquaculture industry


5.2.3.2
Rising demand for high-purity oxygen in ozone generation


5.2.3.3
Modernization of power infrastructure


5.2.4
CHALLENGES


5.2.4.1
High installation and integration costs


5.2.4.2
Specialized maintenance needs
 
 
5.3
PORTER’S FIVE FORCES ANALYSIS


5.3.1
BARGAINING POWER OF SUPPLIERS


5.3.2
BARGAINING POWER OF BUYERS


5.3.3
THREAT OF NEW ENTRANTS


5.3.4
THREAT OF SUBSTITUTES


5.3.5
INTENSITY OF COMPETITIVE RIVALRY


5.4
KEY STAKEHOLDERS AND BUYING CRITERIA


5.4.1
KEY STAKEHOLDERS IN BUYING PROCESS


5.4.2
BUYING CRITERIA


5.5
MACROECONOMIC INDICATORS


5.5.1
GLOBAL GDP TRENDS


5.6
VALUE CHAIN ANALYSIS


5.7
ECOSYSTEM ANALYSIS


5.8
CASE STUDY ANALYSIS


5.8.1
ATLAS COPCO OXYGEN GENERATOR ENHANCES BIOGAS STABILITY AT LEEMING FACILITY


5.8.2
SEMP OPTIMIZES WASTEWATER TREATMENT WITH NOVAIR ON-SITE OXYGEN GENERATION


5.8.3
ATLAS COPCO OGP2 SECURES RELIABLE OXYGEN SUPPLY FOR UK VETERINARY CENTRE


5.9
REGULATORY LANDSCAPE


5.9.1
REGULATIONS


5.9.1.1
Europe


5.9.1.2
Asia Pacific


5.9.1.3
North America


5.9.2
REGULATORY BODIES, GOVERNMENT AGENCIES, AND OTHER ORGANIZATIONS


5.10
TECHNOLOGY ANALYSIS


5.10.1
KEY TECHNOLOGIES


5.10.1.1
Pressure swing adsorption (PSA)


5.10.1.2
Membrane separation


5.10.1.3
Cryogenic oxygen generation


5.10.2
COMPLEMENTARY TECHNOLOGIES


5.10.2.1
IoT and smart monitoring systems


5.10.2.2
Energy recovery systems
 
 
5.11
TRENDS/DISRUPTIONS IMPACTING CUSTOMER BUSINESS


5.12
TRADE ANALYSIS


5.12.1
EXPORT SCENARIO (HS CODE 840510)


5.12.2
IMPORT SCENARIO (HS CODE 840510)


5.13
KEY CONFERENCES AND EVENTS, 2025–2026


5.14
PRICING ANALYSIS


5.14.1
AVERAGE SELLING PRICE TREND, BY REGION, 2022–2024


5.14.2
AVERAGE SELLING PRICE TREND, BY END-USE INDUSTRY, 2022–2030


5.14.3
AVERAGE SELLING PRICE TREND OF KEY PLAYERS, BY END-USE INDUSTRY, 2024


5.15
INVESTMENT AND FUNDING SCENARIO


5.16
PATENT ANALYSIS


5.16.1
APPROACH


5.16.2
DOCUMENT TYPES


5.16.3
PUBLICATION TRENDS


5.16.4
INSIGHTS


5.16.5
LEGAL STATUS OF PATENTS


5.16.6
JURISDICTION ANALYSIS


5.16.7
TOP COMPANIES/APPLICANTS


5.16.8
TOP 10 PATENT OWNERS (US)


5.17
IMPACT OF 2025 US TARIFF ON INDUSTRIAL OXYGEN GENERATOR MARKET


5.17.1
INTRODUCTION


5.17.2
KEY TARIFF RATES


5.17.3
PRICE IMPACT ANALYSIS


5.17.4
IMPACT ON KEY COUNTRIES/REGIONS


5.17.4.1
North America


5.17.4.2
Europe


5.17.4.3
Asia Pacific


5.17.5
IMPACT ON END-USE INDUSTRIES
 
 
6
INDUSTRIAL OXYGEN GENERATOR MARKET, BY GAS TYPE AND FLOW RATE
Market Size & Growth Rate Forecast Analysis to 2030 in USD Million and Units | 4 Data Tables


84
 
6.1
INTRODUCTION


6.2
INDUSTRIAL


6.2.1
FOCUS ON ENHANCING OXYGEN SUPPLY EFFICIENCY ACROSS INDUSTRIAL FLOW RATES TO BOOST DEMAND


6.2.2
UP TO 50 NM³/HR


6.2.3
50–200 NM³/HR


6.2.4
200–1,000 NM³/HR


6.2.5
ABOVE 1,000 NM³/HR


6.3
MEDICAL


6.3.1
NEED TO ENSURE CONSISTENT AND SAFE OXYGEN SUPPLY ACROSS MEDICAL FACILITIES TO FUEL DEMAND


6.3.2
UP TO 2 NM³/HR


6.3.3
2.1–14 NM³/HR


6.3.4
15–50 NM³/HR


6.3.5
ABOVE 50 NM³/HR
 
 
7
INDUSTRIAL OXYGEN GENERATOR MARKET, BY SIZE
Market Size & Growth Rate Forecast Analysis to 2030 in USD Million and Units | 4 Data Tables


90
 
7.1
INTRODUCTION


7.2
STATIONARY


7.2.1
HIGH-PURITY AND CONTINUOUS OXYGEN SUPPLY FEATURES TO DRIVE DEMAND


7.3
PORTABLE


7.3.1
RISING USE OF PORTABLE OXYGEN GENERATORS FOR DECENTRALIZED AND REMOTE APPLICATIONS TO DRIVE MARKET
 
 
8
INDUSTRIAL OXYGEN GENERATOR MARKET, BY DESIGN
Market Size & Growth Rate Forecast Analysis to 2030 in USD Million and Units | 4 Data Tables


94
 
8.1
INTRODUCTION


8.2
CYLINDER


8.2.1
INCREASING INDUSTRIAL APPLICATIONS TO DRIVE MARKET


8.3
PLUG & PLAY


8.3.1
GROWING USE IN MEDICAL AND INDUSTRIAL APPLICATIONS TO PROPEL MARKET
 
 
9
INDUSTRIAL OXYGEN GENERATOR MARKET, BY TECHNOLOGY
Market Size & Growth Rate Forecast Analysis to 2030 in USD Million and Units | 4 Data Tables


98
 
9.1
INTRODUCTION


9.2
PRESSURE SWING ADSORPTION (PSA)-BASED


9.2.1
HIGH EFFICIENCY, OPERATIONAL RELIABILITY, AND ABILITY TO CONSISTENTLY PROVIDE OXYGEN AT DESIRED PURITY LEVEL TO FUEL DEMAND


9.3
MEMBRANE-BASED


9.3.1
HIGH POWER EFFICIENCY IN MEMBRANE OXYGEN GENERATION TO PROPEL DEMAND


9.4
CRYOGENIC-BASED


9.4.1
GROWING USE OF CRYOGENIC SOLUTIONS IN ENERGY & POWER INDUSTRY TO DRIVE MARKET
 
 
10
INDUSTRIAL OXYGEN GENERATOR MARKET, BY END-USE INDUSTRY
Market Size & Growth Rate Forecast Analysis to 2030 in USD Million and Units | 4 Data Tables


102
 
10.1
INTRODUCTION


10.2
MEDICAL & HEALTHCARE


10.2.1
RISING OXYGEN GENERATION FOR EMERGENCY, INSTITUTIONAL, AND HOME CARE NEEDS TO DRIVE MARKET


10.3
CHEMICALS & PETROCHEMICALS


10.3.1
NEED TO MEET HIGH-PURITY, HIGH-VOLUME OXYGEN DEMAND IN HARSH INDUSTRIAL ENVIRONMENTS TO PROPEL MARKET


10.4
MINING & METAL PROCESSING


10.4.1
RISING NEED FOR OXYGEN IN MINERAL PROCESSING AND SMELTING TO DRIVE DEMAND


10.5
POWER GENERATION


10.5.1
SHIFT TOWARD OXYGEN-ENRICHED COMBUSTION FOR HIGHER EFFICIENCY AND LOWER EMISSIONS TO PROPEL DEMAND


10.6
AQUACULTURE


10.6.1
USE TO MAINTAIN OPTIMAL DISSOLVED OXYGEN LEVELS TO FUEL MARKET GROWTH


10.7
WATER TREATMENT


10.7.1
RISING DEMAND IN HIGH-PURITY PROCESSES TO DRIVE MARKET


10.8
OTHER END-USE INDUSTRIES


11
INDUSTRIAL OXYGEN GENERATOR MARKET, BY REGION
Market Size & Growth Rate Forecast Analysis to 2030 in USD Million and Units | 224 Data Tables


109
 
11.1
INTRODUCTION


11.2
NORTH AMERICA


11.2.1
US


11.2.1.1
Rising demand from aquaculture and power generation industries to drive market


11.2.2
CANADA


11.2.2.1
Infrastructure upgrades and expanding healthcare sector to boost market growth


11.2.3
MEXICO


11.2.3.1
Increasing adoption in energy and aquaculture industries to drive market
 
 
11.3
EUROPE


11.3.1
GERMANY


11.3.1.1
Rising demand from aquaculture industry to drive market


11.3.2
FRANCE


11.3.2.1
Enhancement of efficiency in power generation using oxygen technologies to drive demand


11.3.3
UK


11.3.3.1
Booming healthcare sector to fuel demand


11.3.4
ITALY


11.3.4.1
Expanding on-site oxygen generator market to fuel demand


11.3.5
SPAIN


11.3.5.1
Growing industrial sector to fuel demand


11.3.6
REST OF EUROPE


11.4
ASIA PACIFIC


11.4.1
CHINA


11.4.1.1
Expanding healthcare industry to fuel demand


11.4.2
JAPAN


11.4.2.1
Increasing industrial demand to drive market


11.4.3
INDIA


11.4.3.1
Growing medical & healthcare industries to propel market


11.4.4
SOUTH KOREA


11.4.4.1
Stringent government policies regarding medical equipment to drive market


11.4.5
AUSTRALIA


11.4.5.1
Growing use in mining & metals industry to boost market


11.4.6
REST OF ASIA PACIFIC


11.5
SOUTH AMERICA


11.5.1
BRAZIL


11.5.1.1
Increasing demand across healthcare, metal, chemical, aquaculture, and water treatment industries to drive market


11.5.2
ARGENTINA


11.5.2.1
Modernization of industrial sector to drive market


11.5.3
COLUMBIA


11.5.3.1
Booming industrial sector to fuel demand


11.5.4
CHILE


11.5.4.1
Increased demand in aquaculture industry to drive market


11.5.5
REST OF SOUTH AMERICA


11.6
MIDDLE EAST & AFRICA


11.6.1
GCC COUNTRIES


11.6.1.1
Saudi Arabia


11.6.1.2
UAE


11.6.1.3
Rest of GCC countries


11.6.2
SOUTH AFRICA


11.6.2.1
Enhancement of sustainability through on-site oxygen generation to fuel demand


11.6.3
REST OF MIDDLE EAST & AFRICA
 
 
12
COMPETITIVE LANDSCAPE
Uncover market dominance strategies and valuation insights of key players and emerging leaders.


199
 
12.1
OVERVIEW


12.2
KEY PLAYER STRATEGIES/RIGHT TO WIN


12.3
REVENUE ANALYSIS


12.4
MARKET SHARE ANALYSIS


12.5
COMPANY VALUATION AND FINANCIAL METRICS


12.6
BRAND/PRODUCT COMPARISON ANALYSIS


12.7
COMPANY EVALUATION MATRIX: KEY PLAYERS, 2024


12.7.1
STARS


12.7.2
EMERGING LEADERS


12.7.3
PERVASIVE PLAYERS


12.7.4
PARTICIPANTS


12.7.5
COMPANY FOOTPRINT: KEY PLAYERS, 2024


12.7.5.1
Company footprint


12.7.5.2
Region footprint


12.7.5.3
Gas type and flow rate footprint


12.7.5.4
Size footprint


12.7.5.5
Design footprint


12.7.5.6
Technology footprint


12.7.5.7
End-use industry footprint
 
 
12.8
COMPANY EVALUATION MATRIX: STARTUPS/SMES, 2024


12.8.1
PROGRESSIVE COMPANIES


12.8.2
RESPONSIVE COMPANIES


12.8.3
DYNAMIC COMPANIES


12.8.4
STARTING BLOCKS


12.8.5
COMPETITIVE BENCHMARKING: KEY STARTUPS/SMES, 2024


12.8.5.1
Detailed list of key startups/SMEs


12.8.5.2
Competitive benchmarking of key startups/SMEs
 
 
12.9
COMPETITIVE SCENARIO


12.9.1
PRODUCT LAUNCHES


12.9.2
EXPANSIONS


12.9.3
DEALS
 
 
13
COMPANY PROFILES
In-depth Company Profiles of Leading Market Players with detailed Business Overview, Product and Service Portfolio, Recent Developments, and Unique Analyst Perspective (MnM View)


224
 
13.1
KEY PLAYERS


13.1.1
AIR LIQUIDE


13.1.1.1
Business overview


13.1.1.2
Products/Solutions/Services offered


13.1.1.3
Recent developments


13.1.1.4
MnM view


13.1.2
AIR PRODUCTS AND CHEMICALS, INC.


13.1.3
ATLAS COPCO GROUP


13.1.4
LINDE PLC


13.1.5
OXYMAT


13.1.6
CAIRE INC.


13.1.7
INMATEC GASETECHNOLOGIE GMBH & CO. KG


13.1.8
OXYGEN GENERATING SYSTEMS


13.1.9
PCI GASES


13.1.10
GENERON


13.1.11
SYSADVANCE


13.1.12
SÜMER A.S.


13.1.13
OXYVITAL


13.1.14
ORECO A/S


13.1.15
FRITZ STEPHAN GMBH


13.1.16
ÖZCAN KARDESLER


13.1.17
BEACONMEDAES


13.1.18
GAZ SYSTEMES


13.1.19
MIL’S


13.2
OTHER PLAYERS


13.2.1
NOXERIOR


13.2.2
ADVANCED GAS TECHNOLOGIES INC.


13.2.3
PNEUMATECH


13.2.4
AMCAREMED MEDICAL GAS SYSTEM


13.2.5
SUMITOMO SEIKA CHEMICALS CO., LTD.


13.2.6
INGERSOLL RAND
 
 
14
APPENDIX


280
 
14.1
DISCUSSION GUIDE


14.2
KNOWLEDGESTORE: MARKETSANDMARKETS’ SUBSCRIPTION PORTAL


14.3
CUSTOMIZATION OPTIONS


14.4
RELATED REPORTS


14.5
AUTHOR DETAILS


LIST OF TABLES


TABLE 1
INDUSTRIAL OXYGEN GENERATOR MARKET: IMPACT OF PORTER’S FIVE FORCES


TABLE 2
INFLUENCE OF STAKEHOLDERS ON BUYING PROCESS FOR KEY END-USE INDUSTRIES (%)


TABLE 3
KEY BUYING CRITERIA FOR KEY END-USE INDUSTRIES


TABLE 4
PROJECTED REAL GDP GROWTH (ANNUAL PERCENT CHANGE) OF KEY COUNTRIES, 2021–2030


TABLE 5
ROLES OF COMPANIES IN INDUSTRIAL OXYGEN GENERATOR ECOSYSTEM


TABLE 6
NORTH AMERICA: LIST OF REGULATORY BODIES, GOVERNMENT AGENCIES, AND OTHER ORGANIZATIONS


TABLE 7
EUROPE: LIST OF REGULATORY BODIES, GOVERNMENT AGENCIES, AND OTHER ORGANIZATIONS


TABLE 8
SOUTH AMERICA: LIST OF REGULATORY BODIES, GOVERNMENT AGENCIES, AND OTHER ORGANIZATIONS


TABLE 9
INDUSTRIAL OXYGEN GENERATOR MARKET: LIST OF KEY CONFERENCES AND EVENTS, 2025–2026


TABLE 10
AVERAGE SELLING PRICE TREND OF INDUSTRIAL OXYGEN GENERATORS, BY REGION, 2022–2030 (USD/UNIT)


TABLE 11
AVERAGE SELLING PRICE TREND OF INDUSTRIAL OXYGEN GENERATORS, BY END-USE INDUSTRY, 2022–2030 (USD/UNIT)


TABLE 12
INDICATIVE PRICING ANALYSIS OF INDUSTRIAL OXYGEN GENERATORS OFFERED BY KEY PLAYERS, BY END-USE INDUSTRY, 2024 (USD/UNIT)


TABLE 13
TOTAL PATENT COUNT, 2014–2024


TABLE 14
TOP 10 PATENT OWNERS, 2014–2014


TABLE 15
US-ADJUSTED RECIPROCAL TARIFF RATES, 2024


TABLE 16
INDUSTRIAL OXYGEN GENERATOR MARKET, BY GAS TYPE AND FLOW RATE, 2022–2024 (USD MILLION)


TABLE 17
INDUSTRIAL OXYGEN GENERATOR MARKET, BY GAS TYPE AND FLOW RATE, 2025–2030 (USD MILLION)


TABLE 18
INDUSTRIAL OXYGEN GENERATOR MARKET, BY GAS TYPE AND FLOW RATE, 2022–2024 (UNITS)


TABLE 19
INDUSTRIAL OXYGEN GENERATOR MARKET, BY GAS TYPE AND FLOW RATE, 2025–2030 (UNITS)


TABLE 20
INDUSTRIAL OXYGEN GENERATOR MARKET, BY SIZE, 2022–2024 (USD MILLION)


TABLE 21
INDUSTRIAL OXYGEN GENERATOR MARKET, BY SIZE, 2025–2030 (USD MILLION)


TABLE 22
INDUSTRIAL OXYGEN GENERATOR MARKET, BY SIZE, 2022–2024 (UNITS)


TABLE 23
INDUSTRIAL OXYGEN GENERATOR MARKET, BY SIZE, 2025–2030 (UNITS)


TABLE 24
INDUSTRIAL OXYGEN GENERATOR MARKET, BY DESIGN, 2022–2024 (USD MILLION)


TABLE 25
INDUSTRIAL OXYGEN GENERATOR MARKET, BY DESIGN, 2025–2030 (USD MILLION)


TABLE 26
INDUSTRIAL OXYGEN GENERATOR MARKET, BY DESIGN, 2022–2024 (UNITS)


TABLE 27
INDUSTRIAL OXYGEN GENERATOR MARKET, BY DESIGN, 2025–2030 (UNITS)


TABLE 28
INDUSTRIAL OXYGEN GENERATOR MARKET, BY TECHNOLOGY, 2022–2024 (USD MILLION)


TABLE 29
INDUSTRIAL OXYGEN GENERATOR MARKET, BY TECHNOLOGY, 2025–2030 (USD MILLION)


TABLE 30
INDUSTRIAL OXYGEN GENERATOR MARKET, BY TECHNOLOGY, 2022–2024 (UNITS)


TABLE 31
INDUSTRIAL OXYGEN GENERATOR MARKET, BY TECHNOLOGY, 2025–2030 (UNITS)


TABLE 32
INDUSTRIAL OXYGEN GENERATOR MARKET, BY END-USE INDUSTRY, 2022–2024 (USD MILLION)


TABLE 33
INDUSTRIAL OXYGEN GENERATOR MARKET, BY END-USE INDUSTRY, 2025–2030 (USD MILLION)


TABLE 34
INDUSTRIAL OXYGEN GENERATOR MARKET, BY END-USE INDUSTRY, 2022–2024 (UNITS)


TABLE 35
INDUSTRIAL OXYGEN GENERATOR MARKET, BY END-USE INDUSTRY, 2025–2030 (UNITS)


TABLE 36
INDUSTRIAL OXYGEN GENERATOR MARKET, BY REGION, 2022–2024 (UNITS)


TABLE 37
INDUSTRIAL OXYGEN GENERATOR MARKET, BY REGION, 2025–2030 (UNITS)


TABLE 38
INDUSTRIAL OXYGEN GENERATOR MARKET, BY REGION, 2022–2024 (USD MILLION)


TABLE 39
INDUSTRIAL OXYGEN GENERATOR MARKET, BY REGION, 2025–2030 (USD MILLION)


TABLE 40
NORTH AMERICA: INDUSTRIAL OXYGEN GENERATOR MARKET, BY COUNTRY, 2022–2024 (UNITS)


TABLE 41
NORTH AMERICA: INDUSTRIAL OXYGEN GENERATOR MARKET, BY COUNTRY, 2025–2030 (UNITS)


TABLE 42
NORTH AMERICA: INDUSTRIAL OXYGEN GENERATOR MARKET, BY COUNTRY, 2022–2024 (USD MILLION)


TABLE 43
NORTH AMERICA: INDUSTRIAL OXYGEN GENERATOR MARKET, BY COUNTRY, 2025–2030 (USD MILLION)


TABLE 44
NORTH AMERICA: INDUSTRIAL OXYGEN GENERATOR MARKET, BY GAS TYPE AND FLOW RATE, 2022–2024 (UNITS)


TABLE 45
NORTH AMERICA: INDUSTRIAL OXYGEN GENERATOR MARKET, BY GAS TYPE AND FLOW RATE, 2025–2030 (UNITS)


TABLE 46
NORTH AMERICA: INDUSTRIAL OXYGEN GENERATOR MARKET, BY GAS TYPE AND FLOW RATE, 2022–2024 (USD MILLION)


TABLE 47
NORTH AMERICA: INDUSTRIAL OXYGEN GENERATOR MARKET, BY GAS TYPE AND FLOW RATE, 2025–2030 (USD MILLION)


TABLE 48
NORTH AMERICA: INDUSTRIAL OXYGEN GENERATOR MARKET, BY SIZE, 2022–2024 (UNITS)


TABLE 49
NORTH AMERICA: INDUSTRIAL OXYGEN GENERATOR MARKET, BY SIZE, 2025–2030 (UNITS)


TABLE 50
NORTH AMERICA: INDUSTRIAL OXYGEN GENERATOR MARKET, BY SIZE, 2022–2024 (USD MILLION)


TABLE 51
NORTH AMERICA: INDUSTRIAL OXYGEN GENERATOR MARKET, BY SIZE, 2025–2030 (USD MILLION)


TABLE 52
NORTH AMERICA: INDUSTRIAL OXYGEN GENERATOR MARKET, BY DESIGN, 2022–2024 (UNITS)


TABLE 53
NORTH AMERICA: INDUSTRIAL OXYGEN GENERATOR MARKET, BY DESIGN, 2025–2030 (UNITS)


TABLE 54
NORTH AMERICA: INDUSTRIAL OXYGEN GENERATOR MARKET, BY DESIGN, 2022–2024 (USD MILLION)


TABLE 55
NORTH AMERICA: INDUSTRIAL OXYGEN GENERATOR MARKET, BY DESIGN, 2025–2030 (USD MILLION)


TABLE 56
NORTH AMERICA: INDUSTRIAL OXYGEN GENERATOR MARKET, BY TECHNOLOGY, 2022–2024 (UNITS)


TABLE 57
NORTH AMERICA: INDUSTRIAL OXYGEN GENERATOR MARKET, BY TECHNOLOGY, 2025–2030 (UNITS)


TABLE 58
NORTH AMERICA: INDUSTRIAL OXYGEN GENERATOR MARKET, BY TECHNOLOGY, 2022–2024 (USD MILLION)


TABLE 59
NORTH AMERICA: INDUSTRIAL OXYGEN GENERATOR MARKET, BY TECHNOLOGY, 2025–2030 (USD MILLION)


TABLE 60
NORTH AMERICA: INDUSTRIAL OXYGEN GENERATOR MARKET, BY END-USE INDUSTRY, 2022–2024 (UNITS)


TABLE 61
NORTH AMERICA: INDUSTRIAL OXYGEN GENERATOR MARKET, BY END-USE INDUSTRY, 2025–2030 (UNITS)


TABLE 62
NORTH AMERICA: INDUSTRIAL OXYGEN GENERATOR MARKET, BY END-USE INDUSTRY, 2022–2024 (USD MILLION)


TABLE 63
NORTH AMERICA: INDUSTRIAL OXYGEN GENERATOR MARKET, BY END-USE INDUSTRY, 2025–2030 (USD MILLION)


TABLE 64
US: INDUSTRIAL OXYGEN GENERATOR MARKET, BY END-USE INDUSTRY, 2022–2024 (UNITS)


TABLE 65
US: INDUSTRIAL OXYGEN GENERATOR MARKET, BY END-USE INDUSTRY, 2025–2030 (UNITS)


TABLE 66
US: INDUSTRIAL OXYGEN GENERATOR MARKET, BY END-USE INDUSTRY, 2022–2024 (USD MILLION)


TABLE 67
US: INDUSTRIAL OXYGEN GENERATOR MARKET, BY END-USE INDUSTRY, 2025–2030 (USD MILLION)


TABLE 68
CANADA: INDUSTRIAL OXYGEN GENERATOR MARKET, BY END-USE INDUSTRY, 2022–2024 (UNITS)


TABLE 69
CANADA: INDUSTRIAL OXYGEN GENERATOR MARKET, BY END-USE INDUSTRY, 2025–2030 (UNITS)


TABLE 70
CANADA: INDUSTRIAL OXYGEN GENERATOR MARKET, BY END-USE INDUSTRY, 2022–2024 (USD MILLION)


TABLE 71
CANADA: INDUSTRIAL OXYGEN GENERATOR MARKET, BY END-USE INDUSTRY, 2025–2030 (USD MILLION)


TABLE 72
MEXICO: INDUSTRIAL OXYGEN GENERATOR MARKET, BY END-USE INDUSTRY, 2022–2024 (UNITS)


TABLE 73
MEXICO: INDUSTRIAL OXYGEN GENERATOR MARKET, BY END-USE INDUSTRY, 2025–2030 (UNITS)


TABLE 74
MEXICO: INDUSTRIAL OXYGEN GENERATOR MARKET, BY END-USE INDUSTRY, 2022–2024 (USD MILLION)


TABLE 75
MEXICO: INDUSTRIAL OXYGEN GENERATOR MARKET, BY END-USE INDUSTRY, 2025–2030 (USD MILLION)


TABLE 76
EUROPE: INDUSTRIAL OXYGEN GENERATOR MARKET, BY COUNTRY, 2022–2024 (UNITS)


TABLE 77
EUROPE: INDUSTRIAL OXYGEN GENERATOR MARKET, BY COUNTRY, 2025–2030 (UNITS)


TABLE 78
EUROPE: INDUSTRIAL OXYGEN GENERATOR MARKET, BY COUNTRY, 2022–2024 (USD MILLION)


TABLE 79
EUROPE: INDUSTRIAL OXYGEN GENERATOR MARKET, BY COUNTRY, 2025–2030 (USD MILLION)


TABLE 80
EUROPE: INDUSTRIAL OXYGEN GENERATOR MARKET, BY GAS TYPE AND FLOW RATE, 2022–2024 (UNITS)


TABLE 81
EUROPE: INDUSTRIAL OXYGEN GENERATOR MARKET, BY GAS TYPE AND FLOW RATE, 2025–2030 (UNITS)


TABLE 82
EUROPE: INDUSTRIAL OXYGEN GENERATOR MARKET, BY GAS TYPE AND FLOW RATE, 2022–2024 (USD MILLION)


TABLE 83
EUROPE: INDUSTRIAL OXYGEN GENERATOR MARKET, BY GAS TYPE AND FLOW RATE, 2025–2030 (USD MILLION)


TABLE 84
EUROPE: INDUSTRIAL OXYGEN GENERATOR MARKET, BY SIZE, 2022–2024 (UNITS)


TABLE 85
EUROPE: INDUSTRIAL OXYGEN GENERATOR MARKET, BY SIZE, 2025–2030 (UNITS)


TABLE 86
EUROPE: INDUSTRIAL OXYGEN GENERATOR MARKET, BY SIZE, 2022–2024 (USD MILLION)


TABLE 87
EUROPE: INDUSTRIAL OXYGEN GENERATOR MARKET, BY SIZE, 2025–2030 (USD MILLION)


TABLE 88
EUROPE: INDUSTRIAL OXYGEN GENERATOR MARKET, BY DESIGN, 2022–2024 (UNITS)


TABLE 89
EUROPE: INDUSTRIAL OXYGEN GENERATOR MARKET, BY DESIGN, 2025–2030 (UNITS)


TABLE 90
EUROPE: INDUSTRIAL OXYGEN GENERATOR MARKET, BY DESIGN, 2022–2024 (USD MILLION)


TABLE 91
EUROPE: INDUSTRIAL OXYGEN GENERATOR MARKET, BY DESIGN, 2025–2030 (USD MILLION)


TABLE 92
EUROPE: INDUSTRIAL OXYGEN GENERATOR MARKET, BY TECHNOLOGY, 2022–2024 (UNITS)


TABLE 93
EUROPE: INDUSTRIAL OXYGEN GENERATOR MARKET, BY TECHNOLOGY, 2025–2030 (UNITS)


TABLE 94
EUROPE: INDUSTRIAL OXYGEN GENERATOR MARKET, BY TECHNOLOGY, 2022–2024 (USD MILLION)


TABLE 95
EUROPE: INDUSTRIAL OXYGEN GENERATOR MARKET, BY TECHNOLOGY, 2025–2030 (USD MILLION)


TABLE 96
EUROPE: INDUSTRIAL OXYGEN GENERATOR MARKET, BY END-USE INDUSTRY, 2022–2024 (UNITS)


TABLE 97
EUROPE: INDUSTRIAL OXYGEN GENERATOR MARKET, BY END-USE INDUSTRY, 2025–2030 (UNITS)


TABLE 98
EUROPE: INDUSTRIAL OXYGEN GENERATOR MARKET, BY END-USE INDUSTRY, 2022–2024 (USD MILLION)


TABLE 99
EUROPE: INDUSTRIAL OXYGEN GENERATOR MARKET, BY END-USE INDUSTRY, 2025–2030 (USD MILLION)


TABLE 100
GERMANY: INDUSTRIAL OXYGEN GENERATOR MARKET, BY END-USE INDUSTRY, 2022–2024 (UNITS)


TABLE 101
GERMANY: INDUSTRIAL OXYGEN GENERATOR MARKET, BY END-USE INDUSTRY, 2025–2030 (UNITS)


TABLE 102
GERMANY: INDUSTRIAL OXYGEN GENERATOR MARKET, BY END-USE INDUSTRY, 2022–2024 (USD MILLION)


TABLE 103
GERMANY: INDUSTRIAL OXYGEN GENERATOR MARKET, BY END-USE INDUSTRY, 2025–2030 (USD MILLION)


TABLE 104
FRANCE: INDUSTRIAL OXYGEN GENERATOR MARKET, BY END-USE INDUSTRY, 2022–2024 (UNITS)


TABLE 105
FRANCE: INDUSTRIAL OXYGEN GENERATOR MARKET, BY END-USE INDUSTRY, 2025–2030 (UNITS)


TABLE 106
FRANCE: INDUSTRIAL OXYGEN GENERATOR MARKET, BY END-USE INDUSTRY, 2022–2024 (USD MILLION)


TABLE 107
FRANCE: INDUSTRIAL OXYGEN GENERATOR MARKET, BY END-USE INDUSTRY, 2025–2030 (USD MILLION)


TABLE 108
UK: INDUSTRIAL OXYGEN GENERATOR MARKET, BY END-USE INDUSTRY, 2022–2024 (UNITS)


TABLE 109
UK: INDUSTRIAL OXYGEN GENERATOR MARKET, BY END-USE INDUSTRY, 2025–2030 (UNITS)


TABLE 110
UK: INDUSTRIAL OXYGEN GENERATOR MARKET, BY END-USE INDUSTRY, 2022–2024 (USD MILLION)


TABLE 111
UK: INDUSTRIAL OXYGEN GENERATOR MARKET, BY END-USE INDUSTRY, 2025–2030 (USD MILLION)


TABLE 112
ITALY: INDUSTRIAL OXYGEN GENERATOR MARKET, BY END-USE INDUSTRY, 2022–2024 (UNITS)


TABLE 113
ITALY: INDUSTRIAL OXYGEN GENERATOR MARKET, BY END-USE INDUSTRY, 2025–2030 (UNITS)


TABLE 114
ITALY: INDUSTRIAL OXYGEN GENERATOR MARKET, BY END-USE INDUSTRY, 2022–2024 (USD MILLION)


TABLE 115
ITALY: INDUSTRIAL OXYGEN GENERATOR MARKET, BY END-USE INDUSTRY, 2025–2030 (USD MILLION)


TABLE 116
SPAIN: INDUSTRIAL OXYGEN GENERATOR MARKET, BY END-USE INDUSTRY, 2022–2024 (UNITS)


TABLE 117
SPAIN: INDUSTRIAL OXYGEN GENERATOR MARKET, BY END-USE INDUSTRY, 2025–2030 (UNITS)


TABLE 118
SPAIN: INDUSTRIAL OXYGEN GENERATOR MARKET, BY END-USE INDUSTRY, 2022–2024 (USD MILLION)


TABLE 119
SPAIN: INDUSTRIAL OXYGEN GENERATOR MARKET, BY END-USE INDUSTRY, 2025–2030 (USD MILLION)


TABLE 120
REST OF EUROPE: INDUSTRIAL OXYGEN GENERATOR MARKET, BY END-USE INDUSTRY, 2022–2024 (UNITS)


TABLE 121
REST OF EUROPE: INDUSTRIAL OXYGEN GENERATOR MARKET, BY END-USE INDUSTRY, 2025–2030 (UNITS)


TABLE 122
REST OF EUROPE: INDUSTRIAL OXYGEN GENERATOR MARKET, BY END-USE INDUSTRY, 2022–2024 (USD MILLION)


TABLE 123
REST OF EUROPE: INDUSTRIAL OXYGEN GENERATOR MARKET, BY END-USE INDUSTRY, 2025–2030 (USD MILLION)


TABLE 124
ASIA PACIFIC: INDUSTRIAL OXYGEN GENERATOR MARKET, BY COUNTRY, 2022–2024 (UNITS)


TABLE 125
ASIA PACIFIC: INDUSTRIAL OXYGEN GENERATOR MARKET, BY COUNTRY, 2025–2030 (UNITS)


TABLE 126
ASIA PACIFIC: INDUSTRIAL OXYGEN GENERATOR MARKET, BY COUNTRY, 2022–2024 (USD MILLION)


TABLE 127
ASIA PACIFIC: INDUSTRIAL OXYGEN GENERATOR MARKET, BY COUNTRY, 2025–2030 (USD MILLION)


TABLE 128
ASIA PACIFIC: INDUSTRIAL OXYGEN GENERATOR MARKET, BY GAS TYPE AND FLOW RATE, 2022–2024 (UNITS)


TABLE 129
ASIA PACIFIC: INDUSTRIAL OXYGEN GENERATOR MARKET, BY GAS TYPE AND FLOW RATE, 2025–2030 (UNITS)


TABLE 130
ASIA PACIFIC: INDUSTRIAL OXYGEN GENERATOR MARKET, BY GAS TYPE AND FLOW RATE, 2022–2024 (USD MILLION)


TABLE 131
ASIA PACIFIC: INDUSTRIAL OXYGEN GENERATOR MARKET, BY GAS TYPE AND FLOW RATE, 2025–2030 (USD MILLION)


TABLE 132
ASIA PACIFIC: INDUSTRIAL OXYGEN GENERATOR MARKET, BY SIZE, 2022–2024 (UNITS)


TABLE 133
ASIA PACIFIC: INDUSTRIAL OXYGEN GENERATOR MARKET, BY SIZE, 2025–2030 (USD MILLION)


TABLE 134
ASIA PACIFIC: INDUSTRIAL OXYGEN GENERATOR MARKET, BY SIZE, 2022–2024 (USD MILLION)


TABLE 135
ASIA PACIFIC: INDUSTRIAL OXYGEN GENERATOR MARKET, BY SIZE, 2025–2030 (USD MILLION)


TABLE 136
ASIA PACIFIC: INDUSTRIAL OXYGEN GENERATOR MARKET, BY DESIGN, 2022–2024 (UNITS)


TABLE 137
ASIA PACIFIC: INDUSTRIAL OXYGEN GENERATOR MARKET, BY DESIGN, 2025–2030 (UNITS)


TABLE 138
ASIA PACIFIC: INDUSTRIAL OXYGEN GENERATOR MARKET, BY DESIGN, 2022–2024 (USD MILLION)


TABLE 139
ASIA PACIFIC: INDUSTRIAL OXYGEN GENERATOR MARKET, BY DESIGN, 2025–2030 (USD MILLION)


TABLE 140
ASIA PACIFIC: INDUSTRIAL OXYGEN GENERATOR MARKET, BY TECHNOLOGY, 2022–2024 (UNITS)


TABLE 141
ASIA PACIFIC: INDUSTRIAL OXYGEN GENERATOR MARKET, BY TECHNOLOGY, 2025–2030 (UNITS)


TABLE 142
ASIA PACIFIC: INDUSTRIAL OXYGEN GENERATOR MARKET, BY TECHNOLOGY, 2022–2024 (USD MILLION)


TABLE 143
ASIA PACIFIC: INDUSTRIAL OXYGEN GENERATOR MARKET, BY TECHNOLOGY, 2025–2030 (USD MILLION)


TABLE 144
ASIA PACIFIC: INDUSTRIAL OXYGEN GENERATOR MARKET, BY END-USE INDUSTRY, 2022–2024 (UNITS)


TABLE 145
ASIA PACIFIC: INDUSTRIAL OXYGEN GENERATOR MARKET, BY END-USE INDUSTRY, 2025–2030 (UNITS)


TABLE 146
ASIA PACIFIC: INDUSTRIAL OXYGEN GENERATOR MARKET, BY END-USE INDUSTRY, 2022–2024 (USD MILLION)


TABLE 147
ASIA PACIFIC: INDUSTRIAL OXYGEN GENERATOR MARKET, BY END-USE INDUSTRY, 2025–2030 (USD MILLION)


TABLE 148
CHINA: INDUSTRIAL OXYGEN GENERATOR MARKET, BY END-USE INDUSTRY, 2022–2024 (UNITS)


TABLE 149
CHINA: INDUSTRIAL OXYGEN GENERATOR MARKET, BY END-USE INDUSTRY, 2025–2030 (UNITS)


TABLE 150
CHINA: INDUSTRIAL OXYGEN GENERATOR MARKET, BY END-USE INDUSTRY, 2022–2024 (USD MILLION)


TABLE 151
CHINA: INDUSTRIAL OXYGEN GENERATOR MARKET, BY END-USE INDUSTRY, 2025–2030 (USD MILLION)


TABLE 152
JAPAN: INDUSTRIAL OXYGEN GENERATOR MARKET, BY END-USE INDUSTRY, 2022–2024 (UNITS)


TABLE 153
JAPAN: INDUSTRIAL OXYGEN GENERATOR MARKET, BY END-USE INDUSTRY, 2025–2030 (UNITS)


TABLE 154
JAPAN: INDUSTRIAL OXYGEN GENERATOR MARKET, BY END-USE INDUSTRY, 2022–2024 (USD MILLION)


TABLE 155
JAPAN: INDUSTRIAL OXYGEN GENERATOR MARKET, BY END-USE INDUSTRY, 2025–2030 (USD MILLION)


TABLE 156
INDIA: INDUSTRIAL OXYGEN GENERATOR MARKET, BY END-USE INDUSTRY, 2022–2024 (UNITS)


TABLE 157
INDIA: INDUSTRIAL OXYGEN GENERATOR MARKET, BY END-USE INDUSTRY, 2025–2030 (UNITS)


TABLE 158
INDIA: INDUSTRIAL OXYGEN GENERATOR MARKET, BY END-USE INDUSTRY, 2022–2024 (USD MILLION)


TABLE 159
INDIA: INDUSTRIAL OXYGEN GENERATOR MARKET, BY END-USE INDUSTRY, 2025–2030 (USD MILLION)


TABLE 160
SOUTH KOREA: INDUSTRIAL OXYGEN GENERATOR MARKET, BY END-USE INDUSTRY, 2022–2024 (UNITS)


TABLE 161
SOUTH KOREA: INDUSTRIAL OXYGEN GENERATOR MARKET, BY END-USE INDUSTRY, 2025–2030 (UNITS)


TABLE 162
SOUTH KOREA: INDUSTRIAL OXYGEN GENERATOR MARKET, BY END-USE INDUSTRY, 2022–2024 (USD MILLION)


TABLE 163
SOUTH KOREA: INDUSTRIAL OXYGEN GENERATOR MARKET, BY END-USE INDUSTRY, 2025–2030 (USD MILLION)


TABLE 164
AUSTRALIA: INDUSTRIAL OXYGEN GENERATOR MARKET, BY END-USE INDUSTRY, 2022–2024 (UNITS)


TABLE 165
AUSTRALIA: INDUSTRIAL OXYGEN GENERATOR MARKET, BY END-USE INDUSTRY, 2025–2030 (UNITS)


TABLE 166
AUSTRALIA: INDUSTRIAL OXYGEN GENERATOR MARKET, BY END-USE INDUSTRY, 2022–2024 (USD MILLION)


TABLE 167
AUSTRALIA: INDUSTRIAL OXYGEN GENERATOR MARKET, BY END-USE INDUSTRY, 2025–2030 (USD MILLION)


TABLE 168
REST OF ASIA PACIFIC: INDUSTRIAL OXYGEN GENERATOR MARKET, BY END-USE INDUSTRY, 2022–2024 (UNITS)


TABLE 169
REST OF ASIA PACIFIC: INDUSTRIAL OXYGEN GENERATOR MARKET, BY END-USE INDUSTRY, 2025–2030 (UNITS)


TABLE 170
REST OF ASIA PACIFIC: INDUSTRIAL OXYGEN GENERATOR MARKET, BY END-USE INDUSTRY, 2022–2024 (USD MILLION)


TABLE 171
REST OF ASIA PACIFIC: INDUSTRIAL OXYGEN GENERATOR MARKET, BY END-USE INDUSTRY, 2025–2030 (USD MILLION)


TABLE 172
SOUTH AMERICA: INDUSTRIAL OXYGEN GENERATOR MARKET, BY COUNTRY, 2022–2024 (UNITS)


TABLE 173
SOUTH AMERICA: INDUSTRIAL OXYGEN GENERATOR MARKET, BY COUNTRY, 2025–2030 (UNITS)


TABLE 174
SOUTH AMERICA: INDUSTRIAL OXYGEN GENERATOR MARKET, BY COUNTRY, 2022–2024 (USD MILLION)


TABLE 175
SOUTH AMERICA: INDUSTRIAL OXYGEN GENERATOR MARKET, BY COUNTRY, 2025–2030 (USD MILLION)


TABLE 176
SOUTH AMERICA: INDUSTRIAL OXYGEN GENERATOR MARKET, BY GAS TYPE AND FLOW RATE, 2022–2024 (UNITS)


TABLE 177
SOUTH AMERICA: INDUSTRIAL OXYGEN GENERATOR MARKET, BY GAS TYPE AND FLOW RATE, 2025–2030 (UNITS)


TABLE 178
SOUTH AMERICA: INDUSTRIAL OXYGEN GENERATOR MARKET, BY GAS TYPE AND FLOW RATE, 2022–2024 (USD MILLION)


TABLE 179
SOUTH AMERICA: INDUSTRIAL OXYGEN GENERATOR MARKET, BY GAS TYPE AND FLOW RATE, 2025–2030 (USD MILLION)


TABLE 180
SOUTH AMERICA: INDUSTRIAL OXYGEN GENERATOR MARKET, BY SIZE, 2022–2024 (UNITS)


TABLE 181
SOUTH AMERICA: INDUSTRIAL OXYGEN GENERATOR MARKET, BY SIZE, 2025–2030 (UNITS)


TABLE 182
SOUTH AMERICA: INDUSTRIAL OXYGEN GENERATOR MARKET, BY SIZE, 2022–2024 (USD MILLION)


TABLE 183
SOUTH AMERICA: INDUSTRIAL OXYGEN GENERATOR MARKET, BY SIZE, 2025–2030 (USD MILLION)


TABLE 184
SOUTH AMERICA: INDUSTRIAL OXYGEN GENERATOR MARKET, BY DESIGN, 2022–2024 (UNITS)


TABLE 185
SOUTH AMERICA: INDUSTRIAL OXYGEN GENERATOR MARKET, BY DESIGN, 2025–2030 (UNITS)


TABLE 186
SOUTH AMERICA: INDUSTRIAL OXYGEN GENERATOR MARKET, BY DESIGN, 2022–2024 (USD MILLION)


TABLE 187
SOUTH AMERICA: INDUSTRIAL OXYGEN GENERATOR MARKET, BY DESIGN, 2025–2030 (USD MILLION)


TABLE 188
SOUTH AMERICA: INDUSTRIAL OXYGEN GENERATOR MARKET, BY TECHNOLOGY, 2022–2024 (UNITS)


TABLE 189
SOUTH AMERICA: INDUSTRIAL OXYGEN GENERATOR MARKET, BY TECHNOLOGY, 2025–2030 (UNITS)


TABLE 190
SOUTH AMERICA: INDUSTRIAL OXYGEN GENERATOR MARKET, BY TECHNOLOGY, 2022–2024 (USD MILLION)


TABLE 191
SOUTH AMERICA: INDUSTRIAL OXYGEN GENERATOR MARKET, BY TECHNOLOGY, 2025–2030 (USD MILLION)


TABLE 192
SOUTH AMERICA: INDUSTRIAL OXYGEN GENERATOR MARKET, BY END-USE INDUSTRY, 2022–2024 (UNITS)


TABLE 193
SOUTH AMERICA: INDUSTRIAL OXYGEN GENERATOR MARKET, BY END-USE INDUSTRY, 2025–2030 (UNITS)


TABLE 194
SOUTH AMERICA: INDUSTRIAL OXYGEN GENERATOR MARKET, BY END-USE INDUSTRY, 2022–2024 (USD MILLION)


TABLE 195
SOUTH AMERICA: INDUSTRIAL OXYGEN GENERATOR MARKET, BY END-USE INDUSTRY, 2025–2030 (USD MILLION)


TABLE 196
BRAZIL: INDUSTRIAL OXYGEN GENERATOR MARKET, BY END-USE INDUSTRY, 2022–2024 (UNITS)


TABLE 197
BRAZIL: INDUSTRIAL OXYGEN GENERATOR MARKET, BY END-USE INDUSTRY, 2025–2030 (UNITS)


TABLE 198
BRAZIL: INDUSTRIAL OXYGEN GENERATOR MARKET, BY END-USE INDUSTRY, 2022–2024 (USD MILLION)


TABLE 199
BRAZIL: INDUSTRIAL OXYGEN GENERATOR MARKET, BY END-USE INDUSTRY, 2025–2030 (USD MILLION)


TABLE 200
ARGENTINA: INDUSTRIAL OXYGEN GENERATOR MARKET, BY END-USE INDUSTRY, 2022–2024 (UNITS)


TABLE 201
ARGENTINA: INDUSTRIAL OXYGEN GENERATOR MARKET, BY END-USE INDUSTRY, 2025–2030 (UNITS)


TABLE 202
ARGENTINA: INDUSTRIAL OXYGEN GENERATOR MARKET, BY END-USE INDUSTRY, 2022–2024 (USD MILLION)


TABLE 203
ARGENTINA: INDUSTRIAL OXYGEN GENERATOR MARKET, BY END-USE INDUSTRY, 2025–2030 (USD MILLION)


TABLE 204
COLUMBIA: INDUSTRIAL OXYGEN GENERATOR MARKET, BY END-USE INDUSTRY, 2022–2024 (UNITS)


TABLE 205
COLUMBIA: INDUSTRIAL OXYGEN GENERATOR MARKET, BY END-USE INDUSTRY, 2025–2030 (UNITS)


TABLE 206
COLUMBIA: INDUSTRIAL OXYGEN GENERATOR MARKET, BY END-USE INDUSTRY, 2022–2024 (USD MILLION)


TABLE 207
COLUMBIA: INDUSTRIAL OXYGEN GENERATOR MARKET, BY END-USE INDUSTRY, 2025–2030 (USD MILLION)


TABLE 208
CHILE: INDUSTRIAL OXYGEN GENERATOR MARKET, BY END-USE INDUSTRY, 2022–2024 (UNITS)


TABLE 209
CHILE: INDUSTRIAL OXYGEN GENERATOR MARKET, BY END-USE INDUSTRY, 2025–2030 (UNITS)


TABLE 210
CHILE: INDUSTRIAL OXYGEN GENERATOR MARKET, BY END-USE INDUSTRY, 2022–2024 (USD MILLION)


TABLE 211
CHILE: INDUSTRIAL OXYGEN GENERATOR MARKET, BY END-USE INDUSTRY, 2025–2030 (USD MILLION)


TABLE 212
REST OF SOUTH AMERICA: INDUSTRIAL OXYGEN GENERATOR MARKET, BY END-USE INDUSTRY, 2022–2024 (UNITS)


TABLE 213
REST OF SOUTH AMERICA: INDUSTRIAL OXYGEN GENERATOR MARKET, BY END-USE INDUSTRY, 2025–2030 (UNITS)


TABLE 214
REST OF SOUTH AMERICA: INDUSTRIAL OXYGEN GENERATOR MARKET, BY END-USE INDUSTRY, 2022–2024 (USD MILLION)


TABLE 215
REST OF SOUTH AMERICA: INDUSTRIAL OXYGEN GENERATOR MARKET, BY END-USE INDUSTRY, 2025–2030 (USD MILLION)


TABLE 216
MIDDLE EAST & AFRICA: INDUSTRIAL OXYGEN GENERATOR MARKET, BY COUNTRY, 2022–2024 (UNITS)


TABLE 217
MIDDLE EAST & AFRICA: INDUSTRIAL OXYGEN GENERATOR MARKET, BY COUNTRY, 2025–2030 (UNITS)


TABLE 218
MIDDLE EAST & AFRICA: INDUSTRIAL OXYGEN GENERATOR MARKET, BY COUNTRY, 2022–2024 (USD MILLION)


TABLE 219
MIDDLE EAST & AFRICA: INDUSTRIAL OXYGEN GENERATOR MARKET, BY COUNTRY, 2025–2030 (USD MILLION)


TABLE 220
MIDDLE EAST & AFRICA: INDUSTRIAL OXYGEN GENERATOR MARKET, BY GAS TYPE AND FLOW RATE, 2022–2024 (UNITS)


TABLE 221
MIDDLE EAST & AFRICA: INDUSTRIAL OXYGEN GENERATOR MARKET, BY GAS TYPE AND FLOW RATE, 2025–2030 (UNITS)


TABLE 222
MIDDLE EAST & AFRICA: INDUSTRIAL OXYGEN GENERATOR MARKET, BY GAS TYPE AND FLOW RATE, 2022–2024 (USD MILLIONS)


TABLE 223
MIDDLE EAST & AFRICA: INDUSTRIAL OXYGEN GENERATOR MARKET, BY GAS TYPE AND FLOW RATE, 2025–2030 (USD MILLIONS)


TABLE 224
MIDDLE EAST & AFRICA: INDUSTRIAL OXYGEN GENERATOR MARKET, BY SIZE, 2022–2024 (UNITS)


TABLE 225
MIDDLE EAST & AFRICA: INDUSTRIAL OXYGEN GENERATOR MARKET, BY SIZE, 2025–2030 (UNITS)


TABLE 226
MIDDLE EAST & AFRICA: INDUSTRIAL OXYGEN GENERATOR MARKET, BY SIZE, 2022–2024 (USD MILLION)


TABLE 227
MIDDLE EAST & AFRICA: INDUSTRIAL OXYGEN GENERATOR MARKET, BY SIZE, 2025–2030 (USD MILLION)


TABLE 228
MIDDLE EAST & AFRICA: INDUSTRIAL OXYGEN GENERATOR MARKET, BY DESIGN, 2022–2024 (UNITS)


TABLE 229
MIDDLE EAST & AFRICA: INDUSTRIAL OXYGEN GENERATOR MARKET, BY DESIGN, 2025–2030 (UNITS)


TABLE 230
MIDDLE EAST & AFRICA: INDUSTRIAL OXYGEN GENERATOR MARKET, BY DESIGN, 2022–2024 (USD MILLION)


TABLE 231
MIDDLE EAST & AFRICA: INDUSTRIAL OXYGEN GENERATOR MARKET, BY DESIGN, 2025–2030 (USD MILLION)


TABLE 232
MIDDLE EAST & AFRICA: INDUSTRIAL OXYGEN GENERATOR MARKET, BY TECHNOLOGY, 2022–2024 (UNITS)


TABLE 233
MIDDLE EAST & AFRICA: INDUSTRIAL OXYGEN GENERATOR MARKET, BY TECHNOLOGY, 2025–2030 (UNITS)


TABLE 234
MIDDLE EAST & AFRICA: INDUSTRIAL OXYGEN GENERATOR MARKET, BY TECHNOLOGY, 2022–2024 (USD MILLION)


TABLE 235
MIDDLE EAST & AFRICA: INDUSTRIAL OXYGEN GENERATOR MARKET, BY TECHNOLOGY, 2025–2030 (USD MILLION)


TABLE 236
MIDDLE EAST & AFRICA: INDUSTRIAL OXYGEN GENERATOR MARKET, BY END-USE INDUSTRY, 2022–2024 (UNITS)


TABLE 237
MIDDLE EAST & AFRICA: INDUSTRIAL OXYGEN GENERATOR MARKET, BY END-USE INDUSTRY, 2025–2030 (UNITS)


TABLE 238
MIDDLE EAST & AFRICA: INDUSTRIAL OXYGEN GENERATOR MARKET, BY END-USE INDUSTRY, 2022–2024 (USD MILLION)


TABLE 239
MIDDLE EAST & AFRICA: INDUSTRIAL OXYGEN GENERATOR MARKET, BY END-USE INDUSTRY, 2025–2030 (USD MILLION)


TABLE 240
SAUDI ARABIA: INDUSTRIAL OXYGEN GENERATOR MARKET, BY END-USE INDUSTRY, 2022–2024 (UNITS)


TABLE 241
SAUDI ARABIA: INDUSTRIAL OXYGEN GENERATOR MARKET, BY END-USE INDUSTRY, 2025–2030 (UNITS)


TABLE 242
SAUDI ARABIA: INDUSTRIAL OXYGEN GENERATOR MARKET, BY END-USE INDUSTRY, 2022–2024 (USD MILLION)


TABLE 243
SAUDI ARABIA: INDUSTRIAL OXYGEN GENERATOR MARKET, BY END-USE INDUSTRY, 2025–2030 (USD MILLION)


TABLE 244
UAE: INDUSTRIAL OXYGEN GENERATOR MARKET, BY END-USE INDUSTRY, 2022–2024 (UNITS)


TABLE 245
UAE: INDUSTRIAL OXYGEN GENERATOR MARKET, BY END-USE INDUSTRY, 2025–2030 (UNITS)


TABLE 246
UAE: INDUSTRIAL OXYGEN GENERATOR MARKET, BY END-USE INDUSTRY, 2022–2024 (USD MILLION)


TABLE 247
UAE: INDUSTRIAL OXYGEN GENERATOR MARKET, BY END-USE INDUSTRY, 2025–2030 (USD MILLION)


TABLE 248
REST OF GCC COUNTRIES: INDUSTRIAL OXYGEN GENERATOR MARKET, BY END-USE INDUSTRY, 2022–2024 (UNITS)


TABLE 249
REST OF GCC COUNTRIES: INDUSTRIAL OXYGEN GENERATOR MARKET, BY END-USE INDUSTRY, 2025–2030 (UNITS)


TABLE 250
REST OF GCC COUNTRIES: INDUSTRIAL OXYGEN GENERATOR MARKET, BY END-USE INDUSTRY, 2022–2024 (USD MILLION)


TABLE 251
REST OF GCC COUNTRIES: INDUSTRIAL OXYGEN GENERATOR MARKET, BY END-USE INDUSTRY, 2025–2030 (USD MILLION)


TABLE 252
SOUTH AFRICA: INDUSTRIAL OXYGEN GENERATOR MARKET, BY END-USE INDUSTRY, 2022–2024 (UNITS)


TABLE 253
SOUTH AFRICA: INDUSTRIAL OXYGEN GENERATOR MARKET, BY END-USE INDUSTRY, 2025–2030 (UNITS)


TABLE 254
SOUTH AFRICA: INDUSTRIAL OXYGEN GENERATOR MARKET, BY END-USE INDUSTRY, 2022–2024 (USD MILLION)


TABLE 255
SOUTH AFRICA: INDUSTRIAL OXYGEN GENERATOR MARKET, BY END-USE INDUSTRY, 2025–2030 (USD MILLION)


TABLE 256
REST OF MIDDLE EAST & AFRICA: INDUSTRIAL OXYGEN GENERATOR MARKET, BY END-USE INDUSTRY, 2022–2024 (UNITS)


TABLE 257
REST OF MIDDLE EAST & AFRICA: INDUSTRIAL OXYGEN GENERATOR MARKET, BY END-USE INDUSTRY, 2025–2030 (UNITS)


TABLE 258
REST OF MIDDLE EAST & AFRICA: INDUSTRIAL OXYGEN GENERATOR MARKET, BY END-USE INDUSTRY, 2022–2024 (USD MILLION)


TABLE 259
REST OF MIDDLE EAST & AFRICA: INDUSTRIAL OXYGEN GENERATOR MARKET, BY END-USE INDUSTRY, 2025–2030 (USD MILLION)


TABLE 260
INDUSTRIAL OXYGEN GENERATOR MARKET: OVERVIEW OF STRATEGIES ADOPTED BY KEY MANUFACTURERS, JANUARY 2021–JUNE 2025


TABLE 261
INDUSTRIAL OXYGEN GENERATOR MARKET: DEGREE OF COMPETITION, 2024


TABLE 262
INDUSTRIAL OXYGEN GENERATOR MARKET: REGION FOOTPRINT


TABLE 263
INDUSTRIAL OXYGEN GENERATOR MARKET: GAS TYPE AND FLOW RATE FOOTPRINT


TABLE 264
INDUSTRIAL OXYGEN GENERATOR MARKET: SIZE FOOTPRINT


TABLE 265
INDUSTRIAL OXYGEN GENERATOR MARKET: DESIGN FOOTPRINT


TABLE 266
INDUSTRIAL OXYGEN GENERATOR MARKET: TECHNOLOGY FOOTPRINT


TABLE 267
INDUSTRIAL OXYGEN GENERATOR MARKET: END-USE INDUSTRY FOOTPRINT


TABLE 268
INDUSTRIAL OXYGEN GENERATOR MARKET: DETAILED LIST OF KEY STARTUPS/SMES


TABLE 269
INDUSTRIAL OXYGEN GENERATOR MARKET: COMPETITIVE BENCHMARKING OF STARTUPS/SMES


TABLE 270
INDUSTRIAL OXYGEN GENERATOR MARKET: PRODUCT LAUNCHES, JANUARY 2021–JUNE 2025


TABLE 271
INDUSTRIAL OXYGEN GENERATOR MARKET: EXPANSIONS, JANUARY 2021–JUNE 2025


TABLE 272
INDUSTRIAL OXYGEN GENERATOR: DEALS, JANUARY 2021–JUNE 2025


TABLE 273
AIR LIQUIDE: COMPANY OVERVIEW


TABLE 274
AIR LIQUIDE: PRODUCTS/SOLUTIONS/SERVICES OFFERED


TABLE 275
AIR LIQUIDE: EXPANSIONS


TABLE 276
AIR PRODUCTS AND CHEMICALS, INC.: COMPANY OVERVIEW


TABLE 277
AIR PRODUCTS AND CHEMICALS, INC.: PRODUCTS/SOLUTIONS/SERVICES OFFERED


TABLE 278
AIR PRODUCTS AND CHEMICALS, INC.: DEALS


TABLE 279
ATLAS COPCO GROUP: COMPANY OVERVIEW


TABLE 280
ATLAS COPCO GROUP: PRODUCTS/SOLUTIONS/SERVICES OFFERED


TABLE 281
ATLAS COPCO GROUP: DEALS


TABLE 282
LINDE PLC: COMPANY OVERVIEW


TABLE 283
LINDE PLC: PRODUCTS/SOLUTIONS/SERVICES OFFERED


TABLE 284
LINDE PLC.: DEALS


TABLE 285
LINDE PLC: EXPANSIONS


TABLE 286
OXYMAT: COMPANY OVERVIEW


TABLE 287
OXYMAT.: PRODUCTS/SOLUTIONS/SERVICES OFFERED


TABLE 288
OXYMAT: DEALS


TABLE 289
CAIRE INC.: COMPANY OVERVIEW


TABLE 290
CAIRE INC.: PRODUCTS/SOLUTIONS/SERVICES OFFERED


TABLE 291
CAIRE INC.: PRODUCT LAUNCHES


TABLE 292
CAIRE INC.: EXPANSIONS


TABLE 293
INMATEC GASETECHNOLOGIE GMBH & CO. KG: COMPANY OVERVIEW


TABLE 294
INMATEC GASETECHNOLOGIE GMBH & CO. KG: PRODUCTS/SOLUTIONS/SERVICES OFFERED


TABLE 295
OXYGEN GENERATING SYSTEMS: COMPANY OVERVIEW


TABLE 296
OXYGEN GENERATING SYSTEMS: PRODUCTS/SOLUTIONS/SERVICES OFFERED


TABLE 297
PCI GASES: COMPANY OVERVIEW


TABLE 298
PCI GASES: PRODUCTS/SOLUTIONS/SERVICES OFFERED


TABLE 299
GENERON: COMPANY OVERVIEW


TABLE 300
GENERON: PRODUCTS/SOLUTIONS/SERVICES OFFERED


TABLE 301
SYSADVANCE: COMPANY OVERVIEW


TABLE 302
SYSADVANCE: PRODUCTS/SOLUTIONS/SERVICES OFFERED


TABLE 303
SÜMER A.S.: COMPANY OVERVIEW


TABLE 304
SÜMER A.S.: PRODUCTS/SOLUTIONS/SERVICES OFFERED


TABLE 305
OXYVITAL: COMPANY OVERVIEW


TABLE 306
OXYVITAL: PRODUCTS/SOLUTIONS/SERVICES OFFERED


TABLE 307
ORECO A/S: COMPANY OVERVIEW


TABLE 308
ORECO A/S: PRODUCTS/SOLUTIONS/SERVICES OFFERED


TABLE 309
FRITZ STEPHAN GMBH: COMPANY OVERVIEW


TABLE 310
FRITZ STEPHAN GMBH: PRODUCTS/SOLUTIONS/SERVICES OFFERED


TABLE 311
ÖZCAN KARDESLER: COMPANY OVERVIEW


TABLE 312
ÖZCAN KARDESLER: PRODUCTS/SOLUTIONS/SERVICES OFFERED


TABLE 313
BEACONMEDAES: COMPANY OVERVIEW


TABLE 314
BEACONMEDAES: PRODUCTS/SOLUTIONS/SERVICES OFFERED


TABLE 315
GAZ SYSTEMES: COMPANY OVERVIEW


TABLE 316
GAZ SYSTEMES: PRODUCTS/SOLUTIONS/SERVICES OFFERED


TABLE 317
MIL’S: COMPANY OVERVIEW


TABLE 318
MIL’S: PRODUCTS/SOLUTIONS/SERVICES OFFERED


TABLE 319
NOXERIOR: COMPANY OVERVIEW


TABLE 320
ADVANCED GAS TECHNOLOGIES INC.: COMPANY OVERVIEW


TABLE 321
PNEUMATECH: COMPANY OVERVIEW


TABLE 322
AMCAREMED MEDICAL GAS SYSTEM: COMPANY OVERVIEW


TABLE 323
SUMITOMO SEIKA CHEMICALS CO., LTD.: COMPANY OVERVIEW


TABLE 324
INGERSOLL RAND: COMPANY OVERVIEW


LIST OF FIGURES


FIGURE 1
INDUSTRIAL OXYGEN GENERATOR MARKET: SEGMENTATION AND REGIONAL SCOPE


FIGURE 2
INDUSTRIAL OXYGEN GENERATOR MARKET: RESEARCH DESIGN


FIGURE 3
INDUSTRIAL OXYGEN GENERATOR MARKET: BOTTOM-UP APPROACH


FIGURE 4
INDUSTRIAL OXYGEN GENERATOR MARKET: TOP-DOWN APPROACH


FIGURE 5
MARKET SIZE ESTIMATION: TOP-DOWN APPROACH


FIGURE 6
DEMAND-SIDE FORECAST PROJECTIONS


FIGURE 7
INDUSTRIAL OXYGEN GENERATOR MARKET: DATA TRIANGULATION


FIGURE 8
MEDICAL SEGMENT TO HOLD LARGER MARKET SHARE IN 2030


FIGURE 9
STATIONARY SEGMENT TO DOMINATE MARKET IN 2030


FIGURE 10
CYLINDER SEGMENT TO HOLD LARGER MARKET SHARE IN 2030


FIGURE 11
PSA-BASED SEGMENT TO DOMINATE MARKET IN 2030


FIGURE 12
MEDICAL & HEALTHCARE SEGMENT TO DOMINATE MARKET IN 2030


FIGURE 13
ASIA PACIFIC TO REGISTER HIGHEST GROWTH DURING FORECAST PERIOD


FIGURE 14
GROWING DEMAND AND PRODUCTION CAPACITIES IN EMERGING ECONOMIES OF ASIA PACIFIC TO CREATE LUCRATIVE OPPORTUNITIES FOR MARKET PLAYERS


FIGURE 15
INDUSTRIAL SEGMENT TO REGISTER HIGHER CAGR DURING FORECAST PERIOD


FIGURE 16
STATIONARY SEGMENT TO REGISTER HIGHER CAGR DURING FORECAST PERIOD


FIGURE 17
PLUG & PLAY SEGMENT TO RECORD HIGHER CAGR DURING FORECAST PERIOD


FIGURE 18
PSA-BASED SEGMENT TO EXHIBIT HIGHEST CAGR DURING FORECAST PERIOD


FIGURE 19
AQUACULTURE SEGMENT TO REGISTER HIGHEST CAGR DURING FORECAST PERIOD


FIGURE 20
CHINA TO REGISTER HIGHEST CAGR DURING FORECAST PERIOD


FIGURE 21
INDUSTRIAL OXYGEN GENERATOR MARKET: DRIVERS, RESTRAINTS, OPPORTUNITIES, AND CHALLENGES


FIGURE 22
INDUSTRIAL OXYGEN GENERATOR MARKET: PORTER’S FIVE FORCES ANALYSIS


FIGURE 23
INFLUENCE OF STAKEHOLDERS ON BUYING PROCESS FOR KEY END-USE INDUSTRIES


FIGURE 24
KEY BUYING CRITERIA FOR KEY END-USE INDUSTRIES


FIGURE 25
INDUSTRIAL OXYGEN GENERATOR MARKET: VALUE CHAIN ANALYSIS


FIGURE 26
INDUSTRIAL OXYGEN GENERATOR MARKET: ECOSYSTEM ANALYSIS


FIGURE 27
TRENDS/DISRUPTIONS INFLUENCING CUSTOMER BUSINESS


FIGURE 28
EXPORT DATA FOR HS CODE 840510-COMPLIANT PRODUCTS, BY COUNTRY, 2020–2024 (USD MILLION)


FIGURE 29
IMPORT DATA FOR HS CODE 840510-COMPLIANT PRODUCTS, BY COUNTRY, 2020–2024 (USD MILLION)


FIGURE 30
AVERAGE SELLING PRICE TREND OF INDUSTRIAL OXYGEN GENERATORS, BY REGION, 2022–2024 (USD/UNIT)


FIGURE 31
AVERAGE SELLING PRICE TREND OF INDUSTRIAL GENERATORS, BY END-USE INDUSTRY, 2022–2024 (USD/UNIT)


FIGURE 32
AVERAGE SELLING PRICE TREND OF INDUSTRIAL OXYGEN GENERATORS OFFERED BY KEY PLAYERS, BY APPLICATION, 2024 (USD/UNIT)


FIGURE 33
INDUSTRIAL OXYGEN GENERATOR MARKET: INVESTMENT AND FUNDING SCENARIO, 2021–2024 (USD MILLION)


FIGURE 34
TOTAL NUMBER OF PATENTS, 2014–2024


FIGURE 35
NUMBER OF PATENTS YEAR-WISE FROM 2014 TO 2024


FIGURE 36
PATENT ANALYSIS, BY LEGAL STATUS, 2014–2024


FIGURE 37
TOP JURISDICTION, BY DOCUMENT, 2014–2024


FIGURE 38
TOP 10 COMPANIES/APPLICANTS WITH HIGHEST NUMBER OF PATENTS, 2014–2024


FIGURE 39
MEDICAL SEGMENT TO HOLD LARGER SHARE OF INDUSTRIAL OXYGEN GENERATOR MARKET IN 2025


FIGURE 40
STATIONARY SEGMENT TO HOLD LARGER SHARE OF INDUSTRIAL OXYGEN GENERATOR MARKET IN 2025


FIGURE 41
CYLINDER SEGMENT TO HOLD LARGER SHARE OF INDUSTRIAL OXYGEN GENERATOR MARKET IN 2025


FIGURE 42
PRESSURE SWING ADSORPTION (PSA)-BASED SEGMENT TO HOLD LARGEST SHARE OF INDUSTRIAL OXYGEN GENERATOR MARKET IN 2025


FIGURE 43
MEDICAL & HEALTHCARE SEGMENT TO HOLD LARGEST SHARE OF INDUSTRIAL OXYGEN GENERATOR MARKET IN 2025


FIGURE 44
NORTH AMERICA: INDUSTRIAL OXYGEN GENERATOR MARKET SNAPSHOT


FIGURE 45
ASIA PACIFIC: INDUSTRIAL OXYGEN GENERATOR MARKET SNAPSHOT


FIGURE 46
INDUSTRIAL OXYGEN GENERATOR MARKET: REVENUE ANALYSIS OF KEY PLAYERS, 2022–2024 (USD BILLION)


FIGURE 47
INDUSTRIAL OXYGEN GENERATOR MARKET SHARE ANALYSIS, 2024


FIGURE 48
INDUSTRIAL OXYGEN GENERATOR MARKET: COMPANY VALUATION OF KEY COMPANIES, 2024 (USD BILLION)


FIGURE 49
INDUSTRIAL OXYGEN GENERATOR MARKET: FINANCIAL METRICS OF KEY COMPANIES, 2024


FIGURE 50
INDUSTRIAL OXYGEN GENERATOR MARKET: BRAND/PRODUCT COMPARISON


FIGURE 51
INDUSTRIAL OXYGEN GENERATOR MARKET: COMPANY EVALUATION MATRIX (KEY PLAYERS), 2024


FIGURE 52
INDUSTRIAL OXYGEN GENERATOR MARKET: COMPANY FOOTPRINT


FIGURE 53
INDUSTRIAL OXYGEN GENERATOR MARKET: COMPANY EVALUATION MATRIX (STARTUPS/SMES), 2024


FIGURE 54
AIR LIQUIDE: COMPANY SNAPSHOT


FIGURE 55
AIR PRODUCTS AND CHEMICALS, INC.: COMPANY SNAPSHOT


FIGURE 56
ATLAS COPCO GROUP: COMPANY SNAPSHOT


FIGURE 57
LINDE PLC: COMPANY SNAPSHOT


Methodology

The study involves two major activities in estimating the current market size for the industrial oxygen generator market. Exhaustive secondary research was done to collect information on the market, peer market, and parent market. The next step was to validate these findings, assumptions, and sizing with industry experts across the value chain through primary research. Both top-down and bottom-up approaches were employed to estimate the complete market size. After that, market breakdown and data triangulation were used to estimate the market size of segments and subsegments.

Secondary Research

Secondary sources referred to for this research study include financial statements of companies offering industrial oxygen generators and information from various trade, business, and professional associations. Secondary research has been used to obtain critical information about the industry’s value chain, the total pool of key players, market classification, and segmentation according to industry trends, to the bottom-most level and regional markets. The secondary data was collected and analyzed to arrive at the overall size of the industrial oxygen generator market, which was validated by primary respondents.

Primary Research

Extensive primary research was conducted after obtaining information regarding the industrial oxygen generator market scenario through secondary research. Several primary interviews were conducted with market experts from both the demand and supply sides across major countries of North America, Europe, Asia Pacific, the Middle East & Africa, and South America. Primary data was collected through questionnaires, emails, and telephonic interviews. The primary sources from the supply side included various industry experts, such as Chief X Officers (CXOs), Vice Presidents (VPs), Directors from business development, marketing, product development/innovation teams, and related key executives from industrial oxygen generator industry vendors, material providers, distributors, and key opinion leaders. Primary interviews were conducted to gather insights such as market statistics, data on revenue collected from the products and services, market breakdowns, market size estimations, market forecasting, and data triangulation. Primary research also helped in understanding the various trends related to product type, application, end-use industry, and region. Stakeholders from the demand side, such as CIOs, CTOs, CSOs, and installation teams of the customer/end users who are seeking industrial oxygen generator services, were interviewed to understand the buyer’s perspective on the suppliers, products, component providers, and their current usage of industrial oxygen generator and future outlook of their business which will affect the overall market.

Breakup of Primary Research:

Industrial Oxygen Generator Market

To know about the assumptions considered for the study, download the pdf brochure

Market Size Estimation

The research methodology used to estimate the size of the industrial oxygen generator market includes the following details. The market sizing of the market was undertaken from the demand side. The market was upsized based on the demand for industrial oxygen generator in different end-use industries at a regional level. Such procurements provide information on the demand aspects of the industrial oxygen generator industry for each application. For each end-use, all possible segments of the industrial oxygen generator market were integrated and mapped.

Industrial Oxygen Generator Market

Data Triangulation

After arriving at the overall size from the market size estimation process explained above, the total market was split into several segments and subsegments. The data triangulation and market breakdown procedures explained below were implemented, wherever applicable, to complete the overall market engineering process and arrive at the exact statistics for various market segments and subsegments. The data was triangulated by studying various factors and trends from the demand and supply sides. Along with this, the market size was validated using both the top-down and bottom-up approaches.

Market Definition

The industrial oxygen generator market encompasses the design, manufacturing, distribution, and servicing of systems that produce oxygen on-site for a wide range of industrial applications. These generators are most commonly based on pressure swing adsorption (PSA), vacuum PSA (VPSA), and cryogenic separation technologies that extract oxygen from ambient air and deliver it at required purity levels, typically ranging from 90% to 99.5%. Industrial oxygen generators are used extensively across sectors such as metal processing, chemicals, glass manufacturing, pulp and paper, aquaculture, wastewater treatment, and food & beverage processing, where oxygen is essential for combustion efficiency, oxidation processes, or water quality enhancement. Unlike bulk liquid oxygen or compressed gas cylinders, on-site generators provide a continuous, cost-effective, and reliable supply, reducing dependency on external deliveries and minimizing storage and transportation risks. The market also includes after-sales services, spare parts supply, maintenance contracts, and integration with process automation systems, making it a capital-intensive but operationally efficient segment. Growing emphasis on energy efficiency, sustainability, and operational autonomy is further shaping the demand and technological evolution of industrial oxygen generation systems worldwide.

Stakeholders

  • Industrial Oxygen Generator Manufacturers
  • Industrial Oxygen Generator Distributors and Suppliers
  • End-use Industries
  • Universities, Governments, and Research Organizations
  • Associations and Industrial Bodies
  • R&D Institutes
  • Environmental Support Agencies
  • Investment Banks and Private Equity Firms
  • Research and Consulting Firms

Report Objectives

  • To define, describe, and forecast the industrial oxygen generator market size in terms of volume and value
  • To provide detailed information regarding the key factors, such as drivers, restraints, opportunities, and challenges influencing market growth
  • To analyze and project the global industrial oxygen generator market, by gas type and flow rate, size,  design, technology, end-use industry, and region
  • To forecast the market size in five main regions (along with country-level data), North America, Europe, Asia Pacific, Middle East & Africa, and South America, and analyze the significant region-specific trends
  • To strategically analyze micromarkets with respect to individual growth trends, prospects, and contributions of the submarkets to the overall market
  • To analyze the market opportunities and the competitive landscape for stakeholders and market leaders
  • To assess recent market developments and competitive strategies, such as agreements, contracts, acquisitions, partnerships & collaborations, and product developments/launches, to draw the competitive landscape
  • To strategically profile the key market players and comprehensively analyze their core competencies

Key Questions Addressed by the Report

Who are the major companies in the industrial oxygen generator market? What key strategies have market players adopted to strengthen their market presence?

Key players include Air Liquide (France), Air Products and Chemicals, Inc. (US), Atlas Copco (Sweden), Linde plc (UK), OXYMAT (Denmark), CAIRE Inc. (US), INMATEC GaseTechnologie GmbH & Co. KG (Germany), Oxygen Generating Systems International (US), PCI Gases (US), GENERON (US), and SYSADVANCE (Portugal). Strategies include product launches, mergers & acquisitions, agreements, collaborations & partnerships, and expansions.

What are the drivers and opportunities for the industrial oxygen generator market?

Drivers include healthcare infrastructure development, rising chronic respiratory disease cases, and growing demand in aquaculture. Opportunities come from ozone applications using high-purity oxygen technology and other expanding industrial uses.

Which region is expected to hold the largest market share?

Asia Pacific is expected to hold the largest market share due to its strong industrial base, regulatory stringency, and technological leadership.

What is the projected growth rate of the industrial oxygen generator market over the next five years?

The market is projected to grow at a CAGR of 8.3% during the forecast period.

How is the industrial oxygen generator market aligned for future growth?

The market is growing steadily, characterized by a consolidated structure with many regional players planning to expand their production capacities.

Personalize This Research

  • Triangulate with your Own Data
  • Get Data as per your Format and Definition
  • Gain a Deeper Dive on a Specific Application, Geography, Customer or Competitor
  • Any level of Personalization
Request A Free Customisation

Let Us Help You

  • What are the Known and Unknown Adjacencies Impacting the Industrial Oxygen Generator Market
  • What will your New Revenue Sources be?
  • Who will be your Top Customer; what will make them switch?
  • Defend your Market Share or Win Competitors
  • Get a Scorecard for Target Partners
Customized Workshop Request

Custom Market Research Services

We Will Customise The Research For You, In Case The Report Listed Above Does Not Meet With Your Requirements

Get 10% Free Customisation

Growth opportunities and latent adjacency in Industrial Oxygen Generator Market

DMCA.com Protection Status