
Infrared Detector Market Size, Share & Trends

Infrared Detector Market by Thermal Detector (Pyroelectric, Thermopile), Photodetector (Indium Gallium Arsenide), Cooled, Uncooled, Mid-Wave Infrared, Long-wave Infrared, People & Motion Sensing, Security & Surveillance Global Forecast to 2030


INFRARED DETECTOR MARKET OVERVIEW
Source: Secondary Research, Interviews with Experts, MarketsandMarkets Analysis
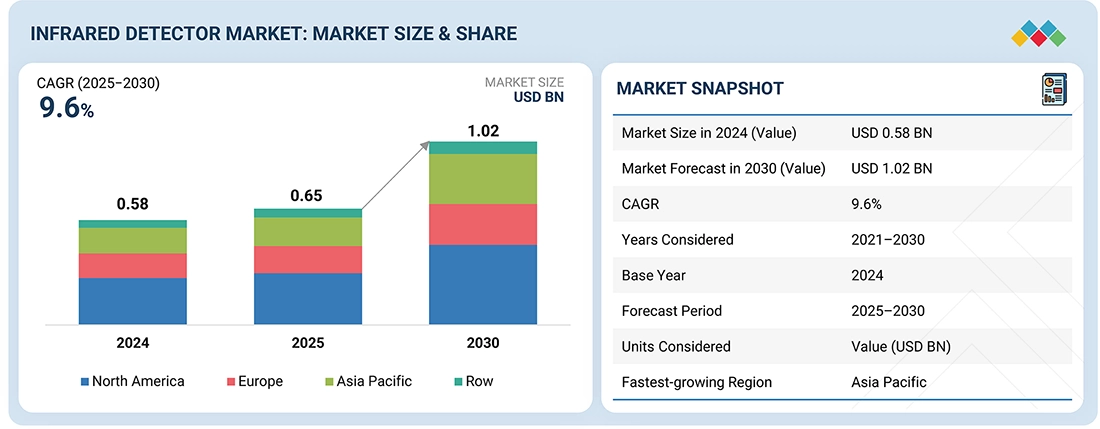
The infrared detector market is projected to reach USD 1.02 billion by 2030, growing from USD 0.65 billion in 2025 at a CAGR of 9.6% during the forecast period. The growth of the market is driven by the increasing adoption of infrared detectors across security & surveillance, industrial automation, healthcare, automotive, and smart building applications. Additionally, the rising demand for advanced surveillance, industrial temperature monitoring, and biomedical imaging is fueling their adoption, while smart homes and buildings are integrating these detectors for motion sensing and energy-efficient systems. In the automotive sector, infrared detectors are being deployed in driver-assistance and autonomous vehicles. Likewise, in industries, such as oil & gas and manufacturing, these detectors are being used for fire and gas detection. This growth is further supported by government defense investments and the growing integration of these detectors in consumer electronics and IoT devices.
Market Size & Forecast
The Infrared Detector Market is witnessing steady expansion as industries increasingly adopt advanced sensing technologies for security, automation, and thermal imaging applications. According to MarketsandMarkets, the Infrared Detector Market size is projected to grow from USD 0.65 billion in 2025 to USD 1.02 billion by 2030, registering a CAGR of around 9.6% during the forecast period. This strong Infrared Detector Market growth is primarily driven by rising demand for thermal imaging, motion detection, fire detection, and temperature monitoring across sectors such as automotive, industrial automation, healthcare, and security & surveillance. As industries move toward smarter monitoring systems and non-contact sensing technologies, the Infrared Detector industry is gaining momentum globally. The increasing integration of infrared detectors in smart buildings, driver-assistance systems, and defense surveillance platforms is further strengthening the overall Infrared Detector Market share across multiple end-use sectors.
Several technological advancements and expanding applications are shaping key Infrared Detector Market trends worldwide. The growing adoption of uncooled infrared detectors, which are compact, cost-effective, and suitable for mass-market applications, is significantly influencing the Infrared Detector Market growth. In addition, industries are increasingly integrating infrared sensing technologies into IoT platforms, enabling real-time monitoring, predictive maintenance, and enhanced operational efficiency. The rising use of infrared detectors in smart homes, building automation, and automotive safety systems is also contributing to the expanding Infrared Detector Market share. As demand for advanced sensing, security monitoring, and automation continues to grow, the Infrared Detector industry is expected to experience sustained innovation and expansion, further strengthening the global Infrared Detector Market in the coming years.
KEY TAKEAWAYS
- By region, Asia Pacific is projected to register the highest growth of 44% during the forecast period,
- By type, the thermal detector segment is dominating the infrared detector market with ~82% share in 2024.
- By technology, the market for uncooled detectors is projected to register the highest growth of 77% in 2024.
- By wavelength, the LWIR segment is projected to register the highest growth of 48% during the forecast period,
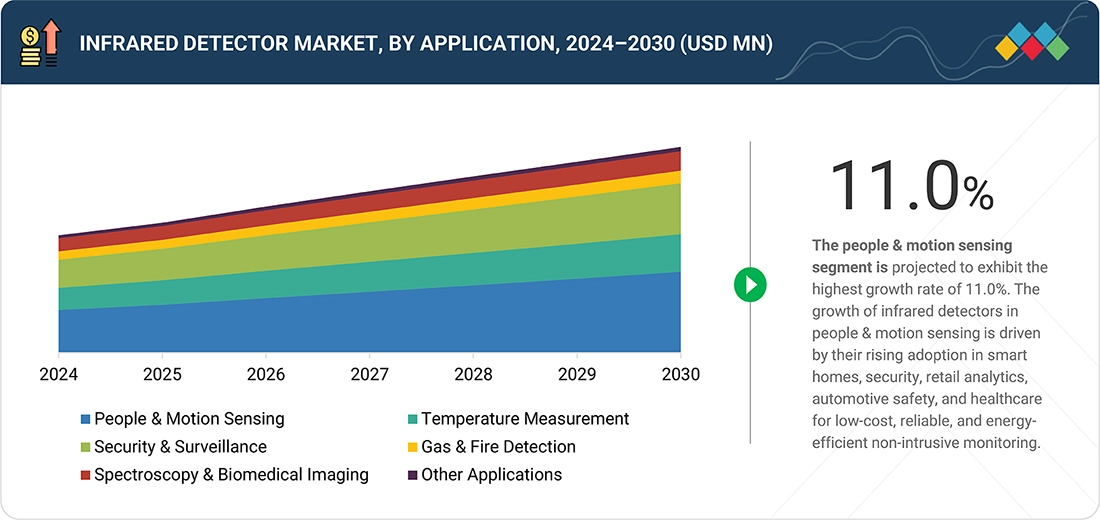
- By application, the market for people & motion sensing segment is projected to register the highest growth of 11% in 2024.
- By vertical, the non-industrial segment is projected to register the highest growth of 62% during the forecast period,
- Leading players in the infrared detector market include Teledyne Technologies, Texas Instruments, Excelitas Technologies Corp., Murata Manufacturing Co., and Lynred. Competition in the market is driven by innovation in uncooled technologies, miniaturization, and integration into consumer electronics and IoT platforms. Companies are actively pursuing partnerships, acquisitions, and R&D investments to expand their detector portfolios across industrial, defense, medical, and commercial applications, strengthening their global market presence.
- VIGO Photonics S.A., IRnova AB, and Phlux Technology Ltd. have emerged as the startups and SMEs driving technological innovation and market agility in the infrared detecto market.
The infrared detector market is projected to grow significantly over the next decade, driven by their rising demand in security & surveillance, smart homes, automotive safety systems, industrial automation, and healthcare applications, along with advancements in IoT integration, miniaturization, and cost-efficient non-contact sensing technologies.
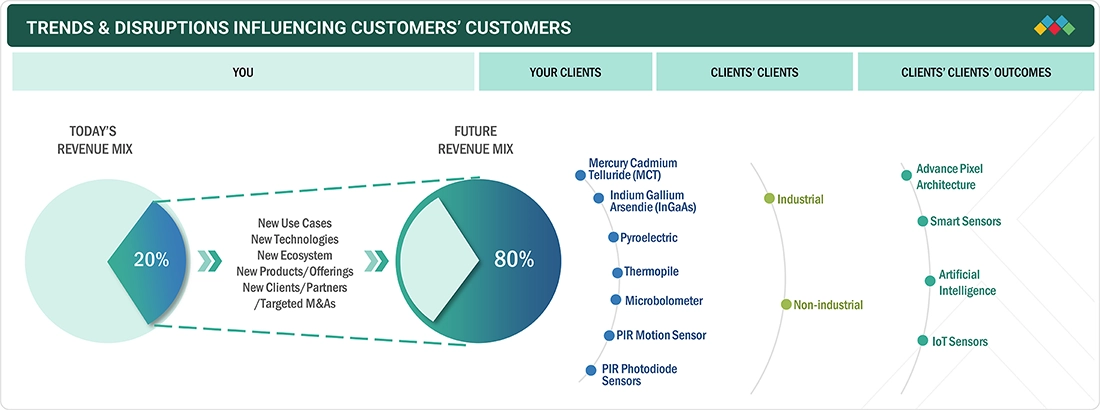
TRENDS & DISRUPTIONS IMPACTING CUSTOMERS' CUSTOMERS
The non-industrial vertical covers the military & defense, medical, and scientific research sectors. Non-industrial applications of infrared detectors include people & motion sensing, security & surveillance, and temperature measurement. The infrared detectors market is seeing new opportunities in the automotive sector, as these detectors can be used in driver monitoring systems, night vision systems, blind spot detection, parking assistance, and other applications to enhance driver awareness, improve safety, and increase convenience. These opportunities could be considered future bets and are expected to be revenue generators in the near future.
Source: Secondary Research, Interviews with Experts, MarketsandMarkets Analysis
INFRARED DETECTOR MARKET DYNAMICS
Level
-
Demand acceleration for thermal imaging across mission-critical defense, automotive, industrial, and healthcare ecosystems

-
Operational excellence fueled by cost-efficient uncooled infrared modules across industrial and smart manufacturing sectors

Level
-
High cost & complexity of cooled detectors

-
Regulatory hurdles and complexities, including export controls in defense and aerospace sectors

Level
-
Adoption of SWIR/NIR modules fueling precision inspection and automotive safety innovation

-
Innovation in materials and quantum dots and CMOS-compatible IR redefining cost economics

Level
-
Long-term performance risks from thermal instability impacting mission-critical sensing

Source: Secondary Research, Interviews with Experts, MarketsandMarkets Analysis
Driver: Demand acceleration for thermal imaging across mission-critical defense, automotive, industrial, and healthcare ecosystems
Infrared detectors are increasingly being adopted for mission-critical applications, such as surveillance, border security, smart homes, driver assistance systems, and medical diagnostics. With growing urbanization and rising safety concerns, demand is accelerating for IR-based motion sensors, thermal cameras, and biomedical imaging solutions. In addition, the expansion of smart city projects and Industry 4.0 initiatives has created new opportunities for integrating IR detectors into IoT-enabled systems, fueling consistent market growth.
Restraint: High cost & complexity of cooled detectors
Although cooled infrared detectors deliver superior sensitivity and image resolution, their production is costly due to the complex cooling mechanisms and cryogenic components required. This results in limited affordability and adoption, particularly in consumer and commercial sectors. Maintenance complexity and high energy consumption further restrict their use to specialized applications in aerospace, defense, and high-end research, thereby restraining broader market penetration compared to uncooled detectors
Opportunity: Adoption of SWIR/NIR modules fueling precision inspection and automotive safety innovation
The adoption of short-wave, mid-wave, and long-wave infrared detectors is opening new growth avenues across industries. In the automotive sector, SWIR and LWIR detectors are enabling advanced driver assistance systems (ADAS), pedestrian detection, and cabin monitoring for EVs and autonomous vehicles. In the industrial and medical sectors, these technologies support precision inspection, spectroscopy, and non-contact diagnostics. As IoT and AI analytics are increasingly integrated with IR detectors, the potential for smart sensing, predictive maintenance, and real-time monitoring is expanding rapidly.
Challenge: Long-term performance risks from thermal instability impacting mission-critical sensing
One of the key challenges in the infrared detectors market lies in ensuring consistent performance under varying temperature and environmental conditions. Detectors may experience drift, reduced accuracy, or shorter lifecycles in extreme operating environments, posing risks for mission-critical applications like defense surveillance or aerospace systems. Additionally, export restrictions on advanced IR technologies (such as cooled MCT or InGaAs detectors) create regulatory hurdles for global suppliers, limiting technology transfer and slowing adoption in emerging markets.
Infrared Detector Market: COMMERCIAL USE CASES ACROSS INDUSTRIES
| COMPANY | USE CASE DESCRIPTION | BENEFITS |
|---|---|---|
 |
Deployed infrared detectors for continuous monitoring of blast furnaces and rolling mills to detect hotspots, surface defects, and equipment overheating | Improved safety, reduced downtime, early fault detection in high-temperature processes, and enhanced product quality in steel manufacturing |
 |
Research-led deployment of infrared thermography for building energy efficiency studies, insulation defect detection, and predictive maintenance of lab equipment | Reduced energy consumption, improved sustainability, data-driven facility management, and enhanced research outcomes in applied thermography |
 |
Integrated IR detector systems with AI-based analytics to accelerate soil and groundwater contamination remediation by identifying pollutant signatures | Reduced remediation timelines from decades to years, lower environmental impact, higher remediation accuracy, and significant cost savings in environmental projects |
 |
Incorporated pyroelectric IR detectors into portable FTIR spectrometers for hazardous chemical identification in defense and emergency response | Increased field safety, faster chemical threat detection, improved compliance with safety protocols, and reliable detection of unknown substances |
 |
Embedded IR detectors in its fuel and oil analyzers (ERASPEC) to precisely measure chemical composition and properties of petroleum products | Optimized fuel quality testing, regulatory compliance, faster lab results, and reliable performance in petrochemical and refining sectors |
Logos and trademarks shown above are the property of their respective owners. Their use here is for informational and illustrative purposes only.
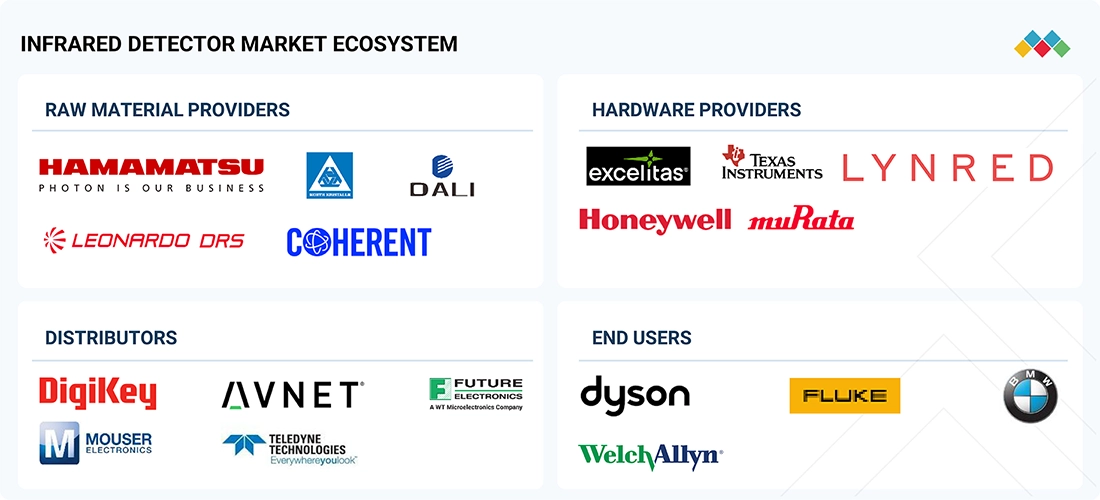
INFRARED DETECTOR MARKET ECOSYSTEM
The infrared detector market ecosystem comprises established raw material providers, which include Teledyne Technologies (US), Texas Instruments Incorporated (US), Excelitas Technologies Corp. (US), Murata Manufacturing Co., Ltd. (Japan), and Lynred (France). The synergy among these stakeholders is unlocking new opportunities for infrared detector applications for surveillance & security, medical diagnostics, fire detection, predictive maintenance, smart buildings, and autonomous vehicles. These detectors drive resilience, efficiency, and innovation across the global infrared detector market.
Logos and trademarks shown above are the property of their respective owners. Their use here is for informational and illustrative purposes only.
INFRARED DETECTOR MARKET SEGMENTS
Source: Secondary Research, Interviews with Experts, MarketsandMarkets Analysis
Infrared Detector Market, By Type
The thermal detector segment accounted for the largest market share in 2024, as these detectors are widely used for people & motion sensing, temperature measurement, and consumer electronics due to their low cost, reliability, and ease of integration. Photodetectors, though small in share, are growing in adoption across spectroscopy, biomedical imaging, and defense-grade applications where high sensitivity and precision are required.
Infrared Detector Market, By Technology
The uncooled segment accounted for a significant share in 2024 supported by the cost-effectiveness of uncooled detectors, their compact design, and their mass adoption in smart homes, automotive safety, and industrial automation. On the other hand, cooled detectors remain critical for high-end defense, aerospace, and scientific research applications, where ultra-high sensitivity and resolution are essential.
Infrared Detector Market, By Wavelength
The LWIR (long-wave infrared) segment accounted for the largest share in 2024, driven by the extensive use of LWIR detectors in thermal imaging, surveillance, and smart building applications. The SWIR and MWIR segments are also expanding steadily, supported by their rapid adoption for spectroscopy, environmental monitoring, and precision inspection in the automotive and industrial sectors.
Infrared Detector Market, By Application
The people & motion sensing segment accounted for the largest market share in 2024, as IR detectors are extensively used in smart homes, building automation, retail analytics, and occupancy-based energy management. The security & surveillance segment followed closely, fueled by the rising global investments in border security, public safety, and defense modernization. The temperature measurement and gas & fire detection remain critical segments, supporting growth in the industrial, oil & gas, and healthcare environments
Infrared Detector Market, By Vertical
The non-industrial segment accounted for the largest market share in 2024 due to the rising adoption of infrared detectors across military & defense, residential & commercial, medical, and scientific research applications. The military & defense segment continues to dominate due to extensive use of detectors for night vision, surveillance, and missile guidance. On the other hand, the demand for these detectors in the residential & commercial segment is accelerating with smart home and smart building deployments of infrared detectors. Medical and research institutions are also witnessing an increasing adoption of these detectors, particularly in thermography, biomedical imaging, and spectroscopy.
INFRARED DETECTOR MARKET REGION
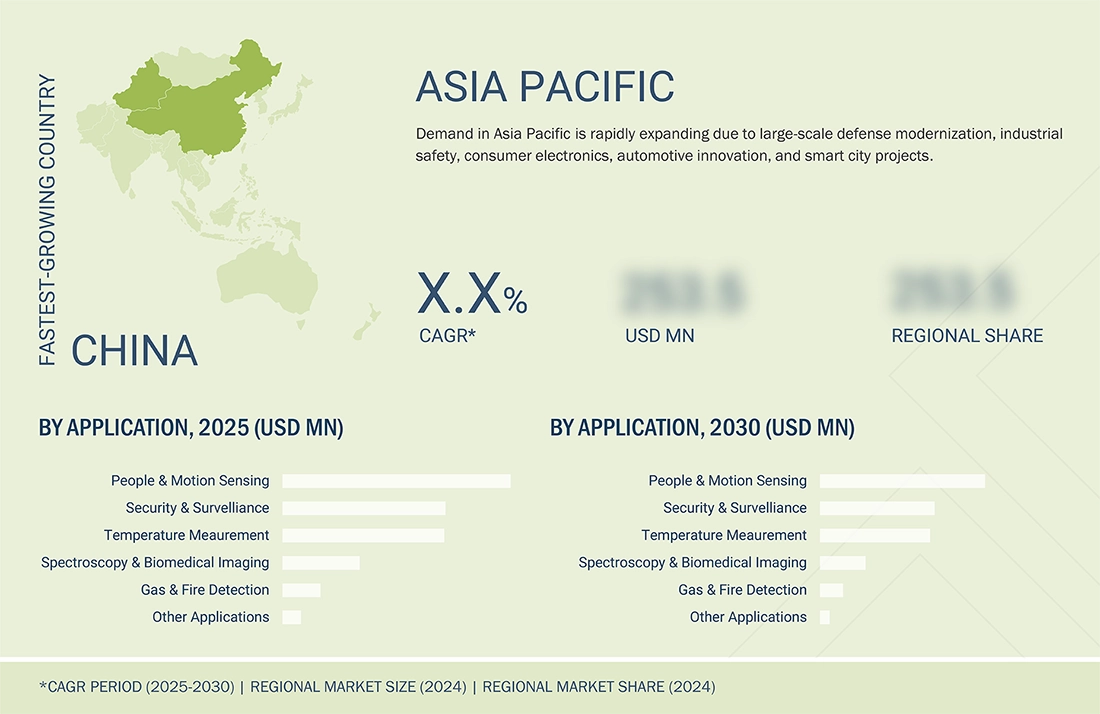
Asia Pacific is projected to register the highest CAGR in the global infrared detector market during the forecast period.
The Asia Pacific market is projected to achieve the highest growth during the forecast period. This projection is driven by rapid industrialization, strong government initiatives for smart city development, and expanding consumer electronics manufacturing in countries, such as China, Japan, South Korea, and India. Additionally, the rapid adoption of defense modernization programs, coupled with increasing adoption of IR detectors in automotive safety systems, healthcare thermography, and building automation, is further accelerating demand. The region’s large-scale production capabilities and cost advantages also make it a hub for innovation in infrared detectors.
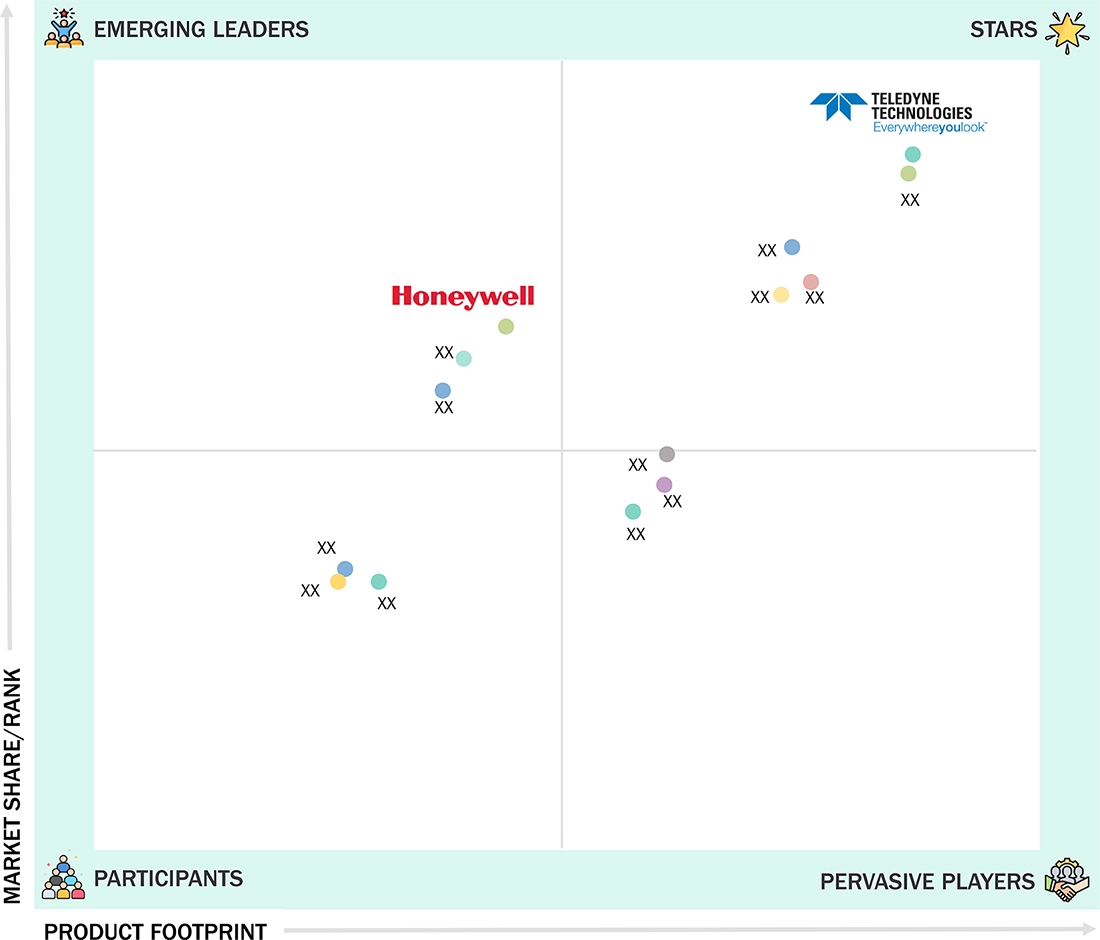
Infrared Detector Market: COMPANY EVALUATION MATRIX
In the infrared detector market, Teledyne Technologies (Star) leads with a strong market presence and a comprehensive portfolio spanning cooled and uncooled IR detectors, catering to defense, aerospace, industrial, and scientific research applications. Its focus on high-performance imaging solutions, coupled with continuous R&D investments, positions it as a clear leader in advanced IR sensing technologies. Honeywell (Emerging Leader) is also gaining notable traction, leveraging its expertise in building automation, safety, and smart infrastructure to expand adoption of IR detectors in security, fire detection, and energy efficiency systems. While Teledyne dominates with its extensive technology portfolio and established customer base, Honeywell shows strong potential to climb further in market positioning through continued innovations in commercial and safety-oriented IR solutions.
Source: Secondary Research, Interviews with Experts, MarketsandMarkets Analysis
INFRARED DETECTOR MARKET KEY PLAYERS
INFRARED DETECTOR MARKET SCOPE
| REPORT METRIC | DETAILS |
|---|---|
| Market Size in 2024 (Value) | USD 0.58 Billion |
| Market Forecast in 2030 (Value) | USD 1.02 Billion |
| Growth Rate | CAGR of 9.6% from 2025 to 2030 |
| Years Considered | 2021–2030 |
| Base Year | 2024 |
| Forecast Period | 2025–2030 |
| Units Considered | Value (USD Billion), Volume (Thousand Units) |
| Report Coverage | Revenue forecast, company ranking, competitive landscape, growth factors, and trends |
| Segments Covered |
|
| Regional Scope | North America, Europe, Asia Pacific, and RoW |
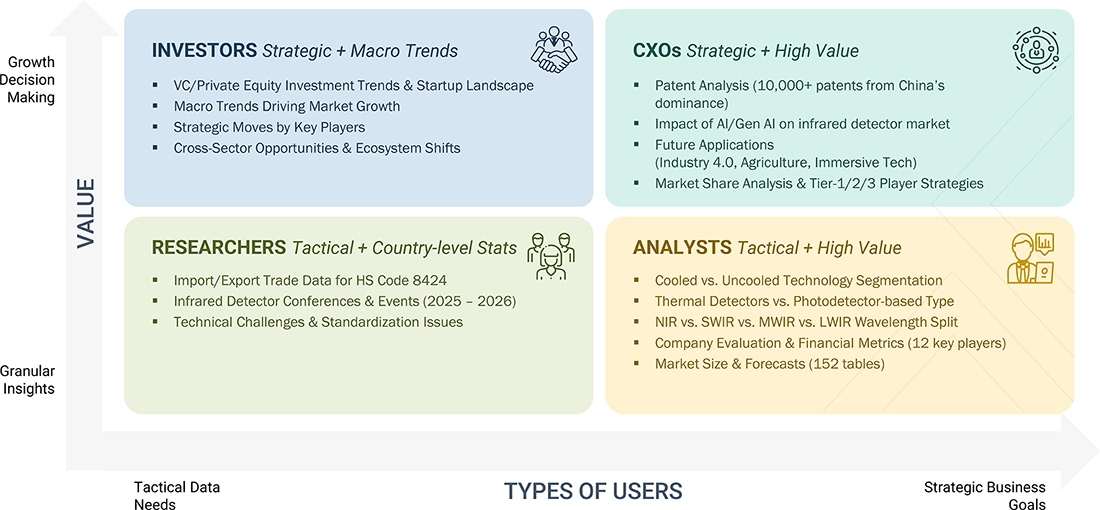
WHAT IS IN IT FOR YOU: Infrared Detector Market REPORT CONTENT GUIDE
DELIVERED CUSTOMIZATIONS
We have successfully delivered the following deep-dive customizations:
| CLIENT REQUEST | CUSTOMIZATION DELIVERED | VALUE ADDS |
|---|---|---|
| IR Detector Manufacturer |
|
|
| Aerospace & Defense OEM |
|
|
| Medical Device Company |
|
|
| Automotive Tier-1 Supplier |
|
|
RECENT DEVELOPMENTS
- May 2025 : Lynred introduced PICO640S Broad Band 7-14, a new uncooled infrared detector specifically designed for Optical Gas Imaging (OGI) applications to support climate action. This detector offers an affordable, high-resolution solution for continuous greenhouse gas leak detection, primarily targeting the oil and gas industry.
- January 2025 : Hamamatsu Photonics K.K. introduced C17212-011, a compact, RoHS-compliant mid-infrared detector module equipped with a built-in preamplifier designed to operate at room temperature. It features advanced back-illuminated InAsSb photodetectors that minimize temperature crosstalk and can be customized for wavelength sensitivity in the 5 μm, 8 μm, or 10 μm bands. With a fast response rate of 10 MHz, this module is well-suited for high-speed gas analysis, FTIR spectrometry, and CO2 laser monitoring.
- November 2024 : Hamamatsu Photonics' subsidiary, Photonics Management Corp., acquired BAE Systems Imaging Solutions, Inc., a semiconductor manufacturer specializing in high-performance CMOS image sensors in the visible to near-infrared and X-ray regions. The acquired company's core products include scientific CMOS image sensors known for high sensitivity, high-speed readout, and low noise, as well as X-ray CMOS image sensors used in dental and medical diagnostic applications.
Table of Contents
 Exclusive indicates content/data unique to MarketsandMarkets and not available with any competitors.
Methodology
The study involved four major activities in estimating the current size of the infrared detector market. Exhaustive secondary research was conducted to gather information on the market, adjacent markets, and the infrared detector landscape. These findings, assumptions, and projections were validated through primary research involving interviews with industry experts and key stakeholders across the value chain. Both top-down and bottom-up approaches were utilized to estimate the overall market size. Subsequently, market breakdown and data triangulation techniques were applied to determine the sizes of various segments and subsegments. Two key sources, secondary and primary, were leveraged to conduct a comprehensive technical and commercial assessment of the infrared detector market.
Secondary Research
The secondary research process involved various secondary sources to identify and collect necessary information for this study. These sources included annual reports, press releases, and investor presentations of companies; white papers; journals and certified publications; and articles from recognized authors, websites, directories, and databases. Secondary research was conducted to obtain key information about the industry’s supply chain, the market’s value chain, the total pool of key players, market segmentation according to the industry trends (to the bottom-most level), regional markets, and key developments from market- and technology-oriented perspectives. The secondary data was collected and analyzed to determine the overall market size, which was further validated through primary research.
Primary Research
Extensive primary research was conducted after gaining knowledge about the current scenario of the infrared detector market through secondary research. Several primary interviews were conducted with experts from the demand and supply sides across four major regions—North America, Europe, Asia Pacific, and RoW. This primary data was collected through questionnaires, emails, and telephonic interviews.

The three tiers of companies have been defined based on their total revenue as of 2024. The categorization given below has been applied: Tier 1: > USD 1 billion; tier 2: USD 250 million–USD 1 billion; and tier 3: < USD 250 million
Others include Sales Managers, Marketing Managers, and Product Managers.
To know about the assumptions considered for the study, download the pdf brochure
Market Size Estimation
Both top-down and bottom-up approaches were used to estimate and validate the total size of the infrared detector market. These methods were used to calculate the size of various subsegments in the market.
These approaches involved the following steps:
- Identifying products currently provided or expected to be offered by providers
- Tracking major infrared detector manufacturers
- Estimating the size of the infrared detector market based on demand
- Tracking ongoing and upcoming product launches by companies and forecasting the market based on these developments and other critical parameters
- Conducting multiple discussions with key opinion leaders to understand the demand for infrared detectors and analyzing the breakdown of the scope of work carried out by each major company
- Arriving at market estimates by analyzing revenues generated by manufacturers based on their locations (countries), and then combining country-based data to get a market estimate based on region
- Assigning a percentage to the overall revenue or, in a few cases, to each company’s segmental revenues to derive their revenues from the sales of infrared detectors. This percentage for each company has been assigned based on its product portfolio and target application
- Verify and cross-check estimates at every level through discussions with key opinion leaders, including CXOs, directors, operation managers, and domain experts at MarketsandMarkets
Infrared Detector Market : Top-Down and Bottom-Up Approach

Data Triangulation
After arriving at the overall size of the infrared detector market using the market size estimation process explained above, the total market was split into several segments and subsegments. Data triangulation and market breakdown procedures were employed, wherever applicable, to complete the overall market engineering process and arrive at the exact statistics for all segments and subsegments of the market. The data was triangulated by studying various factors and trends from the demand and supply sides. The market size was also validated using both the top-down and bottom-up approaches.
Market Definition
An infrared (IR) detector is a sensor device that identifies and measures infrared radiation (heat energy) emitted by objects. Infrared radiation lies just beyond the visible spectrum of light (wavelengths from about 0.7 µm to 14 µm) and is invisible to the human eye.
These detectors convert incoming IR radiation into an electrical signal, which can then be processed to produce images, detect motion, measure temperature, or analyze material properties.
Key Stakeholders
- Raw material and manufacturing equipment suppliers
- Semiconductor wafer vendors
- Fabless players
- Foundry players
- Original equipment manufacturers (OEMs)
- Original design manufacturers (ODMs)
- Networking solution providers
- Distributors and retailers
- Research organizations
- Technology standard organizations, forums, alliances, and associations
- Technology investors
- Value-added resellers (VARs)
Report Objectives
- To describe and forecast the size of the infrared detector market by type, technology, vertical, wavelength, application, and region in terms of value
- To describe and forecast the market size of various segments across four key regions—North America, Europe, Asia Pacific, and Rest of the World (RoW), in terms of value
- To forecast the size of the infrared detector market by type, in terms of volume
- To provide detailed information regarding the drivers, restraints, opportunities, and challenges influencing the growth of the infrared detector market
- To analyze the infrared detector value chain and ecosystem, along with the average selling price of thermal detector types
- To strategically analyze the regulatory landscape, tariffs, standards, patents, Porter’s five forces, import and export scenarios, impact of AI/Gen AI, trade values, US 2025 Tariff, and case studies pertaining to the market
- To strategically analyze micromarkets1 with regard to individual growth trends, prospects, and contributions to the overall market
- To analyze opportunities in the market for stakeholders by identifying high-growth segments
- To provide details of the competitive landscape for market leaders
- To provide details of the macroeconomic outlook for regions
- To analyze strategies, such as product launches, collaborations, and acquisitions, adopted by players in the infrared detector market
- To profile key players in the infrared detector market and comprehensively analyze their market ranking based on their revenue, market share, and core competencies2
Customization Options
With the given market data, MarketsandMarkets offers customizations according to the company’s specific needs. The following customization options are available for the report:
Company Information:
- Detailed analysis and profiling of additional market players (up to five)
Key Questions Addressed by the Report
1. What is the projected size of the Infrared Detector Market?
The global Infrared Detector Market Size is expected to grow from USD 0.65 billion in 2025 to USD 1.02 billion by 2030, registering a CAGR of about 9.6% during the forecast period. The growth is driven by increasing demand for infrared sensing technologies across industrial, security, and automotive applications.
2. What are infrared detectors and how do they work?
Infrared detectors are electronic devices that detect infrared radiation emitted by objects due to their temperature. These detectors convert infrared energy into electrical signals, enabling systems such as thermal cameras, motion sensors, and temperature measurement devices to function effectively.
3. What factors are driving the growth of the Infrared Detector Market?
The Infrared Detector Market Growth is driven by increasing demand for thermal imaging, surveillance systems, industrial automation, and automotive safety technologies. Rising adoption of infrared sensors in smart devices and security applications is also contributing to market expansion.
4. What are the main types of infrared detectors used in the market?
The Infrared Detector Market Industry includes two major types: thermal detectors and photodetectors. Thermal detectors include technologies such as pyroelectric detectors, thermopiles, and microbolometers, while photodetectors include materials like indium gallium arsenide (InGaAs) and mercury cadmium telluride (MCT) used in high-performance sensing applications.
5. What are the key applications of infrared detectors?
Infrared detectors are widely used in people and motion sensing, security and surveillance, gas and fire detection, spectroscopy, and biomedical imaging. These applications help improve safety, monitoring, and automation across various industries.
6. What are cooled and uncooled infrared detectors?
In the Infrared Detector Market, detectors are categorized as cooled and uncooled systems. Cooled detectors provide higher sensitivity and are used in defense or scientific applications, while uncooled detectors operate at ambient temperature and are widely used in commercial thermal imaging and motion sensing devices.
7. Which region is expected to grow fastest in the Infrared Detector Market?
The Asia Pacific region is expected to witness the fastest growth in the Infrared Detector Market due to increasing investments in industrial automation, consumer electronics, security systems, and automotive technologies.
8. What are the key technologies used in infrared detection?
Key technologies in the Infrared Detector Market Trends include microbolometers, thermopile detectors, pyroelectric sensors, and semiconductor photodetectors. These technologies enable precise temperature sensing and thermal imaging in industrial and defense systems.
9. Who are the major players in the Infrared Detector Market?
Leading companies in the Infrared Detector Market Industry include Teledyne Technologies, Texas Instruments, Honeywell International, Murata Manufacturing, and Hamamatsu Photonics. These companies focus on innovation and advanced sensing technologies to strengthen their market presence.
10. What are the major trends shaping the future of the Infrared Detector Market?
Key Infrared Detector Market Trends include the growing adoption of thermal imaging systems, smart sensors, and AI-enabled detection technologies. Increasing demand for infrared sensors in autonomous vehicles, security systems, and industrial monitoring is expected to drive long-term market growth.
Need a Tailored Report?
Customize this report to your needs
Get 10% FREE Customization
Customize This ReportPersonalize This Research
- Triangulate with your Own Data
- Get Data as per your Format and Definition
- Gain a Deeper Dive on a Specific Application, Geography, Customer or Competitor
- Any level of Personalization
Let Us Help You
- What are the Known and Unknown Adjacencies Impacting the Infrared Detector Market
- What will your New Revenue Sources be?
- Who will be your Top Customer; what will make them switch?
- Defend your Market Share or Win Competitors
- Get a Scorecard for Target Partners

Custom Market Research Services
We Will Customise The Research For You, In Case The Report Listed Above Does Not Meet With Your Requirements
Get 10% Free CustomisationTESTIMONIALS

Tetsuya Ohhira
Business Development Manager-Technology Business
Nikon Corporation,
Leading Japanese MNC specializing in optics and imaging productswww.nikon.com
MarketsandMarkets™ response
is quick. Their attitude is flexible and positive. Analyst Insights are globally considered and
significant. Client Services quickly respond to our inquiry and demand. Their wide range of global
surveys help us make our strategic plan.
We hope Knowledge Store will be easier to search
for a report.
VP - Marketing & Business Development
Leading Provider of Process Control Solutions
We engaged with MarketsandMarkets on a study to perform an analysis and recommend a Go-To-Market strategy for metrology and process control in the semiconductor market. The study was tailored to our targets and needs with well-defined milestones. Our overall experience with the MarketsandMarkets team was very good throughout the project in all aspects including the analysis methodologies used, the quality and depth of primary and secondary data sets, the professionalism and flexibility of the team and the ability to meet the target schedule and milestones. We want to thank MarketsandMarkets team for a job well done.
- US Infrared Detector Market
- Canada Infrared Detector Market
- Mexico Infrared Detector Market
- Germany Infrared Detector Market
- UK Infrared Detector Market
- France Infrared Detector Market
- Italy Infrared Detector Market
- Netherlands Infrared Detector Market
- Poland Infrared Detector Market
- Nordic Countries Infrared Detector Market
- Rest Of Europe Infrared Detector Market
- China Infrared Detector Market
- Japan Infrared Detector Market
- India Infrared Detector Market
- South Korea Infrared Detector Market
- Australia Infrared Detector Market
- Taiwan Infrared Detector Market
- Thailand Infrared Detector Market
- Vietnam Infrared Detector Market
- Indonesia Infrared Detector Market
- Malaysia Infrared Detector Market
- Rest Of Asia Pacific Infrared Detector Market
Growth opportunities and latent adjacency in Infrared Detector Market


RANDRIA
Oct, 2022
More details about the growth rate of the detector IR market for the next 8 years. .
Dean
Apr, 2026
For new deployments, should buyers prioritize uncooled detector technologies, or are there scenarios where cooled detectors still offer better ROI?.
Alexander
Apr, 2026
How is the infrared detector market expected to evolve over the next 5 years in terms of technology convergence, application expansion, and competitive intensity?.