
Knee Replacement Surgery Market Size, Growth, Share & Trends Analysis

Knee Replacement Surgery Market by Procedure Type (Knee Replacement: Total, Partial, Revision), Product (Implants: Hybrid, Plastic, Metal or Ceramic; Orthobiologic, Braces), Application (Arthritis, Cancer), End User (Clinics, ASCs) - Global Forecast to 2030


OVERVIEW
Source: Secondary Research, Interviews with Experts, MarketsandMarkets Analysis
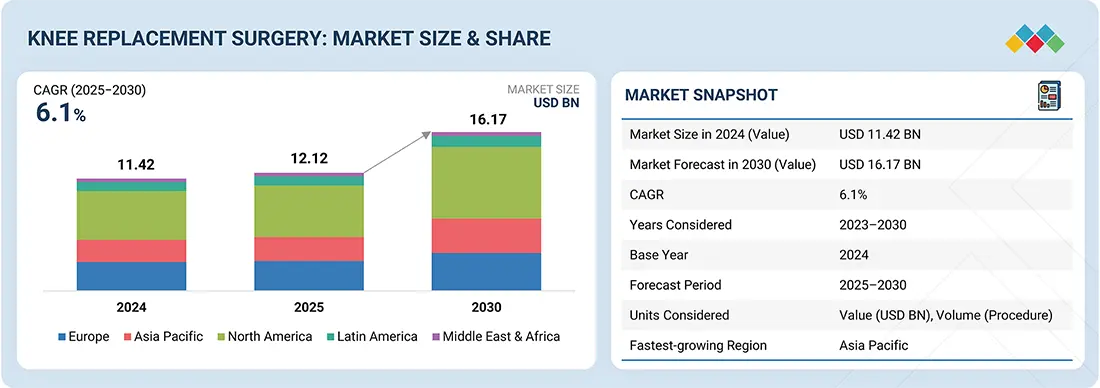
The global knee replacement surgery market is expected to reach USD 16.17 billion by 2030 from USD 12.12 billion in 2025, at a CAGR of 6.1% from 2025 to 2030. The market has grown due to increased cases of osteoarthritis, rheumatoid arthritis, obesity-related joint deterioration, and the aging global population. The growth is supported by better access to healthcare, favorable reimbursement policies, and greater awareness of minimally invasive procedures. Besides traditional total knee arthroplasty (TKA), partial replacements and revision surgeries are also becoming more common, especially as clinical guidelines and technological advances improve implant durability. Digitization, robotics-assisted systems, and patient-specific implants are transforming the competitive landscape of the market, making knee replacement one of the fastest-evolving orthopedic procedures domains.
KEY TAKEAWAYS
- The North America knee replacement surgery market accounted for a 43.4 % share in 2024
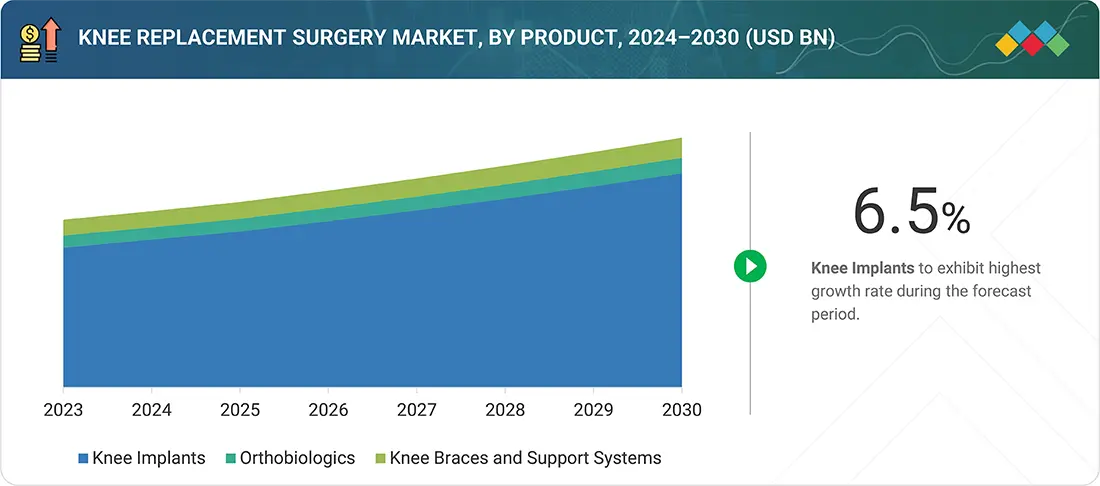
- By product, the knee implants segment is expected to register the highest CAGR of 6.5%
- By procedure, the total knee replacement segment accounted for a 63.7% share in 2024.
- By application, the osteoarthritis & rheumatoid arthritis segment is expected to register highest CAGR of 6.6%
- By end-user, the hospitals segment is expected to dominate the market, growing at the highest CAGR of 6.6%
- Companies Zimmer Biomet, Stryker corporation , Johnson & Johnson, were identified as some of the star players among others in the knee replacement surgery market (global), given their broad knee implant protfolios, global distribution strength and innovation in robotics-assisted knee surgery
- Companies Olympus Corporation, Bauerfrind, Embla Medical, among others, have distinguished themselves among startups and SMEs by their well developed marketing channels, funding and specialized niche solutions.
The knee replacement surgery products market is rapidly expanding and transforming, driven by increasing osteoarthritis rates, aging populations, obesity trends, and a steady shift of procedures to outpatient settings. Demand for products is organized into four interconnected categories: (1) Implants—with cementless and kinematic-alignment designs gaining popularity, porous and 3D-printed surfaces enhancing osseointegration, and “smart” options (sensor-enabled trials/inserts) beginning to influence post-op care; (2) Enabling technologies—robotics and computer-assisted navigation transitioning from “nice-to-have” to standard practice in high-volume centers, supported by AI-driven planning and templating that enhance component sizing, soft-tissue balance, and consistency; (3) Perioperative solutions and disposables—patient-specific cutting guides, sterile kits, and advanced pain-management and hemostasis products aligned with ERAS protocols that reduce hospital stays and facilitate same-day discharge; and (4) Digital and remote care—apps, wearables, and rehab platforms that connect pre-habilitation to remote physiotherapy and outcome tracking, providing real-world evidence and strengthening value-based contracts.
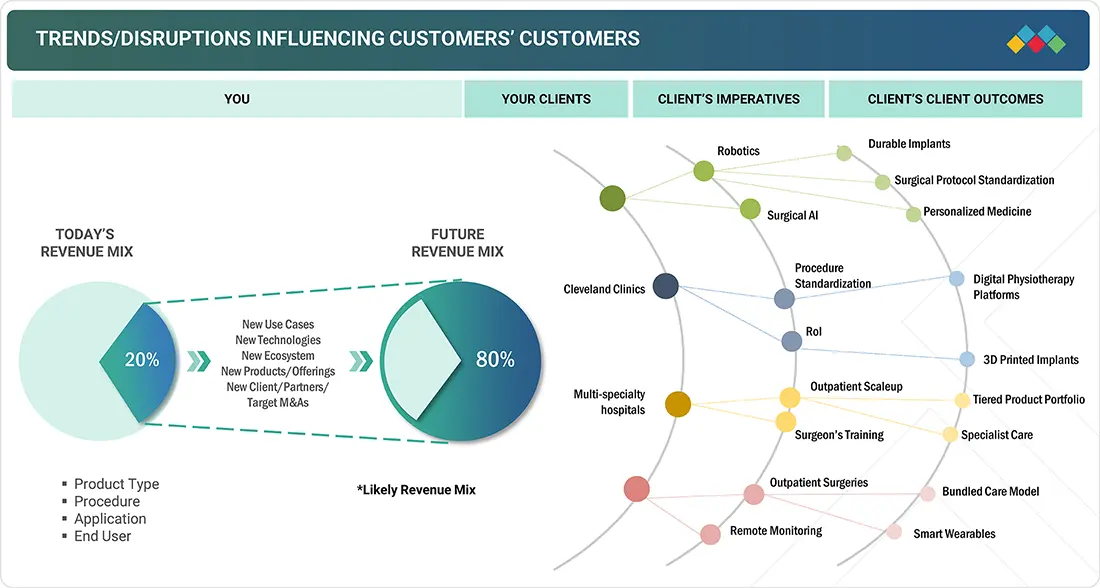
TRENDS & DISRUPTIONS IMPACTING CUSTOMERS' CUSTOMERS
Orthopedic device manufacturers and healthcare providers are facing significant changes that affect both clinical practices and business strategies. The increasing use of robotics and computer-assisted navigation systems is transforming surgical workflows, prompting customers to invest in capital equipment, training, and digital platform integration. Growing demand for outpatient and same-day discharge models is pushing hospitals and ambulatory surgery centers to redesign their infrastructure and perioperative care pathways. Value-based healthcare is another disruptive force, encouraging payers and providers to prioritize cost-effectiveness and long-term implant performance over procedural volume. Additionally, consolidation among hospital networks and group purchasing organizations is changing procurement dynamics, increasing pricing pressure on OEMs. Lastly, sustainability issues—such as implant recycling programs and environmentally responsible supply chains—are becoming new business priorities in developed healthcare markets.
Source: Secondary Research, Interviews with Experts, MarketsandMarkets Analysis
MARKET DYNAMICS
Level
-
Higher prevalence of OA and rheumatoid arthritis

Level
-
Premiumization of knee surgeries

Level
-
Innovations in robotic-assisted orthopedic surgeries and 3D printing

Level
-
Dearth of skilled orthopedic surgeons

Source: Secondary Research, Interviews with Experts, MarketsandMarkets Analysis
Driver: Higher prevalence of OA and rheumatoid arthritis
The most significant driver is the rapidly growing patient population for osteoarthritis and rheumatoid arthritis, along with approximately 1.5 billion older adults projected by 2050. Increasing obesity rates and sedentary lifestyles are also boosting the prevalence of degenerative knee conditions worldwide. Technological innovations, especially customized implants, AI-based pre-surgical planning, and robotic-assisted surgical systems, enhance precision, improve outcomes, and extend implant lifespan, encouraging wider adoption. Additionally, governments and insurers in developed markets are providing favorable reimbursement for minimally invasive and robotic knee replacement surgeries, which further drives market penetration. Meanwhile, medical tourism hubs like India, Thailand, and Turkey are becoming attractive growth markets due to lower procedure costs and expanding private hospital infrastructure..
Restraint: Premiumization of knee surgeries
Despite growth, the market still faces ongoing challenges. High surgical costs remain a barrier, especially in emerging economies with limited reimbursement coverage. Implant recalls and product failures have created reputational risks for OEMs, emphasizing the need for strict quality control. The availability of skilled surgeons is another obstacle, particularly in lower-income regions where access to advanced surgical training and robotics platforms is limited. Increasing competition from alternative treatments like regenerative medicine, stem cell therapy, and cartilage restoration procedures also threatens by delaying or replacing the need for knee replacement. Additionally, economic pressures in developed countries are boosting price negotiations, restricting OEMs’ ability to increase margins.
Opportunity: Innovations in robotic-assisted orthopedic surgeries and 3D printing
Significant opportunities exist in expanding adoption across emerging markets where procedure volumes are still low despite large patient pools. The development of smart implants with embedded sensors for real-time patient monitoring and post-surgical recovery tracking is expected to create new revenue streams for OEMs and digital health providers. Outpatient knee replacement procedures, supported by enhanced recovery after surgery (ERAS) protocols, offer growth potential for ambulatory surgical centers. Partnerships between MedTech companies and insurers to provide bundled payment models will also boost adoption. Additionally, advances in biomaterials—such as 3D-printed implants and bioresorbable polymers—provide opportunities to differentiate product portfolios in a competitive market.
Challenge: Dearth of skilled orthopedic surgeons
A key challenge is ensuring affordability and equitable access in low- and middle-income countries where patient need is high, but healthcare resources are limited. Implant price caps in markets such as India are restricting profitability and forcing companies to redesign go-to-market strategies. OEMs are also under increasing scrutiny for sustainability practices, including waste generated from implant packaging and surgical kits. Another challenge involves clinical evidence generation: payers are demanding long-term data on implant survival and patient outcomes, requiring OEMs to invest in costly registries and real-world evidence platforms. Finally, cyber risks associated with connected surgical robots and AI-driven planning systems present an emerging challenge as digitalization accelerates in the operating room.
Knee Replacement Surgery Market: COMMERCIAL USE CASES ACROSS INDUSTRIES
| COMPANY | USE CASE DESCRIPTION | BENEFITS |
|---|---|---|
 |
Advanced knee implant systems (e.g., Triathlon Knee System) designed to mimic natural knee kinematics. | Improved implant longevity and patient satisfaction, Enhanced surgical precision, reducing revision rates |
 |
Comprehensive knee portfolio including Persona Knee system offering patient-specific sizing and fit. | Greater customization for individual patient anatomy, Consistent and reproducible results due to robotic guidance. |
|
|
Attune Knee System featuring advanced kinematics and proprietary materials | Better implant wear resistance, increasing lifespan of prosthesis, Reduced pain and instability post-surg |
 |
JOURNEY II Total Knee System with OXINIUM technology for enhanced wear resistance | Increased implant durability and reduced risk of metal ion release, Bone preservation due to precise, less invasive resections |
Logos and trademarks shown above are the property of their respective owners. Their use here is for informational and illustrative purposes only.
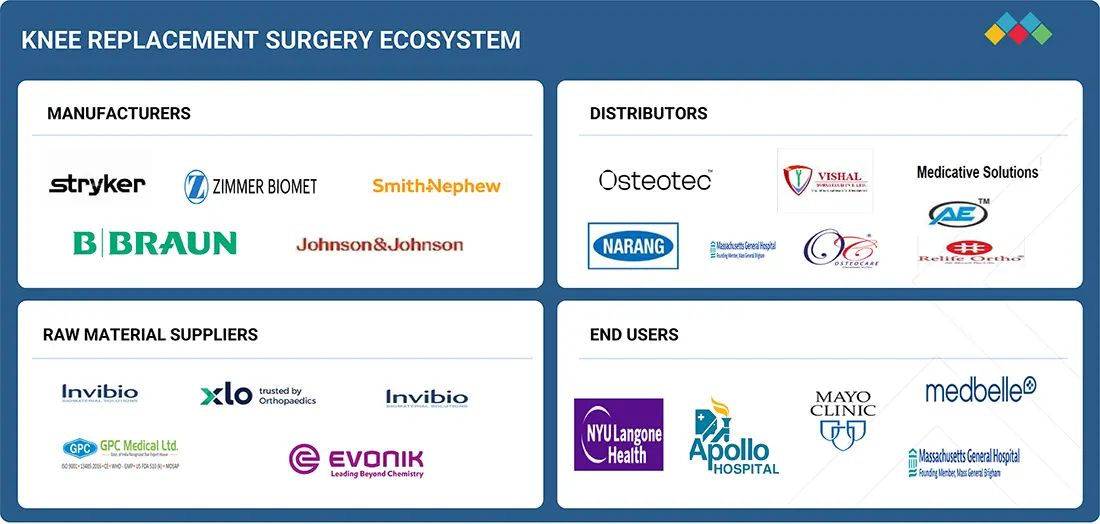
MARKET ECOSYSTEM
The knee replacement surgery market ecosystem includes a diverse range of stakeholders that collectively promote innovation, access, and adoption of procedures worldwide. Leading the sector are implant manufacturers such as Zimmer Biomet, Stryker, Johnson & Johnson (DePuy Synthes), and Smith & Nephew, who lead with extensive product lines, robotics-assisted technologies, and digital planning tools. These OEMs are supported by emerging companies like Corin, MicroPort, and Conformis, which emphasize cost-effective implants, patient-specific designs, and regional growth, especially in the Asia Pacific and Europe. Robotics and navigation system providers—including Stryker’s Mako, Zimmer’s ROSA, and Smith & Nephew’s CORI—play a transformative role in reshaping surgical workflows, improving precision, and enabling minimally invasive procedures. Their ecosystem value lies in integrating with hospital IT systems, surgical imaging, and cloud-based platforms for planning and outcomes tracking. Healthcare providers such as multispecialty hospitals, orthopedic surgery centers, and increasingly, ambulatory surgery centers (ASCs), act as the delivery channel for most procedures. Hospitals lead in handling complex revision surgeries and high-volume TKAs, while ASCs are growing rapidly in markets like the US due to payer pressure for outpatient procedures. Distributors and procurement networks, including group purchasing organizations (GPOs), influence pricing and vendor selection, especially in North America and Europe. Their bargaining power is shaping cost-containment strategies across the value chain. Digital health and software analytics firms are emerging as critical partners, offering AI-driven pre-operative planning, real-world evidence platforms, and post-surgical monitoring apps. Companies like Zimmer Biomet’s mymobility app (with Apple Watch integration) are leading this trend, helping bridge implant performance with patient engagement. Raw material and biomaterial suppliers (e.g., advanced alloys, ceramics, polymers) form the upstream supply chain, with innovation in 3D-printed titanium, porous metals, and bioresorbable polymers expanding future implant designs.
Logos and trademarks shown above are the property of their respective owners. Their use here is for informational and illustrative purposes only.
MARKET SEGMENTS
Source: Secondary Research, Interviews with Experts, MarketsandMarkets Analysis
Knee Replacement Surgery Market, By Prcoedure
The total knee replacement (TKR) segment accounts for over 70% of global procedures, driven by the increasing prevalence of end-stage osteoarthritis. Partial knee replacements are experiencing steady growth, supported by advances in implant technology and growing surgeon confidence in minimally invasive techniques. Meanwhile, revision surgeries, though a smaller portion of the market, are expanding rapidly due to challenges related to implant longevity and survivorship, which necessitate corrective procedures.
Knee Replacement Surgery Market, By End User
Hospitals remain the main end users, making up over two-thirds of the global market due to their advanced infrastructure and capacity to manage complex and specialized knee treatments. However, ambulatory surgery centers (ASCs) are experiencing faster growth, especially in the US and Europe, as payers promote cost-effective outpatient options. Orthopedic specialty clinics in Asia-Pacific are also expanding their roles to meet the increasing demand from medical tourism.
Knee Replacement Surgery Market, By Product
Implants continue to be the primary source of revenue in the industry. While cemented designs remain prevalent, cementless implants are increasingly popular due to their advantages in osseointegration, shorter surgical procedures, and appeal to younger, more active patients. Innovation in materials is also driving product differentiation, with advances such as porous metals, titanium alloys, highly cross-linked polyethylene, and customized 3D-printed implants designed to improve fit, durability, and overall outcomes.
REGION
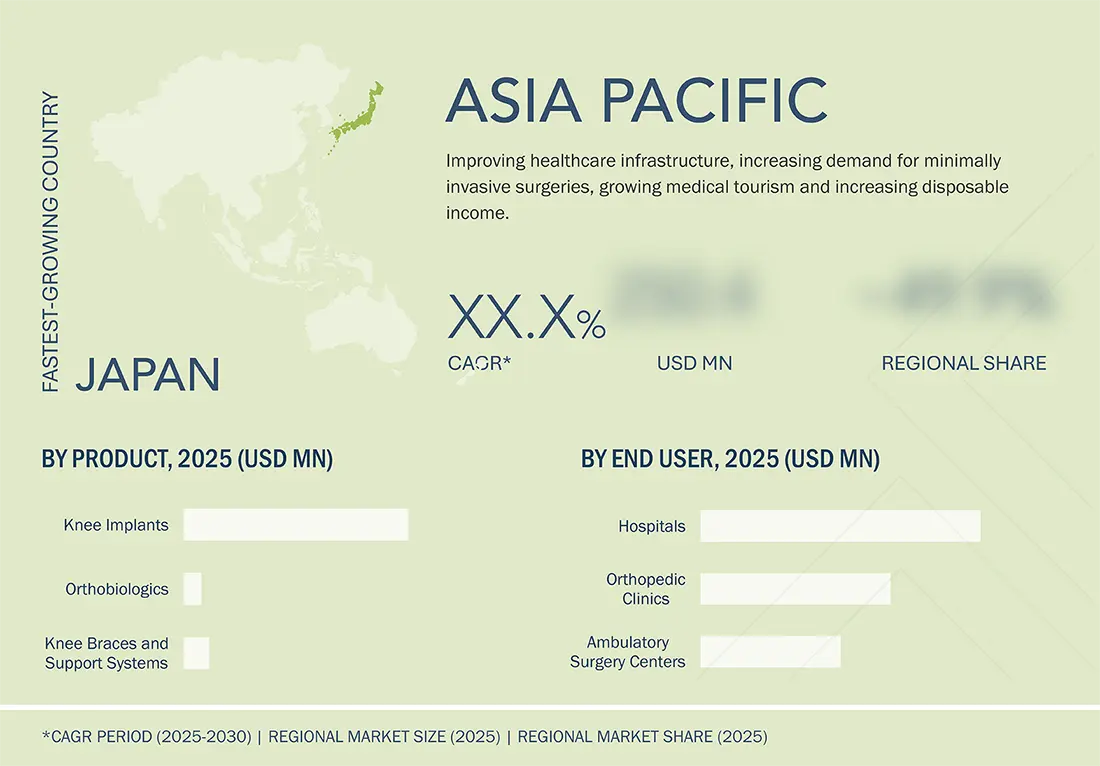
The Asia Pacific market is expected to register the highest growth rate during the forecast period
Asia Pacific is expected to achieve the highest growth rate through 2030, driven by large patient populations, government investments in healthcare infrastructure, and expanding medical tourism centers. China and India are fueling double-digit growth through increased healthcare access and more affordable surgical options. The region is experiencing an unprecedented rise in knee treatment surgeries, fueled by the growing prevalence of musculoskeletal conditions such as arthritis and osteoporosis, especially in countries like Japan, China, and India. This demographic shift is further supported by rising disposable incomes and better access to healthcare services. The region's healthcare infrastructure is quickly advancing, with investments in cutting-edge technologies like minimally invasive surgical techniques and robotic-assisted procedures, which are improving surgical results and patient recovery times.
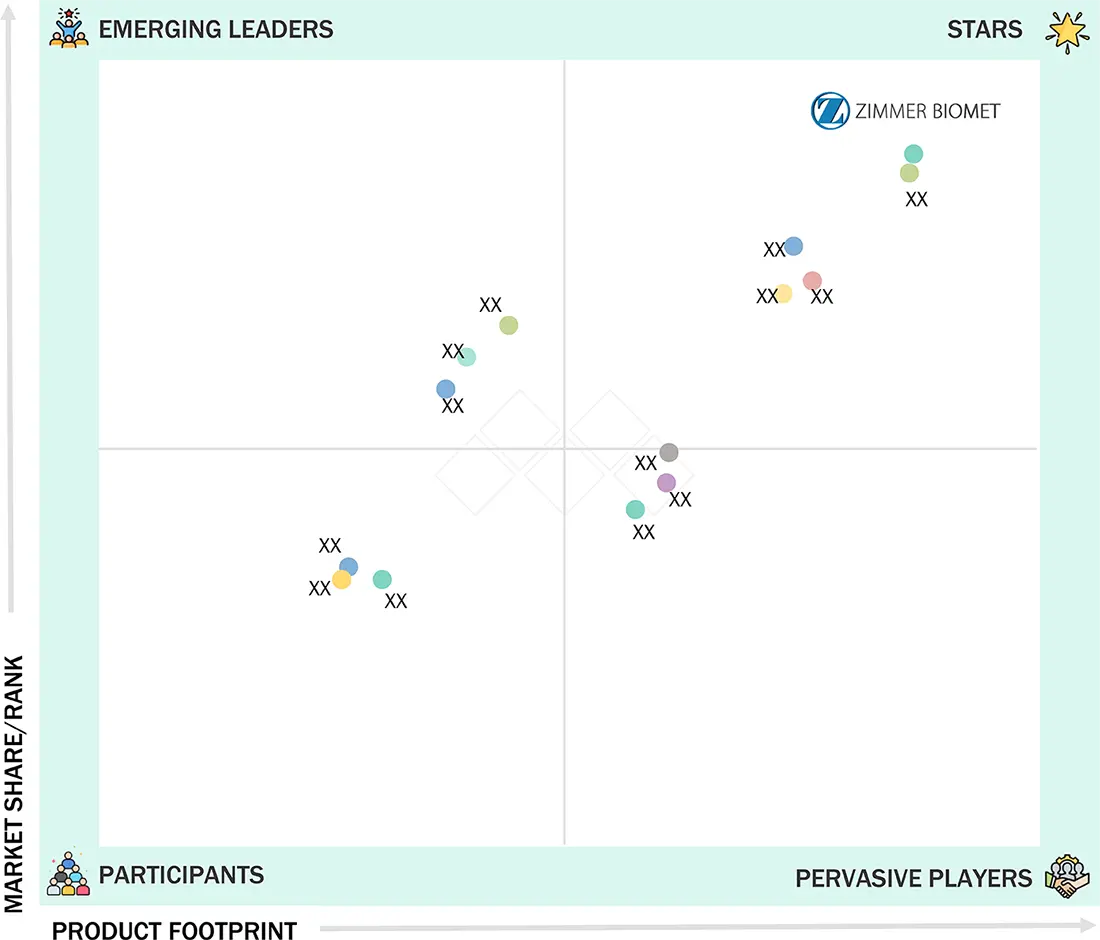
Knee replacement surgery market: COMPANY EVALUATION MATRIX
The market is moderately consolidated, with leaders such as Zimmer Biomet, Stryker, DePuy Synthes (Johnson & Johnson), and Smith & Nephew holding significant shares. These companies are investing heavily in robotics platforms, smart implants, and digital planning tools to stay competitive. New entrants are setting themselves apart through affordable implants, 3D-printed solutions, and a strong presence in the Asia Pacific markets. The broader ecosystem includes implant manufacturers, robotics developers, hospital networks, group purchasing organizations, insurance providers, and research institutions working together to improve surgical precision, patient outcomes, and affordability.
Source: Secondary Research, Interviews with Experts, MarketsandMarkets Analysis
KEY MARKET PLAYERS
MARKET SCOPE
| REPORT METRIC | DETAILS |
|---|---|
| Market Size in 2024 (Value) | USD 11.42 Billion |
| Market Forecast in 2030 (value) | USD 16.17 Billion |
| Growth Rate | CAGR of 6.1% from 2025-2030 |
| Years Considered | 2022-2030 |
| Base Year | 2024 |
| Forecast Period | 2025-2030 |
| Units Considered | Value (USD Thousand), Volume (Procedure) |
| Report Coverage | Revenue forecast, company ranking, competitive landscape, growth factors, and trends |
| Segments Covered |
|
| Regions Covered | North America, Asia Pacific, Europe, Middle East & Africa, and Latin America |
WHAT IS IN IT FOR YOU: Knee replacement surgery market REPORT CONTENT GUIDE
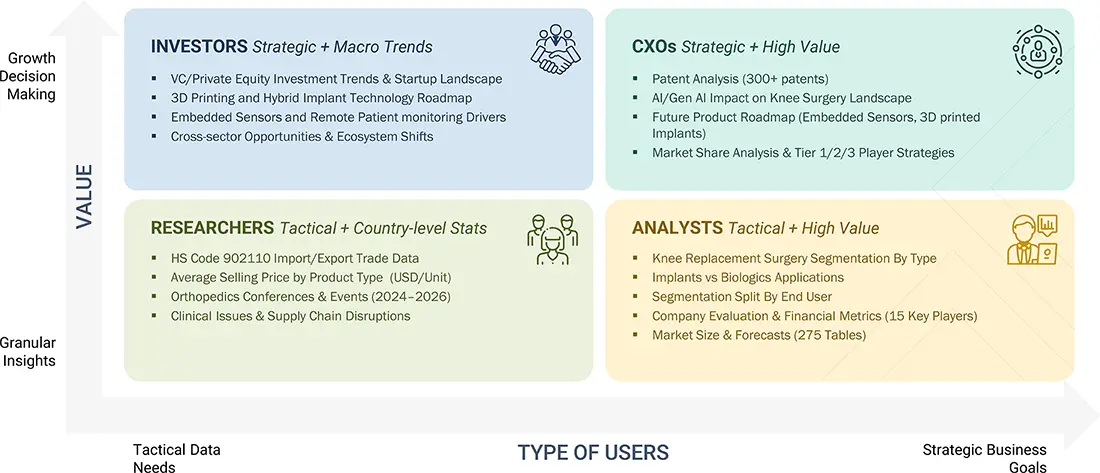
DELIVERED CUSTOMIZATIONS
We have successfully delivered the following deep-dive customizations:
| CLIENT REQUEST | CUSTOMIZATION DELIVERED | VALUE ADDS |
|---|---|---|
| Hospitals & Ambulatory Surgical Centers (ASCs) |
|
|
| Private Equity & Strategic Investors | Market-adoption benchmarking for smart implants, 3D-printed custom implants, and AR surgical planning platforms |
|
RECENT DEVELOPMENTS
- January 2025 : Zimmer Biomet and Paragon 28 entered into a definitive agreement for Zimmer Biomet to acquire all shares of Paragon 28
- September 2024 : Stryker (US) acquired Care.ai to deliver ambient intelligence solutions, smart room technologies, and AI-assisted virtual care processes.
- July 2024 : Smith+Nephew (UK) partnered with Healthcare Outcomes Performance Company. This deal focused on enhanced solutions for healthcare professionals, patients, and ASCs via their platform.
- June 2024 : Zimmer Biomet (US) announced a distribution agreement with THINK Surgical. Zimmer Biomet tech will be incorporated with the TMNII robotic solution by THINK Surgical.
- March 2024 : Stryker (US) acquired SERF SAS to expand its European presence and strengthen its implant product line
Table of Contents
 Exclusive indicates content/data unique to MarketsandMarkets and not available with any competitors.
Methodology
This study was done through primary and secondary sources. In-depth secondary research gathered insights into the knee treatment surgery industry. The findings, assumptions, and market size estimates were then validated through primary research. Both top-down and bottom-up approaches were used to determine the total market size. Then, market segmentation and data triangulation methods were applied to determine the sizes of segments and sub-segments of the knee replacement surgery market. The research process also involved analyzing industry trends, segmentation types, key players, competitive landscape, market dynamics, and initiatives of key companies.
Secondary Research
The secondary research phase involved analyzing various sources, including industry directories, databases (such as Bloomberg Businessweek, Factiva, and D&B Hoovers), white papers, company filings, annual reports, investor presentations, and SEC filings. This research was essential in collecting technical, commercial, and market-related insights into the knee replacement surgery products sector. It also assisted in knowing key market players, segment classifications, and industry trends. Moreover, secondary research helped track market developments, advanced technologies, and competitive positioning. A database of major industry players was compiled by reviewing paid and publicly available data sources. The market evaluation of orthopedic device providers was based on assessing their product portfolios, performance, and overall quality. Furthermore, secondary research provided critical insights into the industry’s value chain, the key market participants, and classifications from technological and market-driven perspectives.
Primary Research
During the primary research, cross sections of sources from the demand and supply sides were interviewed to gather qualitative and quantitative information for this report. On the supply side, primary sources included industry players such as CEOs, vice presidents, marketing and sales directors, technology and innovation directors, and other key executives from leading companies and organizations in the knee replacement surgery industry. Demand-side sources comprised hospitals, ambulatory surgical centers, and orthopedic clinics. Primary research was conducted to authenticate market segments, monitor key players, and understand market trends. Following market engineering, which included calculation in statistics, segmentation analysis, estimation of the market, forecasting, and data triangulation, primary research was conducted to verify the key information.
A breakdown of the primary respondents is provided below:

*Others include sales managers, marketing managers, business development managers, product managers, distributors, and suppliers.
Note: Companies are classified into tiers based on their total revenue. As of 2023, Tier 1 = >USD 2 billion, Tier 2 = USD 50 million to USD 2 billion, and Tier 3 = < USD 50 million.
To know about the assumptions considered for the study, download the pdf brochure
Market Size Estimation
Both top-down and bottom-up approaches were used to estimate and validate the total size of the lab consumable market. These methods were also used extensively to estimate the size of various segments in the knee replacement surgery market.
Revenue share analysis was employed with the leading players to determine the size of the global Knee replacement surgery market. In this case, key players in the market have been identified, with their knee replacement surgery products business revenues determined through various insights gathered during the primary and secondary research phases. Secondary research included the study of top market players' annual and financial reports. On the other hand, primary research incorporated in-depth interviews with key opinion leaders, particularly chief executive officers, directors, and key marketing executives.
The research methodology used to estimate the market size includes the following:

Data Triangulation
After determining the overall market size through the estimation process, the global knee replacement surgery market was categorized into segments. Data triangulation methods were utilized to finalize the market engineering process and obtain precise statistics for each segment. This approach involved analyzing multiple factors and trends from both the demand and supply perspectives. Furthermore, the knee replacement surgery market was verified using a combination of top-down and bottom-up approaches.
Market Definition
Knee surgical interventions utilize an array of devices, including diverse knee implants, orthopedic braces, and supportive products, as well as orthobiologics designed for the stabilization and management of conditions such as osteoarthritis, rheumatoid arthritis, neoplasms, and degenerative diseases, among other clinical applications.
Stakeholders
- Knee Replacement Surgery Product Manufacturing Companies
- Product Distributors and Channel Partners
- Hospitals and Surgical Centers
- Orthopedic Clinics
- Ambulatory Care Centers
- Sports Institutes and Organizations
- Contract Manufacturers and Third-party Suppliers
- Research Laboratories and Academic Institutes
- Clinical Research Organizations (CROs)
- Government and Non-governmental Regulatory Authorities
- Market Research and Consulting Firms
Report Objectives
- To define, describe, and forecast the global knee replacement surgery market based on product, procedure type, application, end user, and region
- To provide detailed information regarding the major factors influencing the market growth (drivers, restraints, opportunities, and challenges) along with the current trends
- To strategically analyze micromarkets1 with respect to their individual growth trends, future prospects, and contributions to the total market
- To analyze opportunities in the market for stakeholders and provide details of the competitive landscape for market leaders
- To forecast the revenue of the market segments for five regions: North America (US and Canada), Europe (Germany, France, UK, Italy, Spain, and Rest of Europe), the Asia Pacific (China, Japan, India, South Korea, Australia, and Rest of Asia Pacific), Latin America (Brazil, Mexico, and Rest of Latin America), and the Middle East & Africa
- To profile the key players and comprehensively analyze their market shares and core competencies2
- To track and analyze competitive developments in the knee replacement surgery market, such as acquisitions, product launches, expansions, agreements, joint ventures, alliances, and collaborations
Key Questions Addressed by the Report
What is the anticipated addressable market value of the global knee replacement surgery market in 6 years?
The market is projected to grow from USD 11.42 billion in 2024 to USD 16.17 billion by 2030, at a CAGR of 6.1%.
What strategies are top market players pursuing to enter emerging regions?
Strategies include research collaborations, distribution partnerships/agreements, and expansions.
What are the key growth-limiting factors for the knee replacement surgery market?
A major limiting factor is the lack of experienced orthopedic surgeons.
Which key companies are operating in the knee replacement surgery market?
Leading companies include Zimmer Biomet, Johnson & Johnson Services, Inc., and Stryker.
What factors are accountable for having the largest share of the North American region?
Factors include rising demand for minimally invasive procedures, increasing prevalence of osteoarthritis, a growing geriatric population, and the availability of technologically advanced replacement products.
Need a Tailored Report?
Customize this report to your needs
Get 10% FREE Customization
Customize This ReportPersonalize This Research
- Triangulate with your Own Data
- Get Data as per your Format and Definition
- Gain a Deeper Dive on a Specific Application, Geography, Customer or Competitor
- Any level of Personalization
Let Us Help You
- What are the Known and Unknown Adjacencies Impacting the Knee Replacement Surgery Market
- What will your New Revenue Sources be?
- Who will be your Top Customer; what will make them switch?
- Defend your Market Share or Win Competitors
- Get a Scorecard for Target Partners

Custom Market Research Services
We Will Customise The Research For You, In Case The Report Listed Above Does Not Meet With Your Requirements
Get 10% Free CustomisationTESTIMONIALS

JAYANT RAJPUROHIT
Director of Market Insights, Data and Analytics
SFI Health,
Leading Pharmaceutical Companywww.sfihealth.com/

We at SFI Health approached MarketsandMarkets for an Opportunity Assessment on "Incidence and Prevalence of Focus Indications" as we wanted to know the most attractive HCPs like Physician, Functional MD, Naturopath and Pharmacist. The project was critical for us to ensure our focus on the right target which would enable sustainable growth and profitability for SFI Health. The business insights provided exceeded our expectations and we were extremely impressed. The team at MarketsandMarkets is highly professional and detail oriented and very well understood our business needs. MarketsandMarkets offers a unique combination of expertise and dedicated engagement model. We identified 2 new products to be launched in coming months, based on the research findings provided by MarketsandMarkets. We are happy with the services and would strongly recommend MarketsandMarkets to my peers in the industry.

BEATRIZ DE LA CALLE
Head of Commercial Analytics
Qualicaps,
Leading Pharmaceutical Companywww.qualicaps.com/

We partnered with MarketsandMarkets for an assessment study on hard empty capsules. The team was extremely professional in understanding our business requirements and we received timely responses to all our queries. The market intelligence and the recommendations has met our business requirements. We were extremely impressed to see the final study results; it really exceeded our expectations. The market intelligence offered by MarketsandMarkets, and clarity on next steps will help us achieve our business objective for the Year 2021. We are happy with the services and would strongly recommend MarketsandMarkets to my peers in the industry.

Bob Williams,
Senior Director Business Development & Innovation
Bracco Diagnostics Inc.,
Italian Multinational in life sciences sector and a World Leader in imaging diagnosticsimaging.bracco.com/us-en
We were pleased with targeted insights that MarketsandMarkets identified from a custom study on the 'Radiation Dose Management Solutions Market'. Your team identified and characterized the market participants as well as underlying trends accurately. This study was useful to Bracco in formulating business strategies for our dose monitoring product lines and we thank MarketsandMarkets for the job well done.
Cody Coonradt,
Market Development and Strategy Manager
3M Health Information Systems,
Leader in Health care Coding, Payment & Analytics Solutions.www.3m.com/3M/en_US/health-information-systems-us
The value for our organization comes from three things: depth of research, specificity of segments and being easy to work with. As important as the first two are, the third can't be underestimated. MarketsandMarkets, maybe more than any other research vendor, wants to know what is top of mind for our team and what big questions we are grappling to answer.
Their customer first approach and high value engagement model, have given us great analysis and excellent value for money


Growth opportunities and latent adjacency in Knee Replacement Surgery Market