
LiDAR Simulation Market Size, Share & Analysis

LiDAR Simulation Market by LiDAR Type (Mechanical LiDAR, Solid-state LiDAR), Method (Testing Method, Simulation Method), Laser Wavelength (Short Infrared Spectrum and Long Wave Infrared Spectrum), Vehicle Type (Passenger Cars, Commercial Vehicles), Level of Autonomy, Application, and Region - Global Forecast to 2032


OVERVIEW
Source: Secondary Research, Interviews with Experts, MarketsandMarkets Analysis
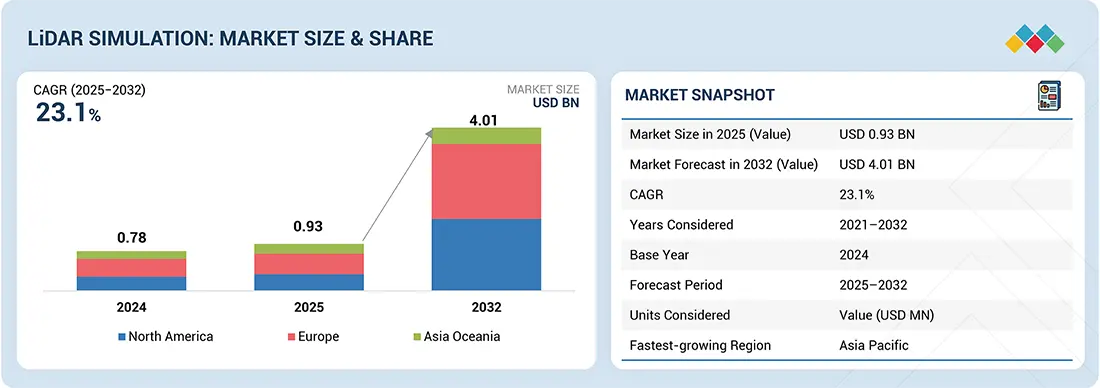
The global LiDAR simulation market is projected to reach USD 4.01 billion by 2032, growing from USD 0.93 billion in 2025, at a CAGR of 23.1%. The LiDAR testing and simulation market is poised for growth as automakers rely on virtual environments to safely and affordably replicate rare and complex driving scenarios. The shift to software-defined vehicles also fuels demand for high-fidelity simulation platforms to support continuous over-the-air (OTA) calibration and regression testing. However, the market faces significant challenges, including a lack of standardized testing protocols, which creates fragmented workflows and raises integration costs. Furthermore, the high computational demands of large-scale, physics-based LiDAR simulation make it expensive and less accessible for smaller companies.
Market Size and Forecast:
- Market Size Value in 2025: USD 0.93 Billion
- Revenue Forecast in 2032: USD 4.01 Billion
- Growth Rate: CAGR of 23.1% from 2025 to 2032
- Data available from 2021 to 2032
- Base year: 2024
- Forecast period: 2025–2032
Key Market Trends and Insights
- Market Growth: Growth is driven by rapid advancements in autonomous driving technologies, increasing deployment of ADAS features, and the growing need for cost-effective validation and testing of LiDAR-enabled perception systems.
-
Technology Impact: High-fidelity virtual testing environments, AI-powered scenario generation, digital twins, sensor fusion validation, and over-the-air (OTA) software testing are enhancing LiDAR simulation capabilities and reducing physical testing costs.
- Growing Trends: The market is witnessing increased adoption of solid-state LiDAR simulation, cloud-based testing platforms, software-defined vehicle development, autonomous vehicle validation tools, and simulation-based safety certification processes.
- Growth Opportunities: Opportunities are driven by expanding Level 3 and Level 4 autonomous vehicle programs, increasing robotaxi deployments, evolving vehicle safety regulations, and rising investments in next-generation autonomous mobility ecosystems.
KEY TAKEAWAYS
-
BY VEHICLE TYPELevel 2 and 2.5 autonomy lead in LiDAR simulation as they represent the most widely implemented automation stage. Automakers are expanding ADAS features like adaptive cruise control and lane-keeping to meet regulations such as the EU’s GSR2, effective from 2024. L2/2.5 is projected to surpass 30 million vehicles by 2025, making it the key driver for large-scale, cost-effective LiDAR testing and validation.
-
By METHODPhysical LiDAR testing will continue leading the market as it delivers essential validation under challenging real-world conditions like rain, fog, glare, and varying surface reflectivity—factors that simulations cannot fully replicate. While simulation is growing for its cost efficiency and scalability, automakers and Tier-1 suppliers still rely on physical trials as the ultimate benchmark for safety, regulatory compliance, and reliability, keeping it indispensable in LiDAR verification
-
BY LASER WAVELENGTHLiDAR at 905 nm is widely used in mainstream vehicles for its lower cost and compatibility with silicon sensors, but it is limited by range and eye-safety concerns. In contrast, 1550/1650 nm systems enable higher laser power, offering longer range and better performance in tough conditions like fog or bright sunlight. This makes them ideal for premium autonomous applications despite their higher costs.
-
BY LIDAR TYPESolid-state LiDAR is emerging as the preferred choice for automotive applications due to its affordability, compact design, and durability compared to mechanical LiDAR. With no moving parts, it offers higher reliability, easier vehicle integration, and mass production scalability while delivering the range and resolution needed for ADAS and autonomous driving. Major automakers like Mercedes-Benz, BMW, and leading Chinese EV brands are already adopting solid-state LiDAR in their premium and electric models.
-
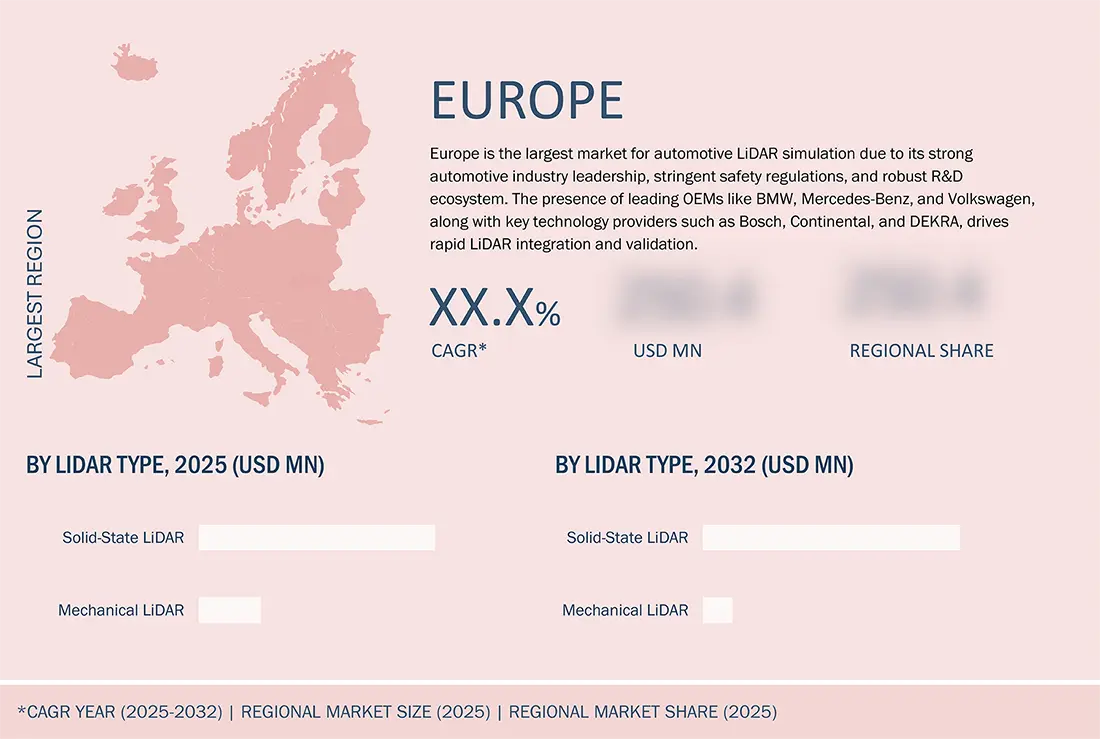
BY REGIONEurope dominates the LiDAR simulation market because its automotive sector is subject to rigorous government safety mandates (e.g., GSR2) requiring advanced ADAS and autonomous features. Organizations like DEKRA, AVL, dSPACE, and other test houses ensure a pipeline for pre-deployment validation, regulatory approval, and ongoing safety improvements.
-
COMPETITIVE LANDSCAPEThe key market players include Dekra (Germany), AVL (Austria), Valeo (France), RoboSense (China), Luminar Technologies (US), Vector Informak GmbH (Germany), Applied Intuition (US), Cognata (Israel), and Quanergy Solution, Inc. (US). These players have focused on global networking, mergers and acquisitions, partnerships, and technological advancement to grow their market presence.
LiDAR simulation and LiDAR over-the-air (OTA) simulation are projected to grow rapidly in the automotive industry as OEMs and Tier-1 suppliers accelerate development of ADAS and autonomous driving systems. The market is driven by the need to reduce physical testing costs, speed up validation cycles, and ensure sensor accuracy across diverse real-world conditions. With software-defined vehicles and OTA update capabilities becoming mainstream, LiDAR simulation allows continuous performance improvement, safer deployment of autonomy features, and compliance with evolving safety regulations. This growth will be reinforced by rising EV and robotaxi adoption, where LiDAR plays a critical role in perception and safety assurance.
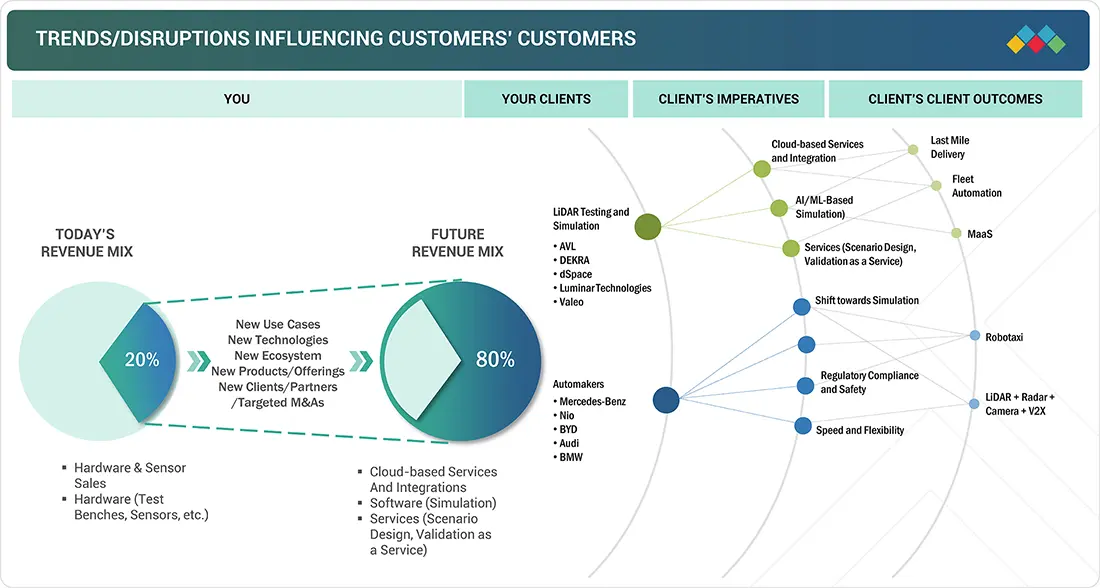
TRENDS & DISRUPTIONS IMPACTING CUSTOMERS' CUSTOMERS
The LiDAR simulation market is witnessing rapid growth, fueled by stringent safety regulations, robotaxis & autonomous features, and increased safety features like ADAS by OEMs from mid to high-end vehicles. Furthermore, government regulations in European countries, such as GSR2, which require advanced safety systems, which were mandated in July 2024, are pushing all automakers in European countries to adopt LIDAR in ADAS systems, driving the market. Hence, as OEMs have started offering LiDARs to meet advanced functionality and regulatory needs in premium and high-end passenger vehicles, the demand for sophisticated LiDAR simulation has increased globally.
Source: Secondary Research, Interviews with Experts, MarketsandMarkets Analysis
MARKET DYNAMICS
Level
-
Increase in safety regulations

-
Shift toward virtual validation

Level
-
Emergence of alternative technologies

Level
-
Cost reduction and scalability of testing infrastructure

-
Development of advanced simulation and validation tool

Level
-
Upfront cost of LiDAR

Source: Secondary Research, Interviews with Experts, MarketsandMarkets Analysis
Driver: Increase in safety regulations
Passenger car safety standards are tightening globally as regions, including the US, EU, China, Japan, and India, enforce stricter mandatory regulations and enhance NCAP rating programs to reduce fatalities and severe injuries. This drives automakers to adopt advanced safety technologies like LiDAR, essential for compliance with mandates such as Europe’s GSR2 requiring Advanced Emergency Braking (AEB) and Emergency Lane Keeping Systems (ELKS), both reliant on precise LiDAR object detection.
Restraint: Emergence of alternative technologies
The growth of LiDAR in automotive ADAS is restrained by the rising adoption of camera and radar fusion systems, which offer substantial cost advantages, with radars typically costing under USD 150 and cameras between USD 200–350, while LiDAR units cost USD 600–800 each. Radar and camera combinations provide essential safety functions like adaptive cruise control and emergency braking at a fraction of LiDAR’s cost. Advances in 4D imaging radar and AI-enhanced camera platforms have narrowed the technology gap by improving object detection and classification, enabling OEMs to deploy these cheaper, widely trusted systems faster with lower testing and certification costs.
Opportunity: Cost reduction and scalability of testing infrastructure
The growing demand for cost-effective, high-fidelity LiDAR testing and simulation solutions presents a major opportunity for the LiDAR testing market, as OEMs seek to expand LiDAR adoption in mid-priced vehicles. Advanced platforms like LeddarTech’s AI-powered LeddarSim enable versatile, accurate, and scalable virtual testing of multiple LiDAR types across millions of realistic scenarios, accelerating validation while cutting costs and bridging the simulation-to-reality gap. The ability to simulate multi-sensor setups, integrating cameras, radar, and LiDAR, supports safer autonomous system development aligned with stringent regulations. Cloud-based modular simulation platforms from leaders like dSPACE, AVL, and Applied Intuition further reduce infrastructure expenses, enabling rapid validation of thousands of safety scenarios.
Challenge: Upfront cost of LiDAR
The high upfront cost of LiDAR testing remains a market challenge due to expensive high-performance sensors priced between USD 1,500 and 5,000 each, often requiring multiple units per vehicle for adequate coverage and redundancy. Beyond sensor costs, extensive investments in large, specialized calibration facilities with precise environmental controls and hardware-in-the-loop (HIL) setups, which can add hundreds of thousands per test system, are necessary to ensure sensor accuracy and alignment. Despite falling sensor prices, this significant capital barrier impacts new entrants and smaller OEMs. To mitigate these challenges, the industry increasingly adopts cloud-based simulation platforms that replicate complex real-world scenarios, reducing reliance on costly physical testing infrastructure, lowering validation expenses, and accelerating time to market.
LiDAR Simulation Market: COMMERCIAL USE CASES ACROSS INDUSTRIES
| COMPANY | USE CASE DESCRIPTION | BENEFITS |
|---|---|---|
 |
Uses LiDAR simulation and validation services for ADAS and autonomous vehicle testing, including safety certification and compliance checks under real-world and virtual scenarios | Ensures vehicles meet regulatory standards, reduces physical testing costs, and accelerates homologation for global markets |
 |
Supplies high-performance long-range LiDAR (Iris, Hydra) and perception software for OEM integration, supported by virtual validation and OTA simulation for safety-critical applications | Delivers industry-leading range and resolution for highway autonomy, enables scalable deployment in production vehicles, and strengthens OEM trust in advanced autonomy programs |
 |
Provides LiDAR-in-the-loop (LiL) and LiDAR OTA simulation platforms for OEMs to validate perception algorithms, sensor fusion, and system safety in virtual environments | Cuts down development time, improves accuracy of ADAS features, and enables cost-efficient testing of edge cases not possible on-road |
 |
Develops automotive-grade solid-state LiDAR sensors (Valeo SCALA) and integrates them with simulation environments for ADAS and autonomous driving applications | Enables mass production of reliable LiDAR, enhances detection for safety systems, and strengthens Valeo’s role as a Tier-1 supplier for OEMs |
 |
Offers LiDAR sensors and perception software, integrated with digital twin and simulation platforms to validate autonomous driving under diverse traffic and weather conditions. Provides high-resolution, cost-effective LiDAR, accelerates adoption in EVs and robotaxis, and supports continuous OTA updates for perception improvement | Provides high-resolution, cost-effective LiDAR, accelerates adoption in EVs and robotaxis, and supports continuous OTA updates for perception improvement |
Logos and trademarks shown above are the property of their respective owners. Their use here is for informational and illustrative purposes only.
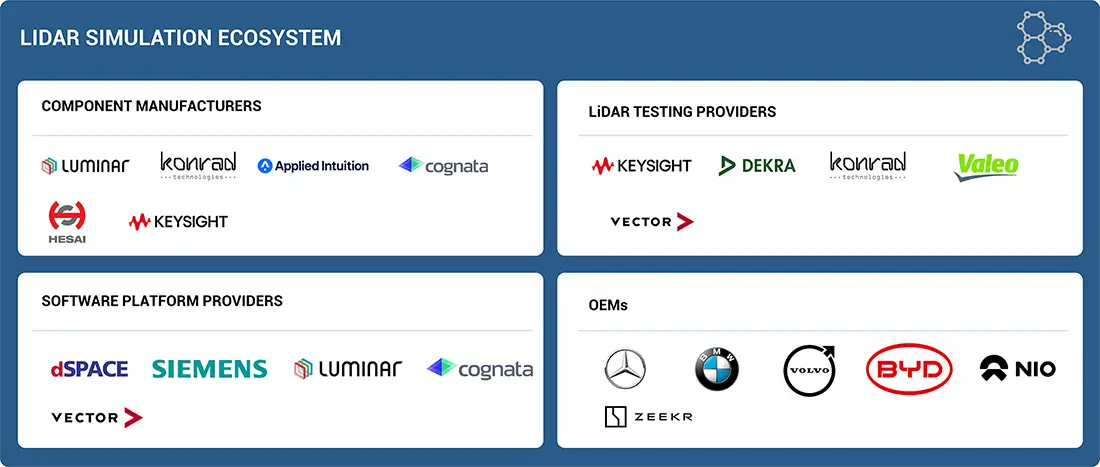
MARKET ECOSYSTEM
The ecosystem analysis highlights various LiDAR simulation market players, primarily represented by component manufacturers, LiDAR testing providers, software platform providers, and OEMs.
Logos and trademarks shown above are the property of their respective owners. Their use here is for informational and illustrative purposes only.
MARKET SEGMENTS
Source: Secondary Research, Interviews with Experts, MarketsandMarkets Analysis
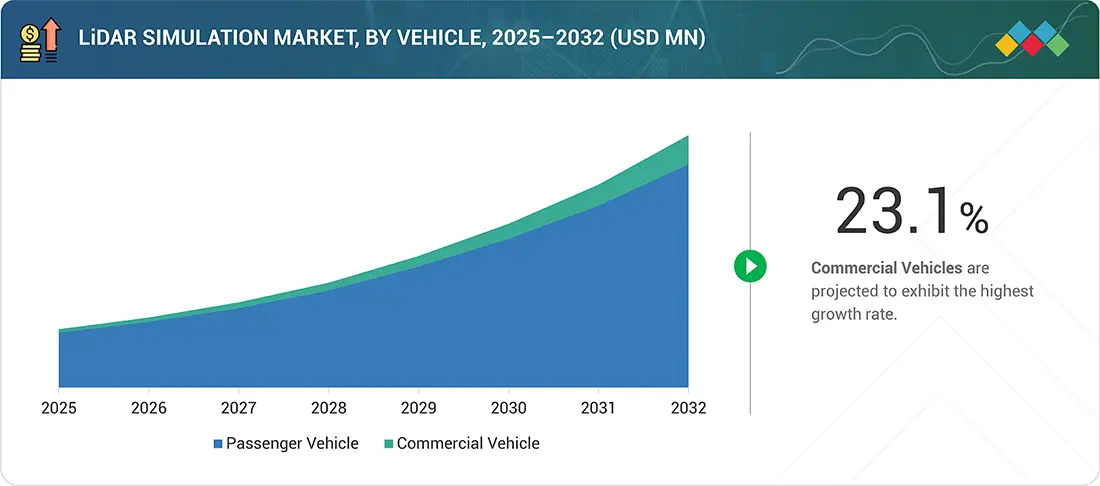
LiDAR Simulation Market, By Vehicle Type
The passenger car segment dominates the global LiDAR simulation market with over 90% share, driven by rising demand for premium and luxury vehicles equipped with advanced ADAS features. Production of premium passenger cars grew 12.9% between 2022 and 2024, while the rapid growth of the robotaxi sector, led by Waymo and Cruise, further accelerates LiDAR adoption for precise mapping and autonomous driving. With modular E/E architectures, EVs make LiDAR integration with radar and cameras easier, enabling real-time obstacle detection, 3D mapping, collision avoidance, and adaptive cruise control, critical for meeting strict regulations like Europe’s GSR2. As a result, the LiDAR simulation market is projected to grow from USD 0.93 billion in 2025 to USD 4.01 billion by 2032, at a CAGR of 23.1%, with Europe leading due to strong regulations and advanced automakers.
LiDAR Simulation Market, By Method
The LiDAR simulation market is growing rapidly as virtual validation provides a cost-effective, safe, and scalable alternative to physical prototyping and real-world testing. Advanced tools like Keysight’s LiDAR Target Simulator and CarMaker enable early algorithm development and sensor integration, while cloud-based platforms allow engineers to run thousands of complex scenarios, including adverse weather, to meet ISO standards. Automakers are actively partnering with simulation providers—such as Audi’s USD 4 billion collaboration with Innoviz—to improve LiDAR accuracy and speed up validation. This shift to virtual testing cuts costs, reduces development cycles, and drives global market growth.
LiDAR Simulation, By Type
Solid-state LiDAR leads the market as it is smaller, more energy-efficient, and easier to integrate than mechanical LiDAR, making it ideal for EVs where space and power matter. Offering high-resolution 3D mapping and fast scanning for real-time autonomous driving, it is priced competitively at around USD 600–750 for mid-range applications. Its durability, reliability, and improved performance drive adoption in ADAS and autonomous vehicles while creating growth opportunities in global testing and simulation markets.
REGION
Europe to be largest region in global LiDAR simaultion market during forecast period
Europe holds the largest share of the LiDAR simulation market due to its advanced automotive sector, rigorous safety and comfort regulations, and strong commitment to green mobility and autonomous vehicles. Leading countries like Germany, the UK, and France drive robust R&D investments and technological innovations, supported by major OEMs such as BMW, Mercedes-Benz, and Volkswagen, alongside tech companies like Valeo and Bosch, facilitating rapid integration and validation of LiDAR sensors. Europe's leadership in deploying LiDAR-equipped vehicles with advanced autonomous features and strong public-private partnerships further fuels market growth, making it the hub for cutting-edge LiDAR simulation and testing during the forecast period.
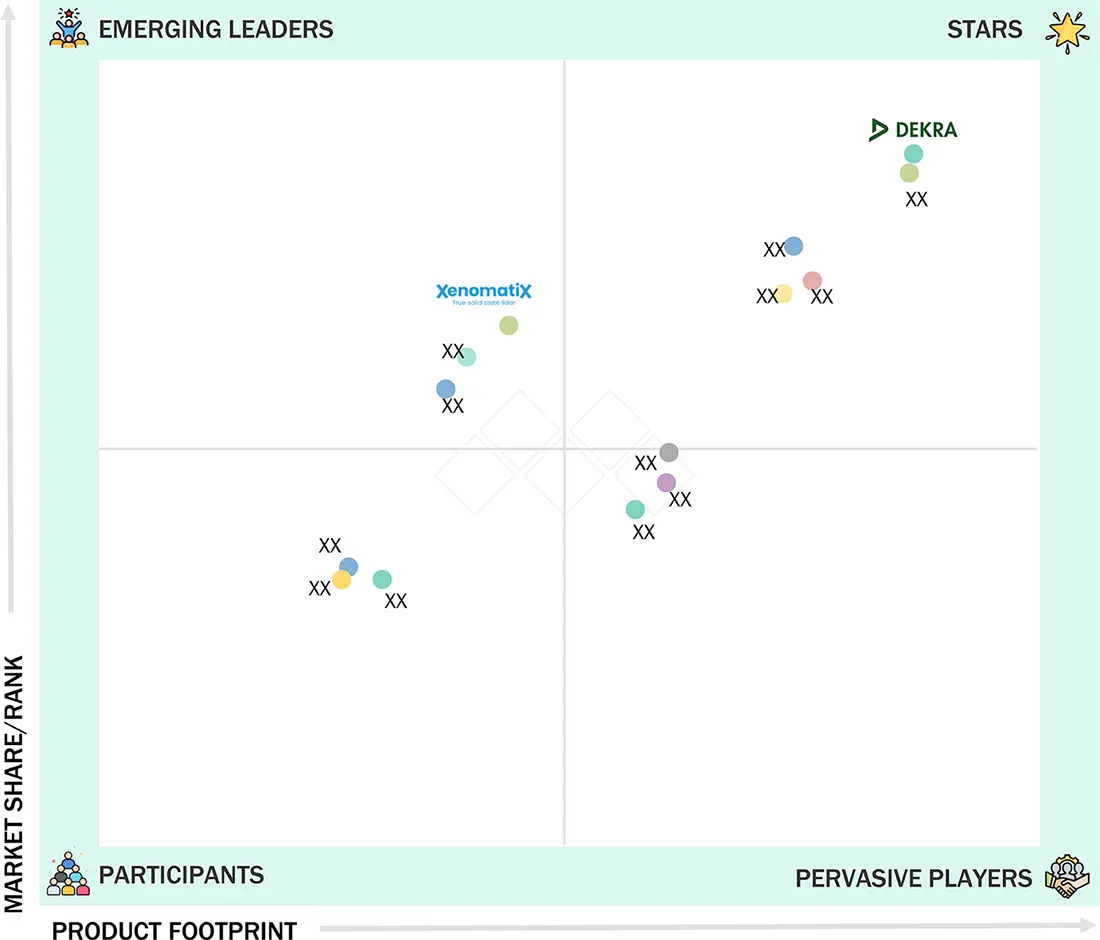
LiDAR Simulation Market: COMPANY EVALUATION MATRIX
The microquadrant analysis provides information on major players that offer LiDAR simulation and outlines the findings and analysis of how well each vendor performs within the predefined criteria. The company evaluation matrix for the LiDAR simulation market positions players based on market share/rank and product footprint. DEKRA leads the LiDAR Simulation market with a strong market presence and a wide product portfolio.
Source: Secondary Research, Interviews with Experts, MarketsandMarkets Analysis
KEY MARKET PLAYERS
MARKET SCOPE
| REPORT METRIC | DETAILS |
|---|---|
| Market Size in 2025 (Value) | USD 0.93 BILLION |
| Market Forecast in 2032 (Value) | USD 4.01 BILLION |
| Growth Rate | CAGR of 23.1% from 2025–2032 |
| Years Considered | 2021–2032 |
| Base Year | 2024 |
| Forecast Period | 2025–2032 |
| Units Considered | Value (USD MN) |
| Report Coverage | Revenue forecast, Regional Market Shares, Competitive Landscape, Driving factors, Trends & Disruption, OEM Analysis, Impact of LiDAR testing SDVs, Case Studies, Ecosystem, Supply Chain, LiDAR Testing Centers, and others |
| Segments Covered |
|
| Regions Covered | North America, Asia Pacific, and Europe |
WHAT IS IN IT FOR YOU: LiDAR Simulation Market REPORT CONTENT GUIDE
DELIVERED CUSTOMIZATIONS
We have successfully delivered the following deep-dive customizations:
| CLIENT REQUEST | CUSTOMIZATION DELIVERED | VALUE ADDS |
|---|---|---|
| Competitive Landscape Deep Dive | • Profiling of top LiDAR simulation software vendors, including product roadmap, strengths, and weaknesses | Helped client identify high-growth geographies and align market entry strategies |
| Technology Segmentation | • Breakdown of Solid-State, MEMS, Flash LiDAR, and Mechanical LiDAR simulation scenarios | • Provided clarity on which simulation technology aligns with industry adoption |
| End-user Demand Analysis | • OEM vs. Tier-1 vs. Tier-2 vs. simulation software startups demand insights | • Helped client understand where to focus B2B partnerships and sales strategies |
RECENT DEVELOPMENTS
- May 2025 : DEKRA expanded its global testing infrastructure by opening a state-of-the-art Automotive Testing Center in Michigan, US. This facility provides advanced capabilities for testing, validating, and certifying automotive technologies, including LiDAR and other sensor systems critical to future mobility solutions.
- March 2025 : AVL upgraded its new simulation software, AVL SiL Suite. This simulation software has new features and improvements based on customer feedback and challenges. It supports Software-in-the-Loop (SiL), Hardware-in-the-Loop (HiL), and virtual testing environments for sensor and system validation
- July 2024 : AVL acquired a majority stake (70%) in FIFTY2 Technology, developer of PreonLab, a leading particle-based flow simulation tool. This strengthened AVL’s simulation capabilities, enabling more advanced and efficient virtual testing, including for sensor and environmental modeling relevant to LiDAR system validation.
- May 2024 : Valeo and Applied Intuition partnered to co-develop a digital twin simulation platform focused on Valeo’s SCALA 3 LiDAR and other Valeo sensors. This platform enables highly accurate, AI-powered sensor and environment simulation for ADAS and autonomous driving systems. It supports software-in-the-loop (SIL) and hardware-in-the-loop (HIL) testing, allowing OEMs to validate perception algorithms in diverse real-world and virtual scenarios.
- April 2024 : Applied Intuition and Luminar Technologies made a strategic partnership to increase the development and validation of advanced driver-assistance systems (ADASs) and automated driving (AD) technologies for automakers. This collaboration introduced the first validated sensor models of Luminar’s Iris and Iris+ LiDARs into Applied Intuition’s Sensor Sim, a physics-based sensor simulator, enabling automakers to precisely test and validate LiDAR-based perception systems in virtual environments that closely mimic real-world conditions.
Table of Contents
 Exclusive indicates content/data unique to MarketsandMarkets and not available with any competitors.
Methodology
The research study uses extensive secondary sources, such as company annual reports/presentations, industry association publications, magazine articles, directories, technical handbooks, World Economic Outlook, trade websites, technical articles, and databases, to identify and collect information on the LiDAR simulation market. Primary sources, such as experts from related industries, OEMs, and suppliers, were interviewed to obtain and verify critical information and assess the growth prospects and market estimations.
Secondary Research
Secondary sources for this research study included corporate filings, such as annual reports, investor presentations, and financial statements; trade, business, and professional associations; whitepapers and autonomous vehicles and ADAS-related journals; certified publications; articles by recognized authors; directories; and databases. Secondary data has been collected and analyzed to determine the overall market size, further validated by primary research.
Primary Research
After understanding the LiDAR simulation market scenario through secondary research, extensive primary research was conducted. Primary interviews were conducted with market experts from both the demand and supply sides across North America, Europe, and Asia Pacific. Approximately 20% of interviews were conducted from the demand side, while 80% of primary interviews were conducted from the supply side. The primary data was collected through questionnaires, emails, and telephone interviews.
In the canvassing of primaries, various departments within organizations, such as sales and operations, were covered to provide a holistic viewpoint in this report. Primary sources from the supply side included various industry experts, such as CXOs, vice presidents, directors from business development, marketing, product development/innovation teams, and related key executives from various key companies. Various system integrators, industry associations, independent consultants/industry veterans, and key opinion leaders were also interviewed.

Note: Others include sales, managers, and product managers.
To know about the assumptions considered for the study, download the pdf brochure
Market Size Estimation
The top-down approach has been used to estimate and validate the LiDAR simulation market size. The LiDAR simulation market size, by region, was derived by mapping the key players from each region with their business segment’s revenue. The revenue of each key player from each region was mapped considering their test and simulation segment from their annual report and product portfolio (mechanical LiDAR and solid-state LiDAR) in terms of value (USD million). After this, all revenue from each region was summed to obtain the global market for LiDAR simulation. The industry experts then validated the revenue generated from each region. Additionally, the revenue forecast for testing and simulation was made considering different LiDAR types (mechanical and solid-state LiDAR), based on factors such as country-wise macroeconomic indicators, automotive industry growth, GDP growth, safety regulation, price of LiDAR components, future LiDAR adoption, and offerings in ADAS systems by the automakers, considering the regional mandates for safety.
The market size for LiDAR offered in each vehicle type was derived by mapping the LiDAR type offered in each vehicle type (passenger cars and commercial vehicles). To forecast the market’s revenue for the LiDAR type, the demand for LiDAR (mechanical and solid-state LiDAR) was derived considering the demand in vehicles, cost, maintenance, and technological advancements. Then, the market revenue split for different LiDAR types was derived and forecasted, which was then validated from the primaries. The segmental revenue for each LiDAR type was then derived by the summation of revenue from each LiDAR type. A similar approach was used for other segments, such as level of autonomy, method, and by vehicle type.
LiDAR Simulation Market : Top-Down and Bottom-Up Approach

Data Triangulation
After arriving at the overall market size of the global market through the methodology mentioned above, this market was split into several segments and subsegments. The data triangulation and market breakdown procedures were employed to complete the overall market engineering process and arrive at the exact market value data for key segments and sub-segments, wherever applicable. The extrapolated market data was triangulated by studying various macro indicators and regional trends from both the demand and supply-side participants.
Market Definition
According to Texas Instruments, LiDAR is a sensing technology that detects objects and maps their distances. The technology works by illuminating a target with an optical pulse and measuring the characteristics of the reflected return signal.
Stakeholders
- ADAS System Manufacturers
- Automobile Original Equipment Manufacturers (OEMs)
- Automotive Part Manufacturers’ Association (APMA)
- Automotive Component Manufacturers
- Governments, Financial Institutions, and Investment Communities
- European Automobile Manufacturers Association (ACEA)
- LiDAR Hardware Suppliers
- LiDAR Software Suppliers
- LiDAR System Integrators
- Manufacturers of Automotive LiDAR Microprocessors
- Original Device Manufacturer (ODM) and OEM Technology Solution Providers
- National Highway Traffic Safety Administration (NHTSA)
- Raw Material and Manufacturing Equipment Suppliers
- Research Institutes and Organizations
- Semiconductor Foundries
- Technology Investors
- Technology Standards Organizations, Forums, Alliances, and Associations
- Vehicle Safety Regulatory Bodies
Report Objectives
- To analyze and forecast the LiDAR simulation market in terms of value (USD Million) from 2025 to 2032
-
To analyze the LiDAR simulation market based on the following:
- By LiDAR Type (Mechanical LiDAR and Solid-state LiDAR)
- By Vehicle Type (Passenger Cars and Commercial Vehicles)
- By Level of Autonomy (Level 2/2.5, Level 3, and Level 4/5)
- By Method (Testing Method and Simulation Method)
- By Laser Wavelength (Short Wave Infrared Spectrum and Long Wave Infrared Spectrum)
- By Application (Intelligent Park Assist, Night Vision, Traffic Jam, Road Mapping & Localization, and Others)
- By Region (North America, Europe, and Asia Pacific)
- To identify and analyze key drivers, challenges, restraints, and opportunities influencing the market growth
- To strategically analyze the market for individual growth trends, prospects, and contributions to the total market
-
To study the following with respect to the market:
- Investment and Funding Scenario
- Supply Chain Analysis
- Ecosystem Analysis
- Technology Analysis
- Case Study Analysis
- Patent Analysis
- Regulatory Landscape
- Key Stakeholders and Buying Criteria
- Key Conferences and Events
- To strategically profile the key players and comprehensively analyze their market share and core competencies
- To analyze the impact of AI on the market
- To track and analyze competitive developments, such as deals, product launches/developments, expansions, and other activities undertaken by the key industry participants
Available Customizations
With the given market data, MarketsandMarkets offers customizations in accordance with the company’s specific needs. The following customization options are available:
- Additional Company Profiles (Up to 5)
- Global LiDAR Simulation Market, By Level of Autonomy, at the Country Level
- Global LiDAR Simulation Market, By Vehicle Type, ICE and Electric
- Global LiDAR Simulation Market, By Testing Method, By Country
Key Questions Addressed by the Report
What is the current market size of the LiDAR Simulation Market, and how is it expected to grow?
The LiDAR Simulation Market is projected to grow from USD 0.93 billion in 2025 to USD 4.01 billion by 2032, at a CAGR of 23.1% during the forecast period.
What are the key factors driving the growth of the LiDAR Simulation Market?
The market is driven by the growing adoption of ADAS and autonomous vehicles, increasing demand for virtual validation, software-defined vehicles, and the need to reduce physical testing costs while improving safety.
Which region is expected to dominate the LiDAR Simulation Market during the forecast period?
Europe is expected to dominate the LiDAR Simulation Market due to stringent vehicle safety regulations, strong automotive R&D, and widespread adoption of advanced ADAS and autonomous driving technologies.
What are the latest trends shaping the LiDAR Simulation Market?
Key trends include AI-powered digital twin platforms, solid-state LiDAR simulation, cloud-based validation environments, over-the-air (OTA) testing, and sensor fusion simulation for autonomous vehicles.
Who are the leading companies in the LiDAR Simulation Market, and what strategies are they adopting?
Leading companies are focusing on AI-driven simulation platforms, strategic partnerships, digital twin technologies, and advanced LiDAR validation solutions to accelerate autonomous vehicle development.
Need a Tailored Report?
Customize this report to your needs
Get 10% FREE Customization
Customize This ReportPersonalize This Research
- Triangulate with your Own Data
- Get Data as per your Format and Definition
- Gain a Deeper Dive on a Specific Application, Geography, Customer or Competitor
- Any level of Personalization
Let Us Help You
- What are the Known and Unknown Adjacencies Impacting the LiDAR Simulation Market
- What will your New Revenue Sources be?
- Who will be your Top Customer; what will make them switch?
- Defend your Market Share or Win Competitors
- Get a Scorecard for Target Partners

Custom Market Research Services
We Will Customise The Research For You, In Case The Report Listed Above Does Not Meet With Your Requirements
Get 10% Free CustomisationTESTIMONIALS

JIM NAAS
PRODUCT DIRECTOR, WEASLER
Weasler Engineering, a CentroMotion organization
Global Provider of Industrial Actuation & Control Solutionswww.weasler.com
Our organization was interested in learning more about the attractiveness of a particular market space. We contacted MarketsandMarkets to help us based on previous positive experiences we had with them. The results did not disappoint! We discussed our objectives with them, and the team at MarketsandMarkets developed and executed a proposal that met our needs precisely. We were very impressed by their level of expertise, the quality of the analysis and their insightful recommendations. We would not hesitate in working with them again in the future.

Matt Kardel,
Vice President
Aptiv,
A global technology company that develops safer, greener and more connected solutions.www.aptiv.com
We contracted with
MarketsandMarkets to evaluate the value chain and potential go-to-market partners related to our
interest in the Fleet Management space. The team successfully completed the work on time and at the
pricing agreed. MarketsandMarkets listened and understood our objectives and collaborated well with
us to help us get the visibility we needed to make an investment.
We have subsequently used
MarketsandMarkets again related to Smart Cities to good results.


Growth opportunities and latent adjacency in LiDAR Simulation Market