
MEA Variable Frequency Drive Market

MEA Variable Frequency Drive Market by Type (AC Drive, DC Drive, Servo Drive), Application (Pumps, Fans & Blowers, Compressors, Conveyors, Others), Power Rating (Micro, Low, Medium, High), Voltage, End User, and Region - Global Trends & Forecast to 2030


OVERVIEW
Source: Secondary Research, Interviews with Experts, MarketsandMarkets Analysis
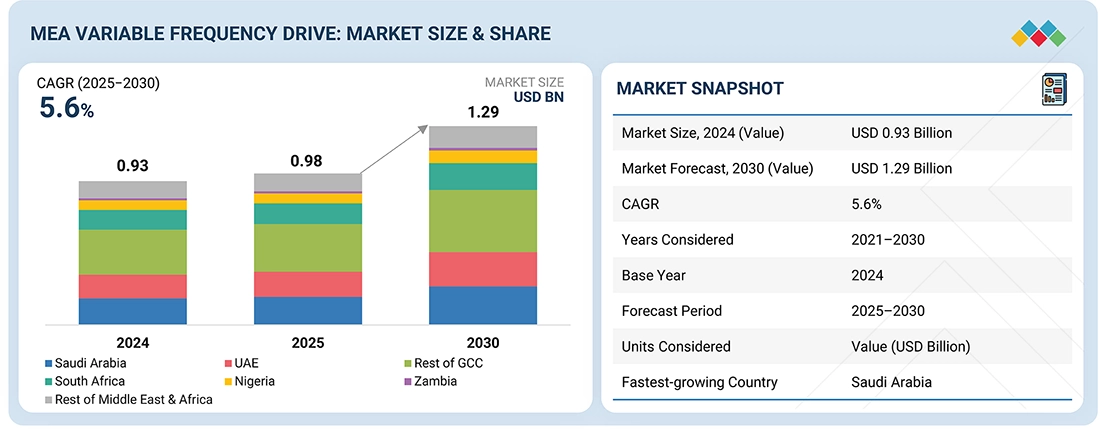
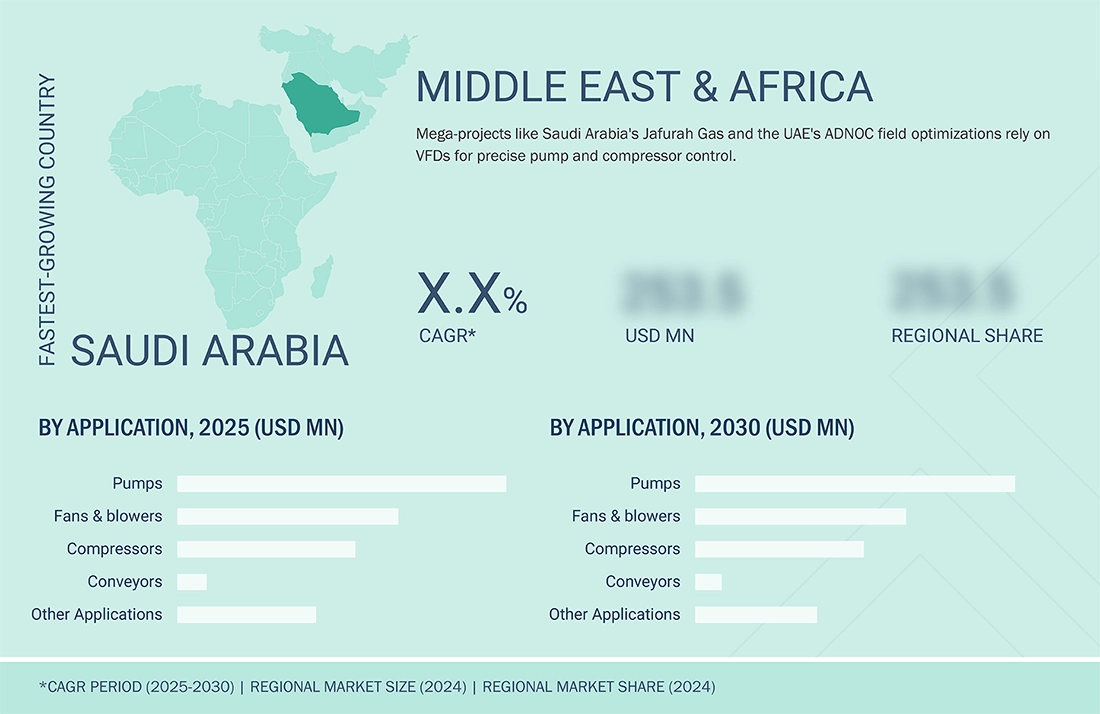
The Middle East & Africa (MEA) variable frequency drive market is projected to reach USD 1.29 billion by 2030 from USD 0.98 billion in 2025, at a CAGR of 5.6%. There is an increasing need for variable frequency drives (VFDs) in the MEA region due to rapid industrialization, stringent government policies on energy conservation, and escalating electricity costs. These factors compel industrialists to adopt efficient motor control technologies to reduce operational expenses and mitigate the adverse effects of power inefficiencies. VFDs contribute to minimizing energy losses, optimizing power distribution, and achieving long-term cost savings, which has led to their growing popularity in sectors such as oil & gas, manufacturing, and infrastructure projects.
Market Size and Forecast:
- 2025 Market Size: USD 0.98 Billion
- 2030 Projected Market Size: USD 1.29 Billion
- Growth Rate (2025-2030): CAGR of 5.6%
- AC drive segment is expected to account for the largest market share during the forecast period
- Power segment is projected to dominate the market by end user from 2025 to 2030
- Forecast period: 2025–2030
- Saudi Arabia is anticipated to be the fastest-growing country in the MEA market
- Low-power drives are expected to witness significant growth owing to their increasing adoption in HVAC systems, pumps, and conveyor applications
- Pumps segment is projected to register strong demand due to rising investments in water management and industrial infrastructure
Key Market Trends and Insights:
- Growing emphasis on energy efficiency and carbon reduction is accelerating VFD adoption across industrial and utility applications
- Expansion of oil & gas projects in the Middle East is driving demand for advanced motor control solutions in pumps, compressors, and processing equipment
- Increasing investments in water desalination and wastewater treatment facilities are creating new opportunities for VFD deployment
- AC drives continue to dominate the market due to their reliability, precise speed control, and widespread use across industries
- Low-power drives are gaining traction as commercial buildings and industrial facilities seek cost-effective energy-saving technologies
- Integration of IoT, remote diagnostics, and predictive maintenance capabilities is transforming VFDs into intelligent asset management solutions
- Saudi Arabia is emerging as the fastest-growing market, supported by Vision 2030 initiatives, industrial diversification, and major infrastructure investments
KEY TAKEAWAYS
-
BY END USERThe end user segment includes power, oil & gas, chemicals & petrochemicals, mining & metal, construction/infrastructure, food & beverage, automotive, and water & wastewater treatment. The power segment is estimated to be the largest end user in the MEA variable frequency drive (VFD) market, with its growth driven by the surging demand for reliable electricity amid rapid urbanization and industrialization, escalating energy needs, and stringent government regulations aimed at curbing carbon emissions.
-
BY POWER RATINGThe power rating segment includes micro power drive, low power drive, medium power drive and high power drive. Low power drives are experiencing significant growth in the MEA VFD market due to their widespread use in small-scale industrial and commercial settings such as HVAC systems, small pumps, and conveyor belts, where they provide a balance between efficiency and affordability.
-
BY VOLTAGEThe voltage segment includes low voltage and medium voltage. Low voltage segment growth is fueled by rising electricity costs, stringent government regulations promoting energy efficiency, and the expansion of infrastructure projects in countries like the UAE and Saudi Arabia. Additionally, the segment's compatibility with renewable energy integrations, such as solar-powered systems.
-
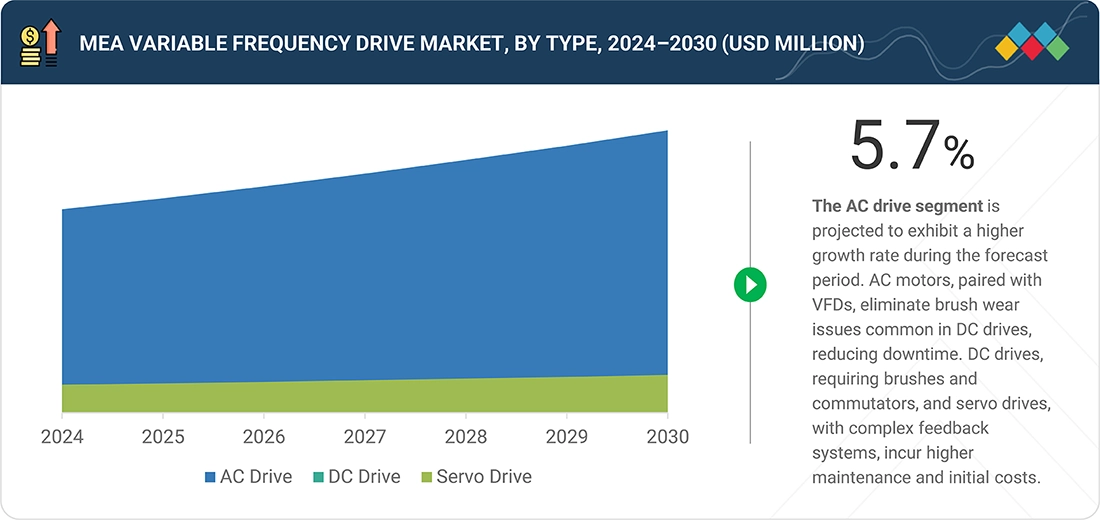
BY TYPEThe type segment includes AC drive, DC drive, and Servo drive. The AC drive segment is growing in the MEA VFD market due to its widespread use in controlling AC motors across industries like oil & gas, manufacturing, and water treatment, offering superior energy efficiency and precise speed regulation.
-
BY APPLICATIONThe application segment includes pumps, fans & blowers, compressors, and conveyors. The pump application segment is estimated to grow with the rise in demand for water management solutions amid rapid urbanization and industrial expansion, particularly in agriculture, oil & gas, and municipal sectors across countries like Saudi Arabia and South Africa.
-
BY COUNTRYThe key countries include Saudi Arabia, the UAE, South Africa, Nigeria, and Zambia. Each country experiences growth driven by Vision 2030 initiatives, oil & gas upgrades, and water desalination in Saudi Arabia and the UAE, industrial diversification in the Rest of the GCC, mining in South Africa and Zambia, oil sector expansion in Nigeria, and utilities/agriculture in the Rest of the Middle East & Africa, all boosted by rising electricity costs and renewable energy integration.
-
COMPETITIVE LANDSCAPEMajor market players use organic and inorganic strategies such as product launches, acquisitions, collaborations, partnerships, agreements, expansions, and investments to drive growth in variable frequency drives. Companies such as ABB, Danfoss, Rockwell Automation, Siemens, and Schneider Electric have entered various partnerships, agreements and product launches to meet the increasing demand for variable frequency drives in innovative uses.
The projected rising demand for variable frequency drives (VFDs) in the MEA region is a direct result of industrial stakeholders and government agencies seeking to achieve considerable energy consumption savings, reduce carbon emissions, and meet increasingly demanding efficiency standards. The increased pace of industrialization, urbanization, and the growth of applications in the oil & gas, manufacturing, and infrastructure industries is further catalyzing adoption, based on sustainability policies, decarbonization measures, and rapid technological change.
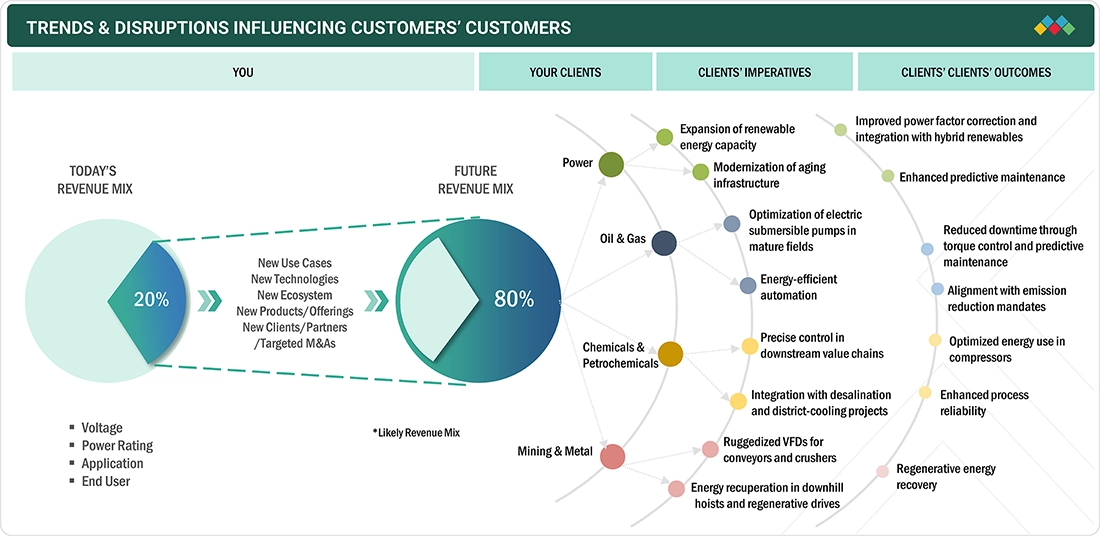
TRENDS & DISRUPTIONS IMPACTING CUSTOMERS' CUSTOMERS
The increase in demand for energy efficiency incentivizes players across the power, oil & gas, chemicals & petrochemicals, and mining & metal industries. This shift is driven by increased demand for advanced motor control systems, supported by global government initiatives promoting sustainable technologies and modernizing outdated infrastructure. Key growth opportunities lie in energy recovery and improved process maintenance, which enhance operational efficiency and reliability. As businesses adapt to these changes, those that successfully embrace energy-efficient solutions will not only improve their performance metrics but also strengthen their reputations as leaders in sustainability.
Source: Secondary Research, Interviews with Experts, MarketsandMarkets Analysis
MARKET DYNAMICS
Level
-
Expansion of oil & gas projects in Saudi Arabia

-
Increasing investments in clean energy in Middle East & Africa

Level
-
Unstable power supply in Africa

-
High installation and maintenance costs

Level
-
Implementation of wastewater treatment programs in Middle Eastern countries

-
Surge in infrastructure and energy projects

Level
-
Lack of skilled workforce

Source: Secondary Research, Interviews with Experts, MarketsandMarkets Analysis
Driver: Increasing investments in clean energy in Middle East & Africa
The Middle East & Africa (MEA) region is witnessing a significant shift toward renewable energy, with countries like the UAE, Saudi Arabia, Egypt, Morocco, and Jordan leading the way. This transition presents numerous opportunities for the adoption of variable frequency drives (VFDs), which are essential for optimizing energy efficiency and operational control in various applications.? The UAE has positioned itself as a leader in renewable energy within the Middle East, primarily through initiatives led by Masdar. Notably, Masdar has launched a USD 6 billion project to produce 1 GW of uninterrupted clean power, aiming to make renewable energy a reliable baseload source. In such large-scale solar projects, VFDs play a crucial role in managing the speed and torque of motors used in tracking systems, cooling pumps, and other auxiliary equipment. By adjusting motor speeds to match load requirements, VFDs enhance energy efficiency and system reliability. The integration of VFDs in these applications is likely to drive their market growth in the UAE, aligning with the country's commitment to sustainable energy solutions.
Restraint: Unstable power supply in Africa
Africa’s power supply instability is rooted in systemic issues such as aging infrastructure, underinvestment, and governance failures. Countries like South Africa face frequent load-shedding (planned blackouts to prevent grid collapse) with over 3,212 hours of outages in 2022 alone. State-owned utility Eskom, plagued by corruption and mismanagement, struggles with coal theft, vandalism, and outdated plants, leading to chronic energy shortages. Diesel generators have become a costly stopgap, with businesses spending 7–8 times more than grid power, while rural areas lack access entirely. As per the article by The Exchange in 2024, Africa remains the most energy-deficient continent, with approximately 75% of its population lacking access to electricity. As of 2021, 43% of Africans, roughly 600 million people, were without electricity access, with 590 million in sub-Saharan Africa. Consequently, nearly half of the continent’s population is unable to use basic electrical appliances.
Opportunity: Surge in infrastructure and energy projects
The Middle East & Africa (MEA) region is witnessing a surge in large-scale infrastructure and energy projects that are poised to accelerate the demand for variable frequency drives (VFDs). These megaprojects, spanning renewable energy, oil and gas, and urban transportation, require advanced motor control solutions to optimize energy consumption, improve operational efficiency, and reduce costs. VFDs, which regulate the speed and torque of electric motors, are critical components in these projects, enabling precise control of pumps, compressors, fans, and other motor-driven equipment. One of the flagship projects driving VFD demand is the Al Dhafra Solar Project in the UAE, the world’s largest single-site solar power plant. This project relies heavily on VFDs to control cooling pumps and solar panel tracking systems, maximizing energy capture and ensuring grid stability. Similarly, the King Salman Energy Park (Spark) in Saudi Arabia, a major energy technology hub, will incorporate VFDs across manufacturing equipment, material handling systems, and HVAC units. The use of VFDs in these applications will significantly reduce energy consumption and enhance operational reliability, supporting Saudi Arabia’s Vision 2030 sustainability goals.
Challenge: Lack of skilled workforce
The installation, programming, and maintenance of Variable frequency drive require expertise. Variable frequency drive play a crucial role in optimizing motor control and improving energy efficiency in industries, but their complexity necessitates trained professionals who can configure drive parameters, troubleshoot faults, and integrate them with broader industrial automation systems. However, the growing demand for automation in manufacturing, HVAC, and other industries has outpaced the availability of skilled technicians and engineers proficient in VFD operation and diagnostics. This gap often leads to improper installation, inefficient system performance, and increased downtime, reducing the overall effectiveness of VFD adoption in industrial applications.
MEA Variable Frequency Drive Market: COMMERCIAL USE CASES ACROSS INDUSTRIES
| COMPANY | USE CASE DESCRIPTION | BENEFITS |
|---|---|---|
 |
Deploys VFDs in LPG plants and upstream facilities to optimize centrifugal pump speeds for fluid transfer and processing across Algerian refineries and gas fields | Enhanced process control and equipment reliability |
 |
Implements VFDs in power generation and downstream refineries for compressor and fan control in crude processing and desalination tie-ins, supporting high-demand operations under Vision 2030's Jafurah Gas expansions | Improved energy efficiency with precise torque/speed regulation |
 |
Integrates VFDs in onshore water injection and production wells for variable-speed pump control, optimizing flow rates in mature fields like Bu Hasa | Increased grid resilience and lower utility costs via renewable integration |
Logos and trademarks shown above are the property of their respective owners. Their use here is for informational and illustrative purposes only.
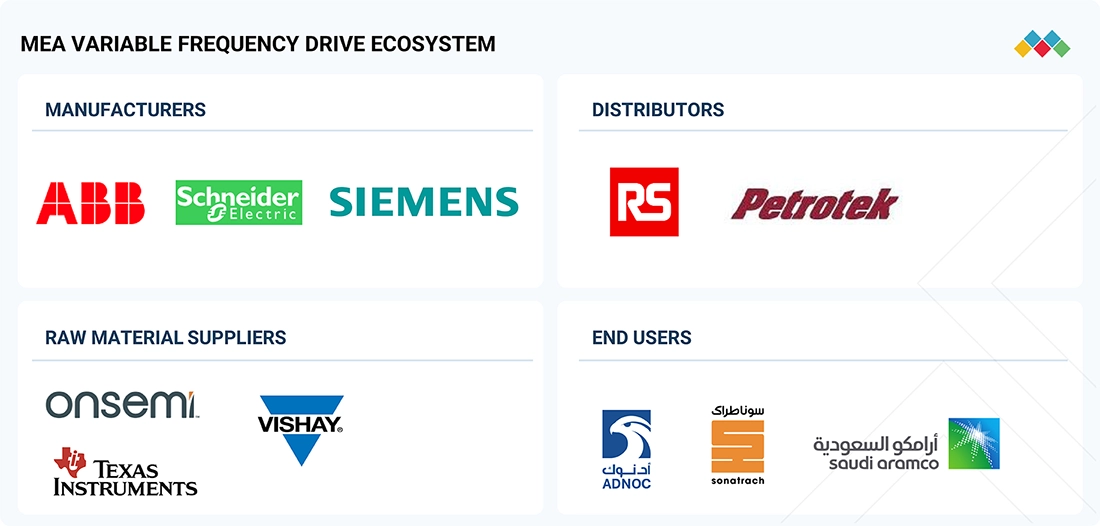
MARKET ECOSYSTEM
The MEA variable frequency drive market ecosystem consists of manufacturers (ABB, Siemens, Schneider Electric), distributors (RS Components, Petrotek), component providers (Semiconductor Components Industries, LLC, Texas Instruments Incorporated, Vishay Intertechnology, Inc.) and end users (Abu Dhabi National Oil Company, Sonatrach, Saudi Aramco). Raw material providers supply essential components for VSD production, including semiconductors, power electronics, printed circuit boards (PCBs), capacitors, inductors, and enclosures. End users purchase variable frequency drive systems from respective supply chain participants and utilize them to conduct the corresponding operations.
Logos and trademarks shown above are the property of their respective owners. Their use here is for informational and illustrative purposes only.
MARKET SEGMENTS
Source: Secondary Research, Interviews with Experts, MarketsandMarkets Analysis
MEA VFD Market, by End user
VFDs are designed for several end-use applications, including power, oil & gas, chemicals & petrochemicals, mining & metal, construction/infrastructure, food & beverage, automotive, water & wastewater treatment. The power segment is set to lead due to its extensive use in generation plants, substations, and renewable integrations, where VFDs provide efficient power distribution and support high-capacity machinery. The oil & gas sector utilizes VFDs for building management systems and drilling complexes, offering compact and cost-effective solutions for pumps and compressors. The chemicals & petrochemicals sector deploys VFDs in solar and wind farms to manage fluctuating energy inputs efficiently. In automotive, VFDs are critical for electric vehicles (EVs), ensuring robust power delivery in battery and charging infrastructures (EVs). The construction/infrastructure sector uses VFDs for charging rail structures, supporting high-power demands in transit networks.
MEA VFD Market, by Type
AC drives dominate due to their extensive use in controlling AC motors across industries like oil & gas, manufacturing, and water treatment, providing efficient power distribution and supporting high-capacity machinery with reliable and scalable performance. DC drives lead in specialized applications such as steel rolling mills and mining operations, where they offer precise speed control and robust power delivery for heavy-duty processes, ensuring energy efficiency in harsh environments like Saudi Arabia's industrial zones. Servo drives are essential for high-precision tasks in automation and robotics, particularly in automotive and aerospace manufacturing, supporting dynamic load handling with enhanced durability and responsiveness in facilities across the UAE and South Africa.
MEA VFD Market, by Power Rating
The VFD market in the MEA region is segmented by power rating into micro power drive, low power drive, medium power drive, and high power drive, each offering unique advantages for diverse applications. The micro power drive segment, is widely adopted in small-scale settings like HVAC units and small pumps due to its high efficiency, compact design, and ability to handle low voltage demands safely. The low power drive segment dominates in industrial and commercial establishments, providing cost-effective, lightweight solutions for power distribution in manufacturing plants and data centers, supporting reliable energy delivery. The medium power drive segment is essential for utilities, large manufacturing plants, and renewable energy installations, offering a balance of strength, flexibility, and thermal management for complex power needs in oil & gas and infrastructure projects. The high power drive segment is critical for heavy industrial applications like mining and large-scale water treatment, utilizing advanced insulation and conductor designs to ensure robust power transmission and handle significant load demands with enhanced durability and efficiency across the region.
MEA VFD Market, by Application
VFD pumps are set to dominate due to extensive use in water management and oil & gas, where VFDs provide precise flow control and energy efficiency in desalination plants and irrigation systems across Saudi Arabia and the UAE. Fans & blowers lead in HVAC and industrial ventilation, featuring enhanced thermal stability and current handling to optimize airflow in manufacturing facilities and data centers. Compressors utilize VFDs for pressure regulation in chemical plants and refineries, offering a protective coating for corrosion resistance and a cost-effective solution for moderate voltage environments in petrochemical hubs. Conveyors employ VFDs in mining and logistics, designed with adequate spacing and cooling to mitigate risks, making them suitable for high-power transmission in South Africa’s mineral processing plants. The others category, including extruders and mixers, benefits from VFDs’ ability to handle high current densities safely, supporting diverse applications in food processing and textile industries across the region.
MEA VFD Market, by Voltage
The VFD market in the MEA region is segmented by voltage into low voltage and medium voltage, each offering distinct advantages for various applications. Low voltage VFDs dominate due to their superior electrical conductivity, high corrosion resistance, and durability, making them ideal for high-performance settings such as industrial plants, data centers, and utilities in Saudi Arabia and the UAE, where reliability and efficiency are critical. Medium voltage VFDs are increasingly popular due to their lightweight nature, lower cost, and good conductivity-to-weight ratio, finding widespread use in commercial buildings, residential complexes, and automotive applications, particularly in electric vehicles (EVs) across South Africa and Egypt, where cost efficiency and ease of installation are key considerations.
REGION
Saudi Arabia to be the fastest-growing country in the MEA Variable frequency drive market during the forecast period
Saudi Arabia leads the MEA VFD market, with its dominance fueled by the country's status as the world's largest oil exporter and a high-growth energy consumer, driving demand through rapid industrialization and urbanization. VFD systems are increasingly integrated into oil & gas hubs, manufacturing complexes, and residential micro-grids, leveraging aluminum and copper for efficient, on-site power distribution. Key applications span industrial sectors (e.g., chemicals and metals in refineries), commercial buildings (e.g., hospitals and data centers in Riyadh), and utilities (e.g., district power networks in Jeddah), supported by technological advancements in modular and smart designs.
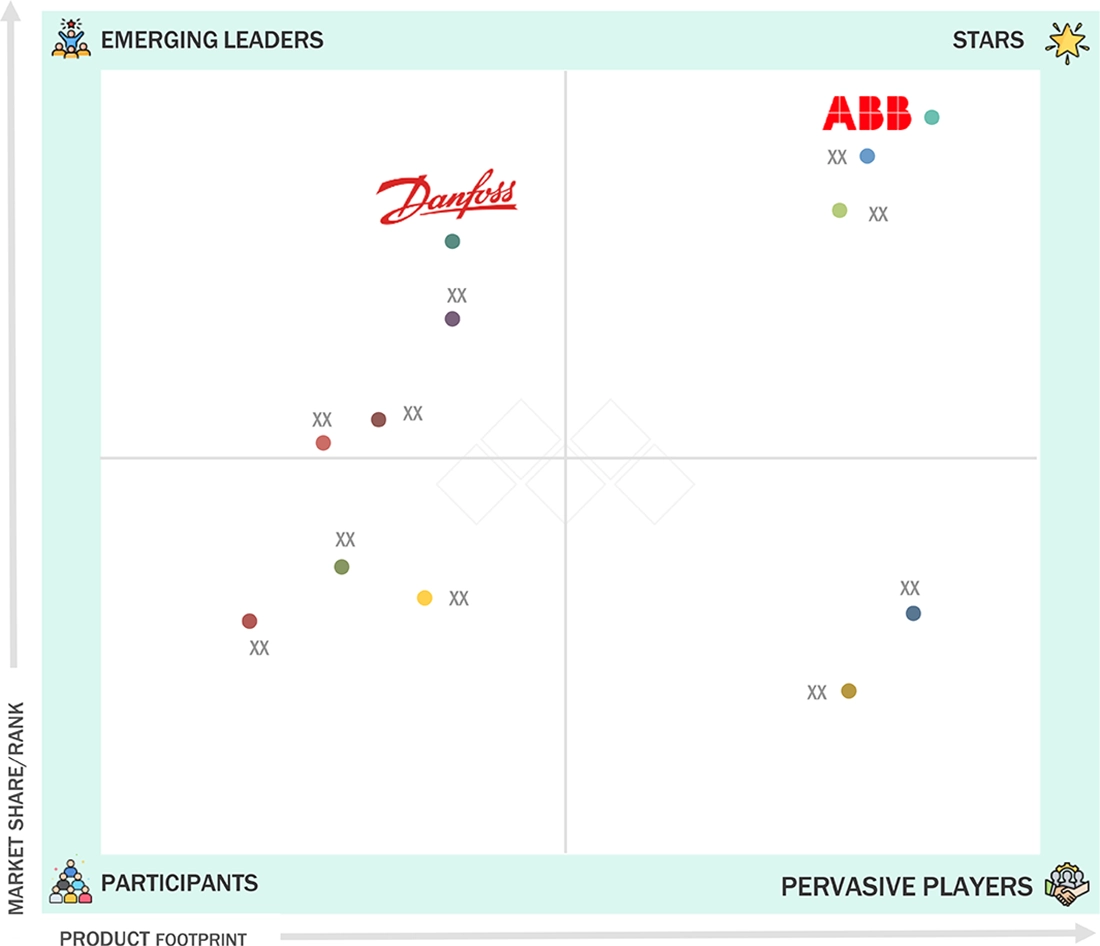
MEA Variable Frequency Drive Market: COMPANY EVALUATION MATRIX
In the MEA variable frequency drive market matrix, ABB (Star) leads with a strong market presence and a wide product portfolio, driving large-scale adoption across industrial and commercial sectors. Danfoss (Emerging Leader) is gaining traction with high-efficiency VFDs. While ABB dominates with scale, Danfoss shows strong growth potential to advance toward the leaders' quadrant.
Source: Secondary Research, Interviews with Experts, MarketsandMarkets Analysis
KEY MARKET PLAYERS
MARKET SCOPE
| REPORT METRIC | DETAILS |
|---|---|
| Market Size, 2024 (Value) | USD 0.93 Billion |
| Market Forecast, 2030 (Value) | USD 1.29 Billion |
| Growth Rate | CAGR 5.6% from 2025 to 2030 |
| Years Considered | 2021–2030 |
| Base Year | 2024 |
| Forecast Period | 2025–2030 |
| Units Considered | Value (USD Million/Billion) |
| Report Coverage | Revenue Forecast, Company Ranking, Competitive Landscape, Growth Factors, and Trends |
| Segments Covered |
|
| Countries Covered | Saudi Arabia, UAE, Rest of GCC, South Africa, Nigeria, Zambia, Rest of the Middle East & Africa |
WHAT IS IN IT FOR YOU: MEA Variable Frequency Drive Market REPORT CONTENT GUIDE
DELIVERED CUSTOMIZATIONS
We have successfully delivered the following deep-dive customizations:
| CLIENT REQUEST | CUSTOMIZATION DELIVERED | VALUE ADDS |
|---|---|---|
| MEA variable frequency drive Manufacturer |
|
|
| MEA variable frequency drive Customer |
|
|
RECENT DEVELOPMENTS
- January 2025 : Yaskawa Electric Corporation launched new Advanced Safety Modules (ASM-X) for its AC servo drive Σ-X series, along with servo motors featuring functional safety. The Σ-X series AC servo drives by Yaskawa are used in the Middle East and Africa industries, such as semiconductor and LCD manufacturing, electronics assembly, packaging, metal processing, machine tools, and industrial robotics. These drives enhance motion control, productivity, and equipment reliability, catering to high-precision applications in advanced manufacturing and industrial automation sectors.
- December 2024 : Schneider Electric partnered with ImeXolutions, a leading company in electrical and solar power implementation, to launch the Altivar Process Modular drives. These low-voltage process drives were designed for rapid cabinet integration into industrial settings from 110 kW to 2600 kW, emphasizing enhanced digitization and operational efficiency.
- November 2024 : Schneider Electric expanded its Altivar Medium Voltage Drives portfolio by launching the Altivar Process ATV6100, which featured a more compact design and versatile functionality aimed at improving energy efficiency, optimizing processes, and reducing the total cost of ownership.
- September 2024 : Rockwell Automation introduced PowerFlex 755TS frame 7A drives with TotalFORCE technology. This technology expanded the power range to 355 kW and provides a new panel-mount solution for high-horsepower applications. The PowerFlex 755TS Frame 7A drives with TotalFORCE technology by Rockwell Automation are utilized in the Middle East & Africa industries, such as oil & gas, food & beverage, and manufacturing. They supported demanding applications like pumps, fans, conveyors, and compressors, enhancing uptime, energy efficiency, and operational intelligence while reducing maintenance costs through predictive analytics and adaptive control features.
- June 2024 : Danfoss Drives and Honeywell International Inc. signed a non-binding MoU to explore collaboration on automation solutions with integrated architecture. Their goal was to reduce downtime and engineering costs while overcoming the limitations of traditional systems by balancing flexibility with seamless data integration and interoperability across various industries, enhancing efficiency and performance.
Table of Contents
 Exclusive indicates content/data unique to MarketsandMarkets and not available with any competitors.
Methodology
This research study involves the use of extensive secondary sources, directories, and databases, such as Hoovers, Bloomberg L.P., Factiva, and ICIS, to identify and collect information useful for this technical, market-oriented, and commercial study of the MEA variable frequency drive market. Primary sources are mainly industry experts from core and related industries, preferred suppliers, manufacturers, distributors, service providers, and organizations related to all segments of the value chain of this industry. In-depth interviews were conducted with various primary respondents, including key industry participants, subject matter experts, C-level executives of key market players, and industry consultants, among other experts, to obtain and verify critical qualitative and quantitative information as well as assess the growth prospects of the market.
Secondary Research
Secondary sources include annual reports, press releases, and investor presentations of companies; directories and databases, which include D&B, Bloomberg, and Factiva; white papers and articles from recognized authors; and publications and databases from associations, such as the International Energy Agency (IEA), the US Energy Information Administration (EIA), the International Renewable Energy Agency (IRENA), and the National Electrical Manufacturers Association (NEMA). Secondary research has been used to obtain important information about the key players, market classification & segmentation according to industry trends, and key developments related to the market. A database of the key industry leaders has also been prepared using secondary research.
Primary Research
In the primary research process, various sources from both the supply and demand sides have been interviewed to obtain and verify qualitative and quantitative information for this report and analyze prospects. Primary sources from the supply side include industry experts such as CEOs, vice presidents, marketing directors, technology and innovation directors, and related executives from various leading companies and organizations operating in the variable frequency drive market. Primary sources from the demand side include experts and key executives.
After the complete market engineering process (which includes calculations of market statistics, market breakdown, market size estimations, market forecasts, and data triangulation), extensive primary research has been conducted to gather information and verify and validate the critical numbers arrived at. Primary research has also been conducted to identify the segmentation, applications, Porter’s Five Forces, key players, competitive landscape, and key market dynamics such as drivers, opportunities, challenges, industry trends, and strategies adopted by key players.

Note 1: Others include sales managers, marketing managers, and product managers.
Note 2: Tier 1 companies’ revenues are more than USD 10 billion; tier 2 companies’ revenues range between USD 1 and 10 billion; and tier 3 companies’ revenues range between USD 500 million and USD 1 billion.
Source: Industry Experts
To know about the assumptions considered for the study, download the pdf brochure
Market Size Estimation
In the complete market engineering process, both the top-down and bottom-up approaches have been extensively used along with several data triangulation methods to estimate and forecast the overall market segments listed in this report.
The key players in the market have been identified through secondary research, and their market share in respective regions has been determined through primary and secondary research. This entire procedure includes the study of annual and financial reports of the key market players and extensive interviews for insights from industry leaders such as CEOs, vice presidents, directors, and marketing executives. All percentage shares, splits, and breakdowns have been determined using secondary sources and verified through primary sources.
MEA Variable Frequency Drive Market : Top-Down and Bottom-Up Approach

Data Triangulation
After arriving at the overall market size from the estimation process explained above, the total market has been split into several segments and sub-segments. Data triangulation and market breakdown procedures have been used wherever applicable to complete the overall market engineering process and to arrive at the exact statistics for all segments and sub-segments. The data has been triangulated by studying various factors and trends from both the demand and supply sides. The market has been validated using both the top-down and bottom-up approaches. Then, it was verified through primary interviews. Hence, for every data segment, there are three sources: the top-down approach, the bottom-up approach, and expert interviews. When the values arrived at from the three points matched, the data was assumed to be correct.
Market Definition
A variable frequency drive (VFD) is an electronic motor control device that drives an electric motor by changing the voltage and frequency supplied to the electric motor circuit. VFD works by converting fixed frequency and fixed voltage sine wave power to a variable frequency or variable output voltage, which is used to control the speed of a motor. It is also referred to as variable speed drive, adjustable speed drive, adjustable frequency drive, AC drive, micro drive, and inverter. The primary advantages of the use of VFD include reduced energy consumption and energy cost, controlled performance, extended equipment life, and low maintenance cost. It is mainly used for variable torque applications in various industries, such as oil & gas, water & wastewater treatment, power, paper & pulp, textiles, and mining. The market for variable frequency drives is defined as the sum of revenues generated by companies through the sale of variable frequency drives.
Stakeholders
- Government organizations and regulatory agencies
- VFD manufacturing companies
- Automotive, aerospace, marine, and industrial equipment manufacturers
- Research and development institutes
- Environmental and sustainability organizations
- Trade associations and industry forums related to VFD technologies
- Original equipment manufacturers (OEMs)
- Component and parts suppliers for VFD
- Consulting companies in the energy, automotive, and manufacturing sectors
- Transportation and logistics companies
- Maintenance and repair service providers
Report Objectives
- To describe and forecast the MEA variable frequency drive market in terms of value based on type, voltage, power rating, application, end user, and region
- To describe and forecast the MEA variable frequency drive market in terms of volume based on region and power rating
- To provide detailed information about the key factors, such as drivers, restraints, opportunities, and challenges influencing the growth of the MEA variable frequency drive market
- To strategically analyze the subsegments with respect to individual growth trends, prospects, and contributions of each segment to the overall market size
- To forecast the market size for the Middle East & Africa with key countries
- To strategically analyze micromarkets1 with respect to individual growth trends, prospects, and contributions to the total market
- To study the complete supply chain and allied industry segments and perform a supply chain analysis of the variable frequency drive market landscape
- To study market trends, patent analysis, trade analysis, tariff and regulatory landscape, Porter’s five forces analysis, ecosystem mapping, technology analysis, investment and funding scenario, key stakeholders & buying criteria, and case studies pertaining to the MEA variable frequency drive market
- To analyze the opportunities for various stakeholders by identifying the high-growth segments of the variable frequency drivemarket
- To profile the key players and comprehensively analyze their market positions in terms of ranking and core competencies, along with detailing the competitive landscape for the market leaders
- To analyze competitive developments, such as contracts, collaborations, expansions, product launches, investments, and acquisitions, in the MEA variable frequency drivemarket
Available Customizations
MarketsandMarkets offers customizations according to the specific needs of the companies with the given market data.
The following customization options are available for the report:
Product Analysis
- Product matrix, which gives a detailed comparison of the product portfolio of each company
Geographic Analysis as per Feasibility
- Further breakdown of the VFD market, by country
Company Information
- Detailed analysis and profiling of additional market players (up to five)
Key Questions Addressed by the Report
What is the current size of the MEA variable frequency drive market?
The market size for MEA variable frequency drive is estimated to be USD 0.98 billion in 2025.
What are the major drivers for the MEA variable frequency drive market?
The MEA variable frequency drive market is driven by increasing industrialization and growing demand for energy efficiency, rising need for enhancing energy efficiency and decreasing energy consumption, and a supportive regulatory environment for efficient and effective energy utilization.
Which will be the largest segment, by voltage, in the MEA variable frequency drive market during the forecast period?
The MEA VFD market is dominated by the low-voltage segment. Cost-effective and easily compatible with global low-voltage power systems, these VFDs are critical in HVAC, pump, and conveyor applications where energy efficiency and performance optimization are of prime importance. Initiatives by the international community for energy-efficient solutions and increasing industrial automation have further intensified the demand for low-voltage drives.
Which is the largest application in the MEA variable frequency drive market during the forecast period?
The pumps segment is estimated to account for the largest share of the overall market during the forecast period. This dominance is attributed to the wide usage of pumps in water & wastewater treatment, oil & gas, HVAC, and agriculture sectors. VFDs allow the speed of pumps to be accurately controlled, thereby saving energy while also reducing mechanical stress and enhancing system efficiency.
Which is the largest end user in the variable frequency drive market during the forecast period?
In the Middle East & Africa, the power sector is projected to be the leading end user of variable frequency drives (VFDs) throughout the forecast period. This dominance is driven by the region's ongoing efforts to expand electricity generation capacity, integrate renewable energy sources, and improve grid efficiency. VFDs play a crucial role in optimizing the performance of power generation and distribution systems by enabling better motor control, reducing energy consumption, and minimizing equipment wear. As countries invest heavily in modernizing their power infrastructure to meet growing energy demand, the adoption of VFDs in this sector is expected to surge significantly.
Need a Tailored Report?
Customize this report to your needs
Get 10% FREE Customization
Customize This ReportPersonalize This Research
- Triangulate with your Own Data
- Get Data as per your Format and Definition
- Gain a Deeper Dive on a Specific Application, Geography, Customer or Competitor
- Any level of Personalization
Let Us Help You
- What are the Known and Unknown Adjacencies Impacting the MEA Variable Frequency Drive Market
- What will your New Revenue Sources be?
- Who will be your Top Customer; what will make them switch?
- Defend your Market Share or Win Competitors
- Get a Scorecard for Target Partners

Custom Market Research Services
We Will Customise The Research For You, In Case The Report Listed Above Does Not Meet With Your Requirements
Get 10% Free CustomisationTESTIMONIALS

Kimberly Murphy
GLOBAL MARKETING DIRECTOR
Bently Nevada,
Leading Condition Monitoring & Asset Protectionwww.bakerhughesds.com/bently-nevada

MarketsandMarkets™ showed consistent rigor for success and relentlessly worked with Bently Nevada stakeholders to positively impact go-to-market strategy. Their proactiveness and flexibility has been instrumental in achieving the objectives to grow our sales pipeline in key industrial markets.

DARRICK HUEBER
Business Development Leader
Nexus Controls LLC,
Leading Manufacturer of Automation System & Electrical Panelswww.bakerhughesds.com/nexus-controls

We partnered with MarketsandMarkets to expand our business further by tapping into new industrial segments. It was critical for us to gather crucial business insights about specific markets to achieve this goal. MarketsandMarkets engagement model and client services helped us provide those insights, it was really impressive and valuable for my business. The team was extremely flexible and helpful.

Mike Schoff
Global Industrial Commercial Strategy Leader
Nexus Controls LLC
Leading Manufacturer of Automation System & Electrical Panelswww.bakerhughesds.com/nexus-controls
We consulted MarketsandMarkets for potential Partner Identification. Overall, it was a good experience. The insights provided through interviews conducted by the team helped us put together the questionnaire required for discussion with the selected partners. Their ability to provide insights through interviews with customers in a timely manner was quite impressive.


Growth opportunities and latent adjacency in MEA Variable Frequency Drive Market