
Medical Filtration Market

Medical Filtration Market by Material (Polyethersulfone; Polyvinylidenefluoride), Applications (Dialysis; Sterile Processing), Process Technology (Ultrafiltration; Microfiltration), Design/Process, End-Users & Region - Global Forecast to 2030


OVERVIEW
Source: Secondary Research, Interviews with Experts, MarketsandMarkets Analysis
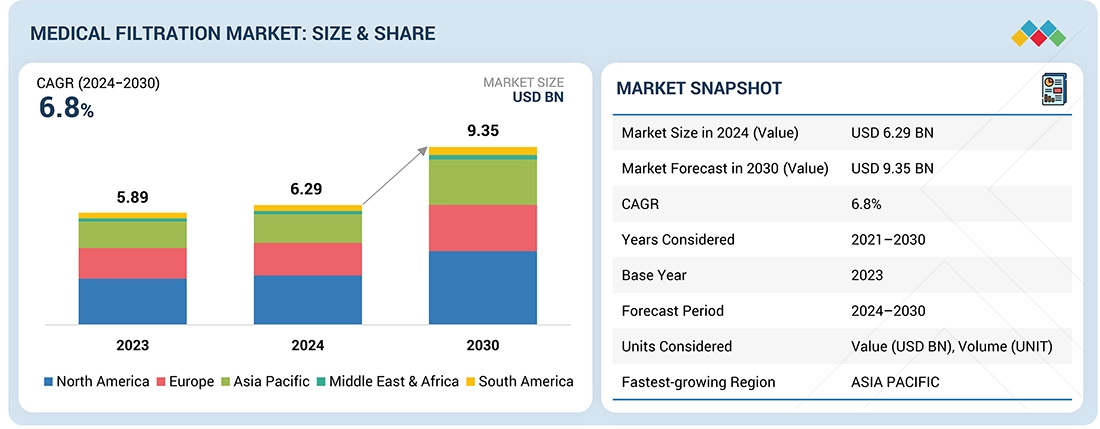
The medical filtration market is projected to reach USD 9.35 billion by 2030 from USD 6.29 billion in 2024, at a CAGR of 6.8% from 2024 to 2030. The medical filtration market is experiencing steady growth worldwide. This expansion is driven by the rising need for infection control, stricter regulatory standards, and increasing healthcare infrastructure investments, particularly in emerging economies
KEY TAKEAWAYS
-
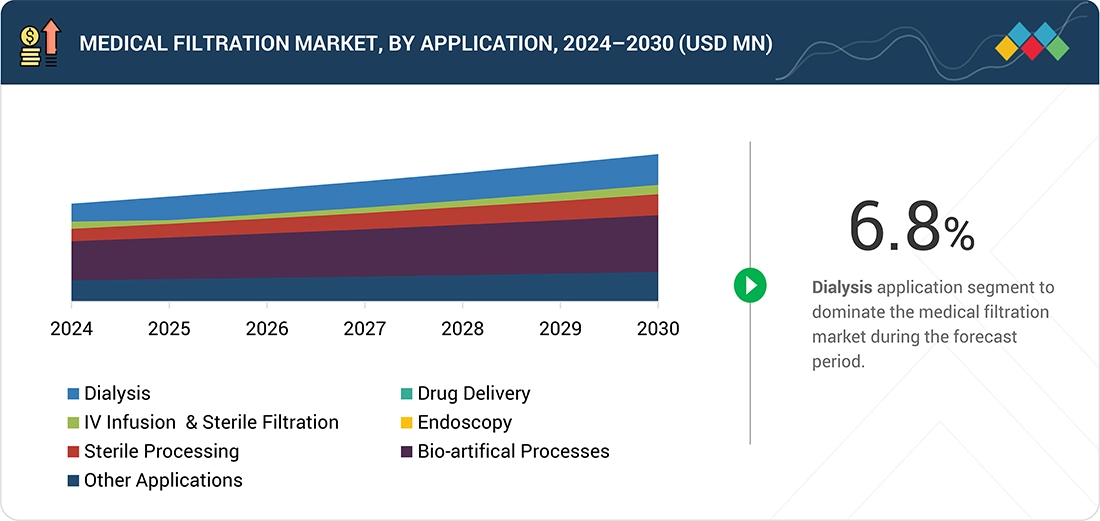
BY APPLICATIONThe medical filtration market by application type include dialysis, drug delivery, IV infusion & sterile filtration, endoscopy, sterile processing, bio-artificial process and other applications. Dialysis represents the largest application segment in the medical filtration market due to the critical need for high-performance filters in blood purification processes. Filtration is essential in dialysis machines to remove waste products, toxins, and excess fluids from the bloodstream while maintaining sterility and preventing contamination. The growing prevalence of chronic kidney disease (CKD) and end-stage renal disease (ESRD), coupled with an aging population, has significantly increased the demand for dialysis treatments worldwide.
-
BY DESIGN/PROCESSThe medical filtration market by design/process include systems, consumables (Filtration Modules), and others. Consumables, particularly filtration modules, represent the largest design or process type segment in the medical filtration market. These components are essential for maintaining sterile conditions in various medical and pharmaceutical applications, including dialysis, drug production, and laboratory processes. Their dominance is driven by their high replacement rate, cost-effectiveness, and widespread use across multiple end-use areas.
-
BY MATERIALThe medical filtration market by material type include PSU &PES, PVDF, PTFE, PP and other materials. Polysulfone (PSU) and polyethersulfone (PES) are the leading material types in the medical filtration market due to their superior mechanical strength, thermal stability, and biocompatibility. These polymers are widely used in membrane production for applications such as dialysis, sterile filtration, and biopharmaceutical processing. Their excellent chemical resistance and ability to withstand repeated sterilization cycles make them ideal for both reusable and disposable filtration systems
-
BY PROCESS TECHNOLOGYThe medical filtration market by process technology include ultrafiltration, microfiltration, nanofiltration, reversis osmosis, gas filtration and others. Microfiltration is the largest process technology segment in the medical filtration market, primarily due to its extensive use in removing bacteria, suspended particles, and other contaminants while maintaining essential biological components. It is widely applied in pharmaceutical manufacturing, sterile filtration of liquids, and hospital settings to ensure high levels of purity and safety. The technology’s versatility, cost-effectiveness, and compatibility with various materials such as PES and PVDF make it a preferred choice across multiple applications.
-
BY End-use IndustryThe medical filtration market by end-use industry include hospitals, diagnostics centers, research institutes and others. Hospitals represent the largest end-use segment in the medical filtration market, driven by the critical need for maintaining sterile and contamination-free environments. The growing number of hospitals, rising healthcare expenditures, and increasing focus on preventing hospital-acquired infections (HAIs) further boost demand.
-
BY REGIONThe medical filtration market covers Europe, North America, Asia Pacific, South America, the Middle East, and Africa. North America holds the largest share of the medical filtration market, supported by its well-established healthcare infrastructure, stringent regulatory standards, and strong focus on infection prevention and control. The region’s advanced medical facilities, high adoption of cutting-edge filtration technologies, and significant investments in R&D contribute to sustained market dominance. Additionally, the growing prevalence of chronic diseases and the presence of major medical device and filtration manufacturers drive consistent demand..
-
COMPETITIVE LANDSCAPEMajor market players have adopted both organic and inorganic strategies, including partnerships and investments. Merck KGaA (Germany), 3M (Solventum) (US), Danaher (US), Sartorius AG (Germany), Veolia (France), Thermo Fisher Scientific Inc. (US), Donaldson Company Inc. (US), Baxter (US), Parker Hannifin Corp. (US), Entegris (US), Asahi Kasei Corporation (Japan), and MANN+HUMMEL (Germany) are som of the major players in the medical filtration market.
The medical filtration market is witnessing strong global growth, driven by increasing healthcare investments, stricter infection control regulations, and heightened awareness following recent pandemics. Advanced filtration systems are becoming essential across hospitals, laboratories, and pharmaceutical manufacturing facilities to ensure clean and sterile environments. Regionally, Asia-Pacific is the fastest-growing market due to rapid healthcare expansion, while North America and Europe remain mature markets with steady demand driven by technological innovation and regulatory compliance.
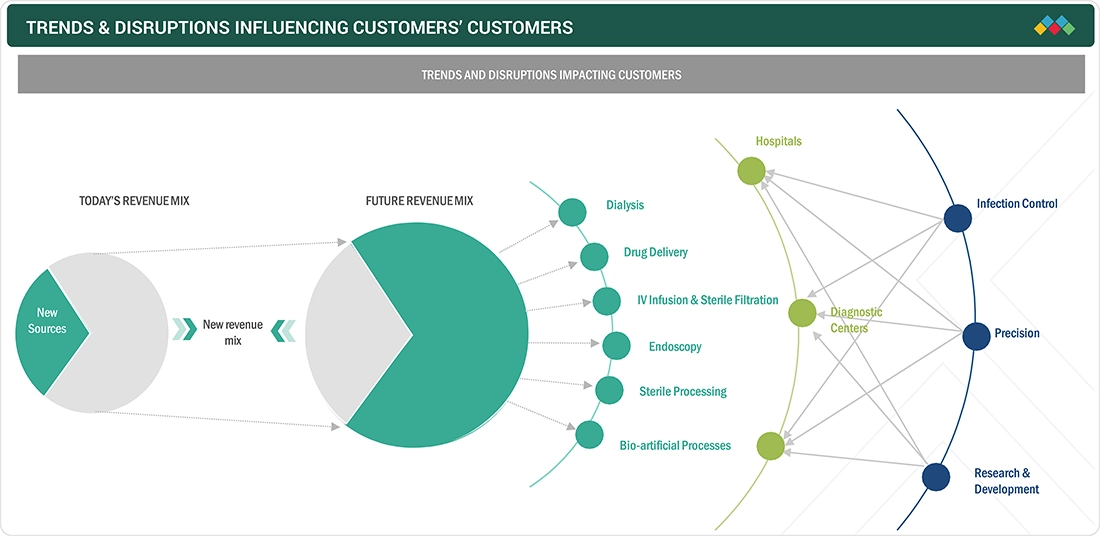
TRENDS & DISRUPTIONS IMPACTING CUSTOMERS' CUSTOMERS
Changes in customer trends or disruptions impact consumers’ businesses. These shifts impact the revenues of end users. Consequently, the revenue impact on end users is expected to affect the revenues of medical filtration products suppliers, which, in turn, impacts the revenues of medical filtration product manufacturers.
Source: Secondary Research, Interviews with Experts, MarketsandMarkets Analysis
MARKET DYNAMICS
Level
-
Growing demand for high-quality filtration solutions

-
Rising awareness of infection control

Level
-
High cost of advanced filtration systems.

-
Stringent regulatory compliance

Level
-
Advancments in filtration technologies

-
Growing healthcare investments

Level
-
Disposal of filters

Source: Secondary Research, Interviews with Experts, MarketsandMarkets Analysis
Driver: Growing demand for high-quality filtration solutions
The growing demand for high-quality filtration solutions is a major driver for the medical filtration market, fueled by the increased demand for safety and efficacy standards in healthcare applications. This industry is primarily responsible for expanding the scope of using reliable filtration technologies to ensure the purity of fluids used in research and clinical settings. Effective filtration is also considered necessary to comply with stringent regulatory requirements by governing agencies like the FDA and EMA to ensure high-quality standards for medical products. Continuous improvement in filtration technologies, including nanofiltration and membrane systems, enhances the accuracy and efficiency levels, resulting in the development of solutions that can perform well in critical applications, such as IV infusions and sterile processing. Key companies have shifted their focus toward growth opportunities by innovating and developing specialized filtration products to cater to changing demands from healthcare providers and research institutes. The emphasis on sustainability is further aiding the development of environmentally friendly filtration solutions. Because of the global shift in habits toward sustainable practices, the continuing dependence of the health sector on patient safety and product integrity will ensure continuing growth in demand for high-quality medical filtration solutions
Restraint: High cost of advanced filtration systems
The high cost of filtration systems is a critical restraint for the medical filtration market. While these systems are necessary for ensuring the purity and safety of medical products, they place a large capital investment burden on organizations and may be very expensive to install in smaller healthcare facilities and research institutes. For example, the installation cost for microfiltration and ultrafiltration systems may lie between thousands of dollars and millions of dollars, depending on their complexity and volume. Additionally, maintenance and operational costs are also considerable, especially in areas where finances are already depleted. For example, critical area filters like those for operation rooms and ICUs must be serviced frequently to keep them performing at their best; these add to the operating costs. Specialized materials and technologies, such as high-performance membranes that can withstand a strict sterilization cycle, add up to these operating costs. Therefore, most prospective users may not invest in such advanced filtration systems on time, thus negatively affecting the market. Additionally, it may discourage facilities from implementing new systems if their integration proves complicated. It then presents a very difficult environment that calls for companies to be more innovative with solutions but still work under the budget constraints of the customer
Opportunity: Advancements in filtration technologies
Advancements in filtration technologies provide significant opportunities to the medical filtration market through innovation and development for application in various fields across the healthcare industry. Developments in the last decade from material science fields have seen great progress in new technologies, such as the development of nanofiber and electrospun filters. The latter technology was the game changer, making filtration systems capture small particles and even pathogens more effectively. Such inventions have led to the development of filters that have better protection for airborne viruses, bacteria, and other contaminants to improve patient safety and infection control in health facilities. Another opportunity derives from the increasing demand for green filtration technology. The drive toward a green material and a reusable or recyclable filter corresponds to global trends in sustainability in the healthcare sector. Medical filtration companies are increasingly looking at systems that cut energy consumption, reduce waste, and are environmentally friendly, thereby opening new markets, especially areas with increasing awareness of an environment-friendly environment. Moreover, stringent regulations in the healthcare sector have created a need for more sterilization and tighter contaminant control, which results in the demand for advanced filtration equipment to meet current standards
Challenge: Disposal of filters
One of the main challenges for the medical filtration market remains the disposal of the filters used in medical filtration. Above all, it is associated with the complexities of medical waste disposal. Filters, especially in sterile applications, become contaminated with hazardous materials such as pathogens and chemical residues, requiring careful handling and disposal to avoid health risks. It further complicates the process because a high volume of medical waste and stringent regulatory requirements for disposal are involved. Many existing disposal methods like incineration and landfilling have raised more environmental concerns due to possible emissions of toxic substances and the risk of contaminating soil and water sources. The lack of a standardized protocol to sort and recycle medical filters increases inefficiencies, which is the reason that escalates costs at healthcare facilities. Therefore, it is imperative that companies operating within the medical filtration market push sustainable disposal solutions both in relation to compliance and a reduction in their environmental impact. This situation has created a need for innovative approaches, such as recycling programs for reclaiming materials safely from used filters in healthcare settings without compromising public health. Addressing these challenges effectively is important for establishing a more sustainable medical filtration industry and improving the overall waste management practices in healthcare settings
Medical Filtration Market: COMMERCIAL USE CASES ACROSS INDUSTRIES
| COMPANY | USE CASE DESCRIPTION | BENEFITS |
|---|---|---|
 |
Uses high-purity dialysis filtration systems for blood purification and water treatment. | Ensures sterile, contaminant-free dialysis water; reduces infection risk; supports patient safety and consistent treatment outcomes. |
 |
Utilizes ultrafiltration membranes for water purification and dialysis fluid management. | Provides reliable, sterile dialysis water; improves patient outcomes; reduces machine downtime. |
 |
Uses membrane filtration systems for sample preparation and contamination prevention | Ensures test accuracy, sterile sample handling, and regulatory compliance. |
Logos and trademarks shown above are the property of their respective owners. Their use here is for informational and illustrative purposes only.
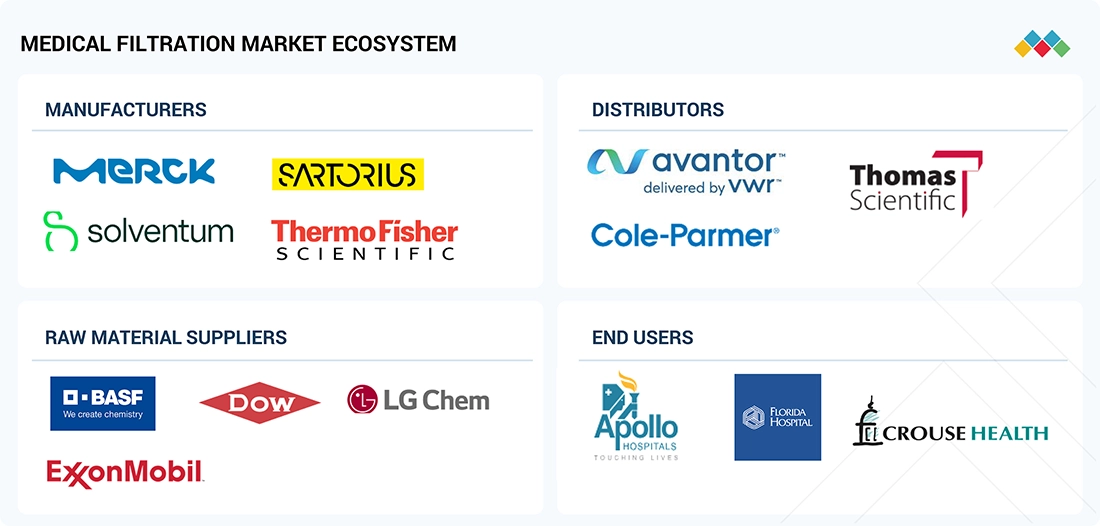
MARKET ECOSYSTEM
The medical filtration ecosystem analysis involves identifying and analyzing interconnected relationships among various stakeholders, including raw material supplies, equipment suppliers, manufacturers, distributors, and end users. The raw material suppliers provide filters, membrane materials, and others to medical filtration manufacturers. The distributors and suppliers establish contact between the manufacturing companies and end users to streamline the supply chain, increasing operational efficiency and profitability.
Logos and trademarks shown above are the property of their respective owners. Their use here is for informational and illustrative purposes only.
MARKET SEGMENTS
Source: Secondary Research, Interviews with Experts, MarketsandMarkets Analysis
Medical Filtration Market, By Application
Dialysis accounts for the largest market share of the medical filtration market, mainly due to the rising cases of chronic kidney disease and end-stage renal disease. The increasing global prevalence of kidney-related conditions, mainly attributed to the increasing cases of diabetes and hypertension—two leading risk factors for CKD—has led to an increased demand for dialysis treatments. Since dialysis filtration is the replacement of kidney function when the kidneys fail by removing waste and toxins from the blood, it is an inevitable necessity for patients with end-stage renal diseases. Technological advancements in dialysis filtration systems have increased the efficiency of treatment, decreased complications, and improved comfort for patients, leading to its wide adoption, such as high-flux and low-flux membranes. The two major modalities, hemodialysis and peritoneal dialysis, depend on advanced filtration technologies for both safety and efficacy. The global aging population has increased the demand for them since older adults have been increasingly found to be at an increased risk of getting kidney diseases and complications. In addition, the growth in the number of dialysis centers, home-based dialysis options, and government initiatives that facilitate access to dialysis care have further driven the growth of the market. The other factor is the frequency of dialysis treatment. Since patients require a number of sessions per week, the service creates a fairly consistent demand in terms of requirements for consumable items such as filters, membranes, and cartridges, thus stabilizing its position in the market
Medical Filtration Market, By Process Technology
Ultrafiltration held the second largest market share by process technology because it allows better efficiency with high versatility, coupled with the very critical application scope across several segments of health sciences. The mechanism of ultrafiltration involves the filtration of bacteria and viruses as well as other lethal pyrogens through semipermeable membranes while holding valuable proteins and other nutrients intact, which makes this choice appropriate for health and pharmaceutical streams. It finds applications in many critical operations like dialysis, blood purification, and preparation of intravenous fluids. Ultrafiltration is vital to remove excess fluid in the case of dialysis without letting go of electrolyte balance or other critical solutes, hence improving the efficacy of treatment. Ongoing innovations and advancements in membrane materials and designs have improved the efficiency and durability of ultrafiltration systems, thereby lowering the cost and making them available to both developed and emerging markets. The growing need for minimally invasive and highly effective treatments in the healthcare sector, combined with strict regulatory requirements for sterility and contamination control, has intensified the application of ultrafiltration in various healthcare facilities
REGION
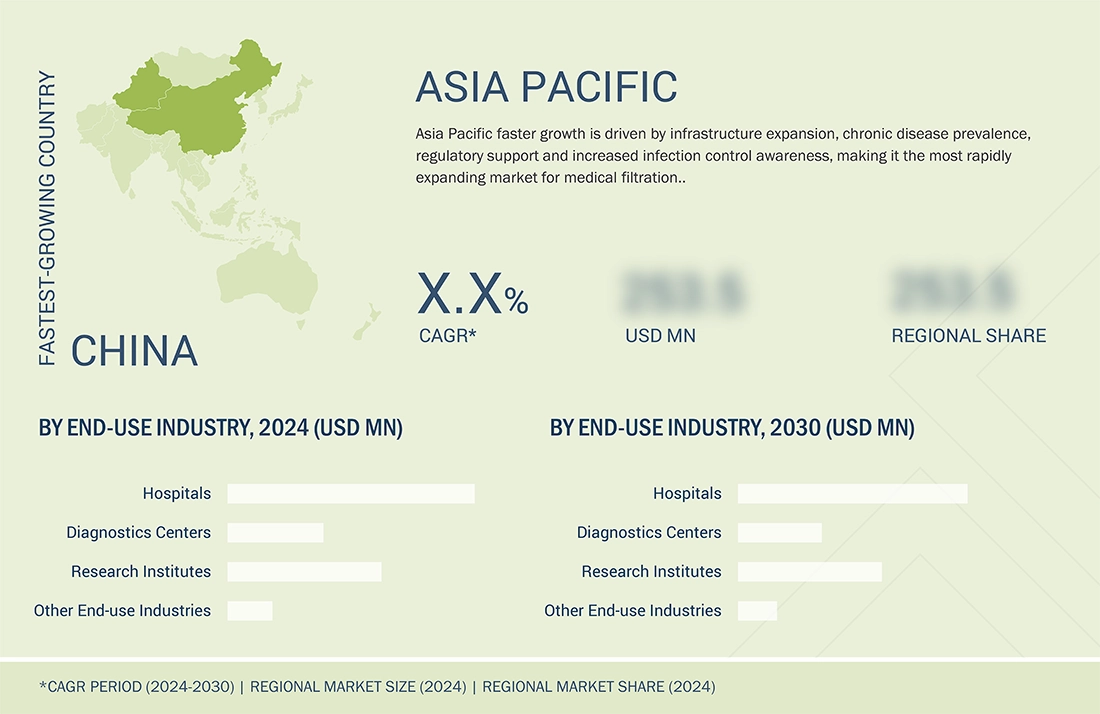
Asia Pacifi to be fastest-growing region in global medical filtration market during forecast period
The Asia Pacific is the fastest-growing market for medical filtration because of demographic, economic, and healthcare advances. The rapidly growing population, mainly in countries such as China, India, and countries in Southeast Asia, is also supporting the growth of the healthcare market in the region. The rising geriatric population facing chronic diseases like kidney disease, cardiovascular conditions, and diabetes are the biggest drivers for advanced medical filtration solutions in the region. The growing focus on infection control has significantly increased demand for sterility-based medical devices and filtration technologies to deliver contamination-free treatments without affecting the patient’s safety. Economic growth in the Asia Pacific has led to investment in healthcare infrastructure and the growth of medical services. The heavy investments by government and private sectors in healthcare and research facilities, especially in developing economies, are further boosting market growth. Asia Pacific has remained the hub of drug manufacturing and clinical trials primarily due to cost advantages and the availability of a skilled workforce. The demand for ultrafiltration and microfiltration solutions in the drug formulation and sterile processing stages has increased. More recently, awareness of infection prevention and cross-contamination in healthcare has promoted the adoption of filtration technologies. Increased healthcare spending, advances in medical technology, and increased focus on improving patient care have resulted in the high growth of the Asia Pacific medical filtration market.
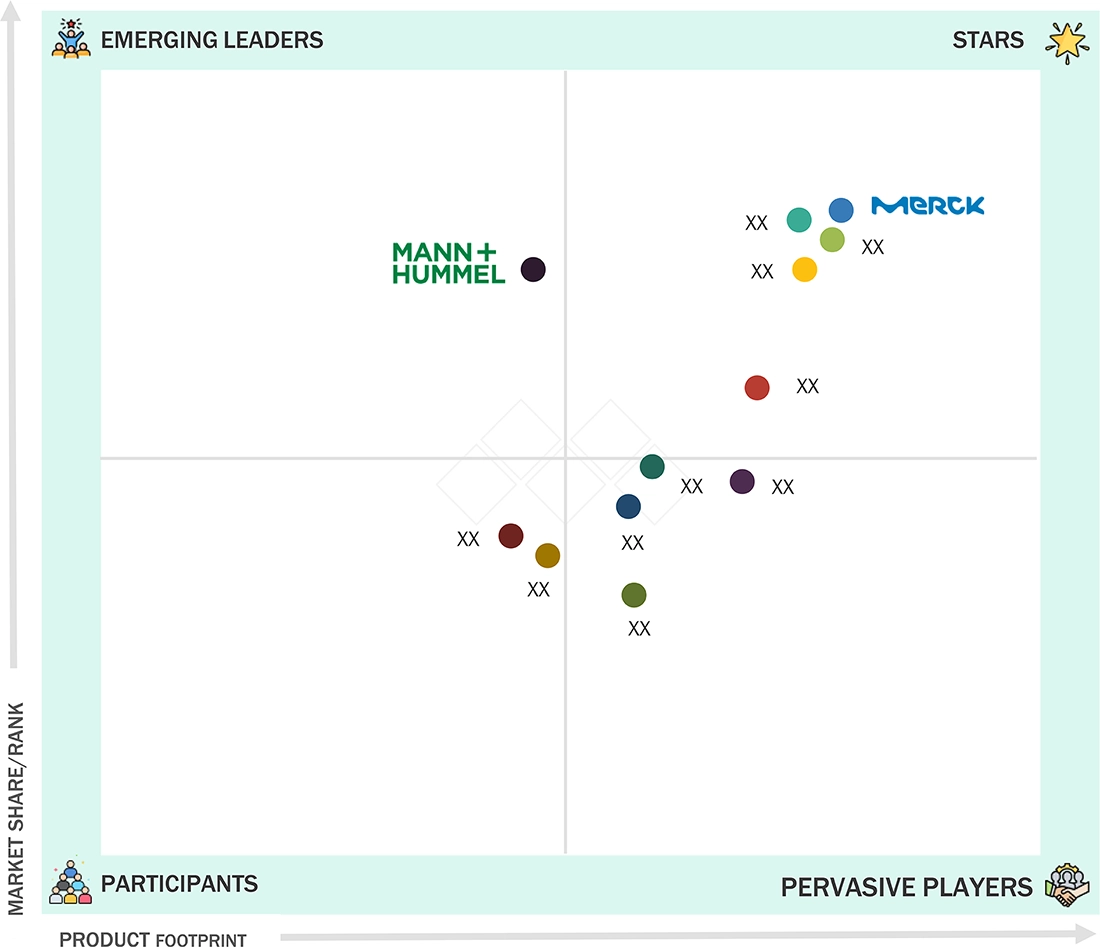
Medical Filtration Market: COMPANY EVALUATION MATRIX
In the medical filtration market matrix, Merck (Star), a US based company, leads the market through its high-quality medical filtration products, which find extensive applications in various applications such as dialysis machine, drug delivery and others.MANN+HUMMEL (Emerging Leader) is gaining traction with its technological advancements in medical filtration.
Source: Secondary Research, Interviews with Experts, MarketsandMarkets Analysis
KEY MARKET PLAYERS
MARKET SCOPE
| REPORT METRIC | DETAILS |
|---|---|
| Market Size in 2024 (Value) | USD 6.29 Billion |
| Market Forecast in 2030 (Value) | USD 9.35 Billion |
| Growth Rate | CAGR of 6.8% from 2024-2030 |
| Years Considered | 2021-2030 |
| Base Year | 2023 |
| Forecast Period | 2024-2030 |
| Units Considered | Value (USD Million/Billion), Volume (Unit) |
| Report Coverage | Revenue forecast, company ranking, competitive landscape, growth factors, and trends |
| Segments Covered |
|
| Regions Covered | North America, Asia Pacific, Europe, South America, Middle East & Africa |
WHAT IS IN IT FOR YOU: Medical Filtration Market REPORT CONTENT GUIDE
DELIVERED CUSTOMIZATIONS
We have successfully delivered the following deep-dive customizations:
| CLIENT REQUEST | CUSTOMIZATION DELIVERED | VALUE ADDS |
|---|---|---|
| Leading Medical Filtration Produts Supplier |
|
Supported go-to-market strategy and positioning vs competitors |
| Country-level insights for high-growth regions | Provided detailed market sizing and forecasts for the U.S., Germany, China, India, and Japan | Helped the client identify region-specific growth hotspots and investment opportunities |
RECENT DEVELOPMENTS
- September 2024 : Sartorius AG launched Vivaflow SU, setting a new standard in tangential flow filtration (TFF) for laboratories
- April 2024 : 3M completed the spin-off of its healthcare business, forming Solventum Corporation as an independent company
- May 2023 : Cytiva and Pall Corporation’s life sciences business merged under the Cytiva brand.
- May 2022 : Merck KGaA invested around USD 453 million to expand its membrane and filtration manufacturing in Cork, Ireland
- March 2020 : Danaher completed the acquisition of its Biopharma business from General Electric company’s life Science Business division
Table of Contents
 Exclusive indicates content/data unique to MarketsandMarkets and not available with any competitors.
Methodology
The study involved four major activities in estimating the market size of the medical filtration market. Exhaustive secondary research was done to collect information on the market, the peer market, and the grandparent market. The next step was to validate these findings, assumptions, and sizing with industry experts across the value chain through primary research. Both top-down and bottom-up approaches were employed to estimate the complete market size. Thereafter, the market breakdown and data triangulation procedures were used to estimate the market size of the segments and subsegments.
Secondary Research
In the secondary research process, various secondary sources have been referred to for identifying and collecting information for this study. These secondary sources include annual reports, press releases, investor presentations of companies, white papers, certified publications, trade directories, articles from recognized authors, gold standard and silver standard websites, and databases. Secondary research has been used to obtain key information about the value chain of the industry, monetary chain of the market, the total pool of key players, market classification and segmentation according to industry trends to the bottom-most level, and regional markets. It was also used to obtain information about the key developments from a market-oriented perspective.
Primary Research
The medical filtration market comprises several stakeholders in the value chain, which include manufacturers, and end users. Various primary sources from the supply and demand sides of the medical filtration market have been interviewed to obtain qualitative and quantitative information. The primary interviewees from the demand side include key opinion leaders in industrial sectors. The primary sources from the supply side include manufacturers, associations, and institutions involved in the medical filtration industry. Primary interviews were conducted to gather insights such as market statistics, data of revenue collected from the products and services, market breakdowns, market size estimations, market forecasting, and data triangulation. Primary research also helped in understanding the various trends related to type, material, end-use industry, and region. Stakeholders from the demand side, such as CIOs, CTOs, and CSOs were interviewed to understand the buyer’s perspective on the suppliers, products, component providers, and their current usage of medical filtration and outlook of their business, which will affect the overall market.
The breakdown of profiles of the primary interviewees is illustrated in the figure below:

Note: Tier 1, Tier 2, and Tier 3 companies are classified based on their market revenue in 2022 available in the public domain, product portfolios, and geographical presence.
Other designations include consultants and sales, marketing, and procurement managers.
To know about the assumptions considered for the study, download the pdf brochure
Market Size Estimation
The top-down and bottom-up approaches have been used to estimate and validate the size of the medical filtration market.
- The key players in the industry have been identified through extensive secondary research.
- The supply chain of the industry has been determined through primary and secondary research.
- All percentage shares, splits, and breakdowns have been determined using secondary sources and verified through primary sources.
- All possible parameters that affect the markets covered in this research study have been accounted for, viewed in extensive detail, verified through primary research, and analyzed to obtain the final quantitative and qualitative data.
- The research includes the study of reports, reviews, and newsletters of the key market players, along with extensive interviews for opinions with leaders such as directors and marketing executives.

Data Triangulation
After arriving at the total market size from the estimation process, the overall market has been split into several segments and sub-segments. To complete the overall market engineering process and arrive at the exact statistics for all the segments and sub-segments, the data triangulation and market breakdown procedures have been employed, wherever applicable. The data has been triangulated by studying various factors and trends from both the demand and supply sides. Along with this, the market size has been validated by using both the top-down and bottom-up approaches and primary interviews. Hence, for every data segment, there have been three sources—top-down approach, bottom-up approach, and expert interviews. The data was assumed correct when the values arrived from the three sources matched.
Market Definition
Medical filtration is the process that separates solid particles from fluids (liquids or gases) with the use of filter media which allows only the fluid to pass through it and retains the solid matter. This process inevitable in the healthcare settings for ensuring purity of air and fluids to enhance patient safety and improve the effectiveness of medical devices and procedures.
Stakeholders
- Senior Management
- End User
- Finance/Procurement Department
- R&D Department
- Manufacturers
- Raw Material Suppliers
Report Objectives
- To define, describe, and forecast the size of the medical filtration market, in terms of value and volume.
- To provide detailed information regarding the major factors (drivers, opportunities, restraints, and challenges) influencing the growth of the market
- To estimate and forecast the market size based on type, technology, application, end-use industry, and region.
- To forecast the size of the market with respect to major regions, namely, Europe, North America, Asia Pacific, Middle East & Africa, and South America, along with their key countries
- To strategically analyze micro-markets with respect to individual growth trends, prospects, and their contribution to the overall market
- To analyze opportunities in the market for stakeholders and provide a competitive landscape of market leaders.
- To track and analyze recent developments such as expansions, new product launches, partnerships & agreements, and acquisitions in the market.
- To strategically profile key market players and comprehensively analyze their core competencies.
Key Questions Addressed by the Report
Need a Tailored Report?
Customize this report to your needs
Get 10% FREE Customization
Customize This ReportPersonalize This Research
- Triangulate with your Own Data
- Get Data as per your Format and Definition
- Gain a Deeper Dive on a Specific Application, Geography, Customer or Competitor
- Any level of Personalization
Let Us Help You
- What are the Known and Unknown Adjacencies Impacting the Medical Filtration Market
- What will your New Revenue Sources be?
- Who will be your Top Customer; what will make them switch?
- Defend your Market Share or Win Competitors
- Get a Scorecard for Target Partners

Custom Market Research Services
We Will Customise The Research For You, In Case The Report Listed Above Does Not Meet With Your Requirements
Get 10% Free CustomisationTESTIMONIALS

We at Nissan Chemicals Corporation have been clients of MarketsandMarkets for more than a year now. We recently consulted MarketsandMarkets for a study, the team at MarketsandMarkets was extremely professional and organized. The business insights were very detailed and aligned well with our expectations that really helped us formulate the Business Plans and device new strategies for development themes. MarketsandMarkets offers a unique combination of expertise and dedicated engagement model. Their research findings have helped us in designing our Pricing Strategy which will make it easier for us to predict the future sales and profits for the next ten years. We look forward to working with MarketsandMarkets in the future.
VP of Strategy & New Business Development
Leading Specialty Chemical Company
The MarketsandMarkets Engagement Model, composed of both the Knowledge Store and advisory custom research, has greatly helped us in understanding our markets and making strategic decisions. The Knowledge Store is a fast way to allow everyone in our organization to understand more about most any market they are interested in. The ability to then get custom research done and get answers to specific strategic questions and market insight has been spectacular. The Markets and Markets team feel more like colleagues than vendors and their services have helped us change our culture where statements of things like growth opportunities and competitive position are always backed by industry research.

Rich Gibson,
Director, Corporate Strategy
Milliken & Company,
Leading Industrial Manufacturer of specialty chemical, floor covering, performance and protective textile materials, and healthcaremilliken.com
MarketsandMarkets is a trusted resource that helps us to better understand markets that are near-adjacencies-whether its technology, value chain or geography. Their Knowledge Store platform provides a dashboard of markets and their characteristics which is easy to use and saves us time.
Adam Shaw,
Market Development and Strategy Manager
AdvanSix Inc. USA,
An American Leader in Chemicalswww.advansix.com
The Knowledge Store from MarketsandMarkets is a valuable tool which has helped my team acquire greater insight in to the end markets that our business serves. This has enabled us to help our company build stronger strategies throughout our planning process.
TOSHIO KINOSHITA
Senior Chif Consultion Research & Consulting Division
Mitsubishi Chemical Research Corporation,
Leading Manufacturer of Chemical Productswww.mitsubishichem-res.co.jp/en/

We recently engaged with MarketsandMarkets for a study, the team not only clearly understood our business objectives but was also extremely professional in the way they handled the entire project. The study was efficiently conducted in a phase-wise manner, and the engagement model furnished us with high-quality business insights that far exceeded our expectations at each phase. We were especially happy that MarketsandMarkets could provide us with both, an English as well as a Japanese version of the study. A special thanks to the Analyst Team and Client Services Team, whose fluency in Japanese enhanced our comfort level, as we could converse with them in our preferred language.
Independent entrepreneurs
Arrow Precision
We approached MarketsandMarkets for study on Proppants Market, and their work exceeded our expectations. The study conducted was comprehensive and enabled us to view the market through the various dimensions. In addition, the team was extraordinarily responsive throughout the process and resolved our queries on time. I strongly recommend MarketsandMarkets and will certainly consider them for additional market assessments we will need in the future.
Global engineering company, Japan
Deputy Manager,
Strategic Planning OfficeThe high-quality insights shared by the MarketsandMarkets team helped us understand the pharmaceutical plant designers in a specific geography. It also captured the risks that we may likely face in communicating with our potential partners. The study would enable us identify partners, which would impact our future growth.


Growth opportunities and latent adjacency in Medical Filtration Market