Membrane Chromatography Market

Membrane Chromatography Market by Product (Consumables (Syringe Filters, Spin Column), Accessories), Technique (Ion Exchange, Affinity), Operation Mode (Flow Through), End User (Pharmaceutical & Biopharmaceutical Companies, CROs) - Global Forecast to 2025

Report Code: BT 6006 Jun, 2020, by marketsandmarkets.com

The Membrane Chromatography Market is projected to reach USD 408 million by 2025, at a CAGR of 15.5%. The growth of this market is largely driven by the benefits offered by membrane chromatography over conventional chromatography methods, increasing biopharmaceutical R&D, and increasing regulatory scrutiny on the cleaning validation of downstream purification processes. However, a lack of skilled professionals and technical limitations associated with membrane chromatography are expected to restrain the growth of the membrane chromatography market during the forecast period.

Membrane Chromatography Market

By type, the capsules, cassettes, and cartridges segment accounted for the largest share of the membrane chromatography consumables market in 2019.

The capsules, cassettes, and cartridges segment accounted for the largest share of the membrane chromatography consumables market in 2019. The large share of this segment is primarily attributed to the increasing use of capsules and cartridges for purification applications in biomanufacturing, lab-scale production, and process development.

By technique, the ion exchange membrane chromatography segment accounted for the largest share of the market in 2019.

The ion exchange membrane chromatography segment accounted for the largest share of the membrane adsorbers market in 2019. Advantages associated with ion exchange membrane chromatography such as reliability, accuracy and precision, high selectivity and speed, scalability, high separation efficiency, and low cost of consumables and disposables are supporting the growth of this segment.

By operation mode, the flow-through segment accounted for the largest share of the market in 2019.

The flow-through membrane chromatography segment accounted for the largest share of the membrane adsorbers market in 2019. The large share of this segment is attributed to the extensive use of the flow-through technology in the monoclonal antibody polishing process due to its high flow rate, reduced mass transfer resistance, low buffer consumption, and elimination of cost related to the packing and cleaning of columns.

By end user, the pharmaceutical and biopharmaceutical companies segment accounted for the largest share of the market in 2019.

The pharmaceutical and biopharmaceutical companies segment accounted for the largest share of the membrane chromatography market in 2019. The large share of this segment is attributed to the increased R&D in pharmaceutical and biopharmaceutical companies and increased production of biologics.

Membrane Chromatography Market by Region

North America dominates the membrane chromatography market.

The membrane chromatography market is divided into four major regions, namely, North America, Europe, Asia Pacific, and the Rest of the World (RoW). In 2019, North America accounted for the largest share of the global membrane chromatography market, closely followed by Europe. Factors such as the increasing demand for biopharmaceuticals, the presence of a well-established biopharmaceutical industry, and rising R&D expenditure by biopharmaceutical companies are driving the growth of the North American membrane chromatography market during the forecast period.

The Asia Pacific market is estimated to grow at the highest CAGR during the forecast period. Factors such as the growing biopharmaceutical industry, significant investments by key market players, increasing government support, and developing R&D infrastructure are supporting the growth of this market.

Key Market Players

The major companies in the membrane chromatography market are Sartorius AG (Germany), Danaher Corporation (US), Merck Millipore (Germany), Thermo Fisher Scientific (US), and 3M Company (US).

Sartorius AG (Germany) dominated the global membrane chromatography market in 2019, owing to its strong distribution network and geographical presence. The company operates in this market through both segments, Bioprocess Solutions and Lab Products and Services. The company focuses on strengthening its position in the market by adopting organic and inorganic strategies such as product launches, acquisitions, and expansions.

Get online access to the report on the World's First Market Intelligence Cloud

  • Easy to Download Historical Data & Forecast Numbers
  • Company Analysis Dashboard for high growth potential opportunities
  • Research Analyst Access for customization & queries
  • Competitor Analysis with Interactive dashboard
  • Latest News, Updates & Trend analysis
Request Sample

Scope of the Report

Report Metric

Details

Market Size Available for Years

2018–2025

Base Year Considered

2019

Forecast Period

2020–2025

Forecast Units

Values (USD Million)

Segments Covered

By Product, Technique, Operation Mode, End User, and Region

Geographies Covered

North America (US and Canada), Europe (Germany, France, UK, and RoE), APAC (China, Japan, India, and RoAPAC), and RoW

Top Companies Covered

Sartorius AG, Danaher Corporation, Merck Millipore, Thermo Fisher Scientific, 3M Company, Asahi Kasei Corporation, Cole-Parmer Instrument Company, Restek Corporation, Purilogics, GVS Group, Membrane Solutions LLC, Regis Technologies Inc., and GL Sciences Inc.

Based on product, the membrane chromatography market is segmented as follows:

  • Consumables
    • Capsules, Cassettes, and Cartridges
    • Syringe Filters
    • Filter Plates
    • Spin Columns
    • Membrane Discs and Sheets
    • Other Consumables
  • Accessories

Based on technique, the membrane adsorbers market is segmented as follows:

  • Ion Exchange Membrane Chromatography
    • Anion Exchange Membrane Chromatography
    • Cation Exchange Membrane Chromatography
  • Affinity Membrane Chromatography
  • Hydrophobic Interaction Membrane Chromatography

Based on operation mode, the membrane adsorbers market is segmented as follows:

  • Flow-through Membrane Chromatography
  • Bind-elute Membrane Chromatography

Based on end user, the membrane chromatography market is segmented as follows:

  • Pharmaceutical and Biopharmaceutical Companies
  • CROs
  • Academic and Research Institutes

Based on region, the membrane chromatography market is segmented as follows:

  • North America
    • US
    • Canada
  • Europe
    • Germany
    • UK
    • France
    • RoE
  • Asia Pacific
    • China
    • India
    • Japan
    • RoAPAC
  • RoW

Recent Developments:

  • In 2020, Danaher Corporation completed the acquisition of the Biopharma business of General Electric Company’s Life Sciences division and rebranded it as Cytiva.
  • In 2019, Sartorius AG entered into an agreement to acquire parts of Danaher’s Life Science portfolio, which is complementary to the portfolio of Sartorius’ laboratory and bioprocess business. This transaction is expected to be completed in the first quarter of 2020.
  • In 2019, Thermo Fisher Scientific invested ~USD 24 million in its Scotland site to expand its global bioproduction capabilities and to cater to the demand for industry-leading bioproduction products.
  • In 2018, 3M Company launched Emphaze AEX Hybrid Purifier Capsules.
  • In 2017, Sartorius AG launched Sartobind Cassettes.

Key Questions Addressed by the Report:

  • Who are the major players in the membrane chromatography market?
  • What are the regional growth trends and the largest revenue-generating regions in the membrane chromatography market?
  • What are the major drivers and challenges of the membrane chromatography market?
  • What are the major product segments in the membrane chromatography market?
  • Who are the major end users in the membrane chromatography market?

To speak to our analyst for a discussion on the above findings, click Speak to Analyst

TABLE OF CONTENTS

1 INTRODUCTION (Page No. - 10)
    1.1 OBJECTIVES OF THE STUDY
    1.2 MARKET DEFINITION
           1.2.1 INCLUSIONS & EXCLUSIONS
    1.3 MARKET SCOPE
           1.3.1 MARKETS COVERED
           1.3.2 YEARS CONSIDERED FOR THE STUDY
    1.4 CURRENCY
    1.5 LIMITATIONS
    1.6 STAKEHOLDERS
    1.7 SUMMARY OF CHANGES

2 RESEARCH METHODOLOGY (Page No. - 15)
    2.1 RESEARCH DATA
           2.1.1 SECONDARY DATA
           2.1.2 PRIMARY DATA
           2.1.3 DATA TRIANGULATION
    2.2 MARKET ESTIMATION METHODOLOGY
    2.3 MARKET GROWTH RATE PROJECTIONS
    2.4 RESEARCH ASSUMPTIONS

3 EXECUTIVE SUMMARY (Page No. - 20)

4 PREMIUM INSIGHTS (Page No. - 24)
    4.1 MEMBRANE CHROMATOGRAPHY MARKET OVERVIEW
    4.2 NORTH AMERICA: MEMBRANE CHROMATOGRAPHY MARKET SHARE, BY PRODUCT & COUNTRY (2019)
    4.3 MEMBRANE CHROMATOGRAPHY MARKET SHARE, BY END USER, 2019
    4.4 MEMBRANE ADSORBERS MARKET, BY OPERATION MODE, 2020 VS. 2025 (USD MILLION)
    4.5 MEMBRANE CHROMATOGRAPHY MARKET: GEOGRAPHIC GROWTH OPPORTUNITIES

5 MARKET OVERVIEW (Page No. - 28)
    5.1 INTRODUCTION
    5.2 MEMBRANE CHROMATOGRAPHY: MARKET DYNAMICS
           5.2.1 DRIVERS
                    5.2.1.1 Benefits offered by membrane chromatography over conventional chromatography techniques
                    5.2.1.2 Increasing biopharmaceutical R&D
                    5.2.1.3 Increasing regulatory scrutiny on the cleaning validation of downstream purification processes
           5.2.2 RESTRAINTS
                    5.2.2.1 Limited use of membrane chromatography products in large-scale manufacturing
           5.2.3 OPPORTUNITIES
                    5.2.3.1 Emerging markets
                    5.2.3.2 Patent expiry
           5.2.4 CHALLENGES
                    5.2.4.1 Lack of skilled professionals
                    5.2.4.2 Technical limitations associated with membrane chromatography
    5.3 PORTER’S FIVE FORCES ANALYSIS
           5.3.1 THREAT OF NEW ENTRANTS
           5.3.2 THREAT OF SUBSTITUTES
           5.3.3 BARGAINING POWER OF SUPPLIERS
           5.3.4 BARGAINING POWER OF BUYERS
           5.3.5 INTENSITY OF COMPETITIVE RIVALRY
    5.4 VALUE CHAIN ANALYSIS
    5.5 TECHNOLOGY ANALYSIS
    5.6 IMPACT OF THE COVID-19 OUTBREAK ON THE MEMBRANE CHROMATOGRAPHY MARKET

6 MEMBRANE CHROMATOGRAPHY MARKET, BY PRODUCT (Page No. - 40)
    6.1 INTRODUCTION
    6.2 CONSUMABLES
           6.2.1 CAPSULES, CASSETTES, & CARTRIDGES
                    6.2.1.1 Capsules, cassettes, and cartridges segment to dominate the membrane chromatography consumables market
           6.2.2 SYRINGE FILTERS
                    6.2.2.1 Growing demand for syringe filters in lab-scale purification is a key driver for this segment
           6.2.3 FILTER PLATES
                    6.2.3.1 Filter plates have a higher flow-through rate that facilitates fast purification
           6.2.4 SPIN COLUMNS
                    6.2.4.1 Spin columns allow convenient processing of multiple small-scale samples
           6.2.5 MEMBRANE DISCS & SHEETS
                    6.2.5.1 Membrane discs & sheets are used as separation tools in a variety of viral and protein purification applications
           6.2.6 OTHER CONSUMABLES
    6.3 ACCESSORIES
                    6.3.1.1 Accessories account for a smaller share of the membrane chromatography market due to their low purchase frequency as compared to consumables

7 MEMBRANE ADASORBERS MARKET, BY TECHNIQUE (Page No. - 53)
    7.1 INTRODUCTION
    7.2 ION EXCHANGE MEMBRANE CHROMATOGRAPHY
           7.2.1 ANION EXCHANGE MEMBRANE CHROMATOGRAPHY
                    7.2.1.1 HIGH REQUIREMENT FOR mAbs PURIFICATION HAS RESULTED IN the INCREASED ADOPTION OF ANION EXCHANGE MEMBRANE CHROMATOGRAPHY
           7.2.2 CATION EXCHANGE MEMBRANE CHROMATOGRAPHY
                    7.2.2.1 INCREASING DEMAND FOR CEX IN VIRUS PURIFICATION TO DRIVE MARKET GROWTH
    7.3 AFFINITY MEMBRANE CHROMATOGRAPHY
           7.3.1 INCREASING DEMAND FOR THERAPEUTIC PROTEINS IS EXPECTED TO SUPPORT MARKET GROWTH
    7.4 HYDROPHOBIC INTERACTION MEMBRANE CHROMATOGRAPHY
           7.4.1 HIMC IS USED FOR THE SEPARATION OF BIOMOLECULES

8 MEMBRANE ADSORBERS MARKET, BY OPERATION MODE (Page No. - 63)
    8.1 INTRODUCTION
    8.2 FLOW-THROUGH MEMBRANE CHROMATOGRAPHY
           8.2.1 FLOW-THROUGH MEMBRANE CHROMATOGRAPHY IS WIDELY USED IN THE MONOCLONAL ANTIBODY POLISHING PROCESS
    8.3 BIND-ELUTE MEMBRANE CHROMATOGRAPHY
           8.3.1 BIND-ELUTE MEMBRANE CHROMATOGRAPHY SEGMENT TO REGISTER HIGH GROWTH RATE DURING THE FORECAST PERIOD

9 MEMBRANE CHROMATOGRAPHY MARKET, BY END USER (Page No. - 68)
    9.1 INTRODUCTION
    9.2 PHARMACEUTICAL & BIOPHARMACEUTICAL COMPANIES
           9.2.1 INCREASED PHARMACEUTICAL R&D SPENDING IS DRIVING THE DEMAND FOR MEMBRANE CHROMATOGRAPHY
    9.3 CONTRACT RESEARCH ORGANIZATIONS (CROS)
           9.3.1 INCREASING OUTSOURCING OF R&D SERVICES BY PHARMACEUTICAL & BIOPHARMACEUTICAL COMPANIES TO SUPPORT MARKET GROWTH
    9.4 ACADEMIC & RESEARCH INSTITUTES
           9.4.1 GROWING COLLABORATIONS BETWEEN PHARMACEUTICAL & BIOPHARMACEUTICAL MANUFACTURERS AND RESEARCH INSTITUTES TO DRIVE MARKET GROWTH

10 MEMBRANE CHROMATOGRAPHY MARKET, BY REGION (Page No. - 74)
     10.1 INTRODUCTION
     10.2 NORTH AMERICA
             10.2.1 US
                        10.2.1.1 The US dominates the North American membrane chromatography market
             10.2.2 CANADA
                        10.2.2.1 Government initiatives and technological advancements in diagnostic techniques to support market growth
     10.3 EUROPE
             10.3.1 GERMANY
                        10.3.1.1 Presence of an established pharmaceuticals industry in Germany is driving market growth
             10.3.2 UK
                        10.3.2.1 New drug developments to propel the demand for membrane chromatography in the UK
             10.3.3 FRANCE
                        10.3.3.1 Increasing private and public funding for biotech research to drive market growth in France
             10.3.4 ROE
     10.4 ASIA PACIFIC
             10.4.1 SIGNIFICANT INVESTMENTS BY BIOPHARMACEUTICAL COMPANIES IN EMERGING APAC COUNTRIES TO DRIVE MARKET GROWTH
     10.5 REST OF THE WORLD

11 COMPETITIVE LANDSCAPE (Page No. - 104)
     11.1 MARKET EVALUATION FRAMEWORK
     11.2 REVENUE ANALYSIS OF TOP MARKET PLAYERS
     11.3 KEY MARKET DEVELOPMENTS
             11.3.1 KEY PRODUCT LAUNCHES
             11.3.2 KEY ACQUISITIONS
             11.3.3 KEY PARTNERSHIPS, AGREEMENTS, AND COLLABORATIONS
             11.3.4 KEY EXPANSIONS

12 COMPANY EVALUATION MATRIX AND COMPANY PROFILES (Page No. - 108)
     12.1 OVERVIEW
     12.2 GLOBAL MEMBRANE CHROMATOGRAPHY MARKET: COMPANY EVALUATION MATRIX
             12.2.1 STARS
             12.2.2 EMERGING LEADERS
             12.2.3 PERVASIVE
             12.2.4 EMERGING COMPANIES
     12.3 COMPANY PROFILES
             12.3.1 SARTORIUS AG
                        12.3.1.1 Business Overview
                        12.3.1.2 Products Offered
                        12.3.1.3 Recent Developments
                        12.3.1.4 MNM View
             12.3.2 DANAHER CORPORATION
                        12.3.2.1 Business overview
                        12.3.2.2 Products Offered
                        12.3.2.3 Recent Developments
                        12.3.2.4 MNM View
             12.3.3 MERCK MILLIPORE
                        12.3.3.1 Business Overview
                        12.3.3.2 Products Offered
                        12.3.3.3 Recent Developments
                        12.3.3.4 MNM View
             12.3.4 THERMO FISHER SCIENTIFIC, INC.
                        12.3.4.1 Business Overview
                        12.3.4.2 Products offered
                        12.3.4.3 Recent Developments
             12.3.5 3M COMPANY
                        12.3.5.1 Business Overview
                        12.3.5.2 Products Offered
                        12.3.5.3 Recent Developments
             12.3.6 ASAHI KASEI CORPORATION
                        12.3.6.1 Business Overview
                        12.3.6.2 Products Offered
                        12.3.6.3 Recent Developments
             12.3.7 COLE-PARMER INSTRUMENT COMPANY, LLC
                        12.3.7.1 Business Overview
                        12.3.7.2 Products Offered
                        12.3.7.3 Recent Developments
             12.3.8 RESTEK CORPORATION
                        12.3.8.1 BUSINESS OVERVIEW
                        12.3.8.2 Products Offered
             12.3.9 PURILOGICS
                        12.3.9.1 Business Overview
                        12.3.9.2 Products Offered
                        12.3.9.3 Recent Developments
             12.3.10 GVS GROUP
                        12.3.10.1 Business Overview
                        12.3.10.2 Products Offered
             12.3.11 START-UPS/SME COMPANY PROFILES
                        12.3.11.1 Membrane Solutions LLC
                        12.3.11.2 Regis Technologies, Inc.
                        12.3.11.3 GL Sciences, Inc.

13 APPENDIX (Page No. - 127)
     13.1 DISCUSSION GUIDE
     13.2 KNOWLEDGE STORE: MARKETSANDMARKETS’ SUBSCRIPTION PORTAL
     13.3 AVAILABLE CUSTOMIZATIONS
     13.4 RELATED REPORTS
     13.5 AUTHOR DETAILS


LIST OF TABLES (136 TABLES)

TABLE 1 US: BIOLOGICS GOING OFF-PATENT DURING 2018−2019
TABLE 2 TECHNOLOGY ANALYSIS: COLUMN CHROMATOGRAPHY VS. MEMBRANE CHROMATOGRAPHY
TABLE 3 MEMBRANE CHROMATOGRAPHY MARKET, BY PRODUCT, 2018–2025 (USD MILLION)
TABLE 4 MEMBRANE CHROMATOGRAPHY CONSUMABLES MARKET, BY TYPE, 2018−2025 (USD MILLION)
TABLE 5 MEMBRANE ADSORBERS MARKET, BY TYPE 2018−2025 (THOUSAND UNITS)
TABLE 6 MEMBRANE CHROMATOGRAPHY CONSUMABLES MARKET, BY REGION, 2018–2025 (USD MILLION)
TABLE 7 NORTH AMERICA: MEMBRANE CHROMATOGRAPHY CONSUMABLES MARKET, BY COUNTRY, 2018–2025 (USD MILLION)
TABLE 8 EUROPE: MEMBRANE CHROMATOGRAPHY CONSUMABLES MARKET, BY COUNTRY, 2018–2025 (USD MILLION)
TABLE 9 CAPSULES, CASSETTES, & CARTRIDGES MARKET, BY REGION, 2018–2025 (USD MILLION)
TABLE 10 NORTH AMERICA: CAPSULES, CASSETTES, & CARTRIDGES MARKET, BY COUNTRY, 2018–2025 (USD MILLION)
TABLE 11 EUROPE: CAPSULES, CASSETTES, & CARTRIDGES MARKET, BY COUNTRY, 2018–2025 (USD MILLION)
TABLE 12 SYRINGE FILTERS MARKET, BY REGION, 2018–2025 (USD MILLION)
TABLE 13 NORTH AMERICA: SYRINGE FILTERS MARKET, BY COUNTRY, 2018–2025 (USD MILLION)
TABLE 14 EUROPE: SYRINGE FILTERS MARKET, BY COUNTRY, 2018–2025 (USD MILLION)
TABLE 15 FILTER PLATES MARKET, BY REGION, 2018–2025 (USD MILLION)
TABLE 16 NORTH AMERICA: FILTER PLATES MARKET, BY COUNTRY, 2018–2025 (USD MILLION)
TABLE 17 EUROPE: FILTER PLATES MARKET, BY COUNTRY, 2018–2025 (USD MILLION)
TABLE 18 SPIN COLUMNS MARKET, BY REGION, 2018–2025 (USD MILLION)
TABLE 19 EUROPE: SPIN COLUMNS MARKET, BY COUNTRY, 2018–2025 (USD MILLION)
TABLE 20 MEMBRANE DISCS & SHEETS MARKET, BY REGION, 2018–2025 (USD MILLION)
TABLE 21 NORTH AMERICA: MEMBRANE DISCS & SHEETS MARKET, BY COUNTRY, 2018–2025 (USD MILLION)
TABLE 22 EUROPE : MEMBRANE DISCS & SHEETS MARKET, BY COUNTRY, 2018–2025 (USD MILLION)
TABLE 23 OTHER CONSUMABLES MARKET, BY REGION, 2018–2025 (USD MILLION)
TABLE 24 NORTH AMERICA: OTHER CONSUMABLES MARKET, BY COUNTRY, 2018–2025 (USD MILLION)
TABLE 25 EUROPE: OTHER CONSUMABLES MARKET, BY COUNTRY, 2018–2025 (USD MILLION)
TABLE 26 MEMBRANE CHROMATOGRAPHY ACCESSORIES MARKET, BY REGION, 2018–2025 (USD MILLION)
TABLE 27 NORTH AMERICA: MEMBRANE CHROMATOGRAPHY ACCESSORIES MARKET, BY COUNTRY, 2018–2025 (USD MILLION)
TABLE 28 EUROPE: MEMBRANE CHROMATOGRAPHY ACCESSORIES MARKET, BY COUNTRY, 2018–2025 (USD MILLION)
TABLE 29 MEMBRANE ADSORBERS MARKET, BY TECHNIQUE, 2018–2025 (USD MILLION)
TABLE 30 ION EXCHANGE MEMBRANE CHROMATOGRAPHY MARKET, BY TYPE, 2018–2025 (USD MILLION)
TABLE 31 ION EXCHANGE MEMBRANE CHROMATOGRAPHY MARKET, BY REGION, 2018–2025 (USD MILLION)
TABLE 32 NORTH AMERICA: ION EXCHANGE MEMBRANE CHROMATOGRAPHY MARKET, BY COUNTRY, 2018–2025 (USD MILLION)
TABLE 33 EUROPE: ION EXCHANGE MEMBRANE CHROMATOGRAPHY MARKET, BY COUNTRY, 2018–2025 (USD MILLION)
TABLE 34 ANION EXCHANGE CHROMATOGRAPHY MEMBRANE: LIGAND FUNCTIONAL GROUPS
TABLE 35 ANION EXCHANGE MEMBRANE CHROMATOGRAPHY MARKET, BY REGION, 2018–2025 (USD MILLION)
TABLE 36 NORTH AMERICA: ANION EXCHANGE MEMBRANE CHROMATOGRAPHY MARKET, BY COUNTRY, 2018–2025 (USD MILLION)
TABLE 37 EUROPE: ANION EXCHANGE MEMBRANE CHROMATOGRAPHY MARKET, BY COUNTRY, 2018–2025 (USD MILLION)
TABLE 38 CATION EXCHANGE CHROMATOGRAPHY MEMBRANE: LIGAND FUNCTIONAL GROUPS
TABLE 39 CATION EXCHANGE MEMBRANE CHROMATOGRAPHY MARKET, BY REGION, 2018–2025 (USD MILLION)
TABLE 40 NORTH AMERICA: CATION EXCHANGE MEMBRANE CHROMATOGRAPHY MARKET, BY COUNTRY, 2018–2025 (USD MILLION)
TABLE 41 EUROPE: CATION EXCHANGE MEMBRANE CHROMATOGRAPHY MARKET, BY COUNTRY, 2018–2025 (USD MILLION)
TABLE 42 AFFINITY MEMBRANE CHROMATOGRAPHY MARKET, BY REGION, 2018–2025 (USD MILLION)
TABLE 43 NORTH AMERICA: AFFINITY MEMBRANE CHROMATOGRAPHY MARKET, BY COUNTRY, 2018–2025 (USD MILLION)
TABLE 44 EUROPE: AFFINITY MEMBRANE CHROMATOGRAPHY MARKET, BY COUNTRY, 2018–2025 (USD MILLION)
TABLE 45 HYDROPHOBIC INTERACTION MEMBRANE CHROMATOGRAPHY MARKET, BY REGION, 2018–2025 (USD MILLION)
TABLE 46 NORTH AMERICA: HYDROPHOBIC INTERACTION MEMBRANE CHROMATOGRAPHY MARKET, BY COUNTRY, 2018–2025 (USD MILLION)
TABLE 47 EUROPE: HYDROPHOBIC INTERACTION MEMBRANE CHROMATOGRAPHY MARKET, BY COUNTRY, 2018–2025 (USD MILLION)
TABLE 48 MEMBRANE ADSORBERS MARKET, BY OPERATION MODE, 2018–2025 (USD MILLION)
TABLE 49 FLOW-THROUGH MEMBRANE CHROMATOGRAPHY MARKET, BY REGION, 2018–2025 (USD MILLION)
TABLE 50 NORTH AMERICA: FLOW-THROUGH MEMBRANE CHROMATOGRAPHY MARKET, BY COUNTRY, 2018–2025 (USD MILLION)
TABLE 51 EUROPE: FLOW-THROUGH MEMBRANE CHROMATOGRAPHY MARKET, BY COUNTRY, 2018–2025 (USD MILLION)
TABLE 52 BIND-ELUTE MEMBRANE CHROMATOGRAPHY MARKET, BY REGION, 2018–2025 (USD MILLION)
TABLE 53 NORTH AMERICA: BIND-ELUTE MEMBRANE CHROMATOGRAPHY MARKET, BY COUNTRY, 2018–2025 (USD MILLION)
TABLE 54 EUROPE: BIND-ELUTE MEMBRANE CHROMATOGRAPHY MARKET, BY COUNTRY, 2018–2025 (USD MILLION)
TABLE 55 MEMBRANE CHROMATOGRAPHY MARKET, BY END USER, 2018–2025 (USD MILLION)
TABLE 56 MEMBRANE CHROMATOGRAPHY MARKET FOR PHARMACEUTICAL & BIOPHARMACEUTICAL COMPANIES, BY REGION, 2018–2025 (USD MILLION)
TABLE 57 NORTH AMERICA: MEMBRANE CHROMATOGRAPHY MARKET FOR PHARMACEUTICAL & BIOPHARMACEUTICAL COMPANIES, BY COUNTRY, 2018–2025 (USD MILLION)
TABLE 58 EUROPE: MEMBRANE CHROMATOGRAPHY MARKET FOR PHARMACEUTICAL & BIOPHARMACEUTICAL COMPANIES, BY COUNTRY, 2018–2025 (USD MILLION)
TABLE 59 MEMBRANE CHROMATOGRAPHY MARKET FOR CROS, BY REGION, 2018–2025 (USD MILLION)
TABLE 60 NORTH AMERICA: MEMBRANE CHROMATOGRAPHY MARKET FOR CROS, BY COUNTRY, 2018–2025 (USD MILLION)
TABLE 61 EUROPE: MEMBRANE CHROMATOGRAPHY MARKET FOR CROS, BY COUNTRY, 2018–2025 (USD MILLION)
TABLE 62 MEMBRANE CHROMATOGRAPHY MARKET FOR ACADEMIC & RESEARCH INSTITUTES, BY REGION, 2018–2025 (USD MILLION)
TABLE 63 NORTH AMERICA: MEMBRANE CHROMATOGRAPHY MARKET FOR ACADEMIC & RESEARCH INSTITUTES, BY COUNTRY, 2018–2025 (USD MILLION)
TABLE 64 EUROPE: MEMBRANE CHROMATOGRAPHY MARKET FOR ACADEMIC & RESEARCH INSTITUTES, BY COUNTRY, 2018–2025 (USD MILLION)
TABLE 65 MEMBRANE CHROMATOGRAPHY MARKET, BY REGION, 2018–2025 (USD MILLION)
TABLE 66 NORTH AMERICA: MEMBRANE CHROMATOGRAPHY MARKET, BY COUNTRY, 2018–2025 (USD MILLION)
TABLE 67 NORTH AMERICA: MEMBRANE CHROMATOGRAPHY MARKET, BY PRODUCT, 2018–2025 (USD MILLION)
TABLE 68 NORTH AMERICA: MEMBRANE CHROMATOGRAPHY CONSUMABLES MARKET, BY TYPE, 2018–2025 (USD MILLION)
TABLE 69 NORTH AMERICA: MEMBRANE ADSORBERS MARKET, BY TECHNIQUE, 2018–2025 (USD MILLION)
TABLE 70 NORTH AMERICA: ION EXCHANGE MEMBRANE CHROMATOGRAPHY MARKET, BY TYPE, 2018–2025 (USD MILLION)
TABLE 71 NORTH AMERICA: MEMBRANE ADSORBERS MARKET, BY OPERATION MODE, 2018–2025 (USD MILLION)
TABLE 72 NORTH AMERICA: MEMBRANE CHROMATOGRAPHY MARKET, BY END USER, 2018–2025 (USD MILLION)
TABLE 73 US: MEMBRANE CHROMATOGRAPHY MARKET, BY PRODUCT, 2018–2025 (USD MILLION)
TABLE 74 US: MEMBRANE CHROMATOGRAPHY CONSUMABLES MARKET, BY TYPE, 2018–2025 (USD MILLION)
TABLE 75 US: MEMBRANE ADSORBERS MARKET, BY TECHNIQUE, 2018–2025 (USD MILLION)
TABLE 76 US: ION EXCHANGE MEMBRANE CHROMATOGRAPHY MARKET, BY TYPE, 2018–2025 (USD MILLION)
TABLE 77 US: MEMBRANE ADSORBERS MARKET, BY OPERATION MODE, 2018–2025 (USD MILLION)
TABLE 78 US: MEMBRANE CHROMATOGRAPHY MARKET, BY END USER, 2018–2025 (USD MILLION)
TABLE 79 CANADA: MEMBRANE CHROMATOGRAPHY MARKET, BY PRODUCT, 2018–2025 (USD MILLION)
TABLE 80 CANADA: MEMBRANE CHROMATOGRAPHY CONSUMABLES MARKET, BY TYPE, 2018–2025 (USD MILLION)
TABLE 81 CANADA: MEMBRANE ADSORBERS MARKET, BY TECHNIQUE, 2018–2025 (USD MILLION)
TABLE 82 CANADA: ION EXCHANGE MEMBRANE CHROMATOGRAPHY MARKET, BY TYPE, 2018–2025 (USD MILLION)
TABLE 83 CANADA: MEMBRANE ADSORBERS MARKET, BY OPERATION MODE, 2018–2025 (USD MILLION)
TABLE 84 CANADA: MEMBRANE CHROMATOGRAPHY MARKET, BY END USER, 2018–2025 (USD MILLION)
TABLE 85 EUROPE: MEMBRANE CHROMATOGRAPHY MARKET, BY COUNTRY, 2018–2025 (USD MILLION)
TABLE 86 EUROPE: MEMBRANE CHROMATOGRAPHY MARKET, BY PRODUCT, 2018–2025 (USD MILLION)
TABLE 87 EUROPE: MEMBRANE CHROMATOGRAPHY CONSUMABLES MARKET, BY TYPE, 2018–2025 (USD MILLION)
TABLE 88 EUROPE: MEMBRANE ADSORBERS MARKET, BY TECHNIQUE, 2018–2025 (USD MILLION)
TABLE 89 EUROPE: ION EXCHANGE MEMBRANE CHROMATOGRAPHY MARKET, BY TYPE, 2018–2025 (USD MILLION)
TABLE 90 EUROPE: MEMBRANE ADSORBERS MARKET, BY OPERATION MODE, 2018–2025 (USD MILLION)
TABLE 91 EUROPE: MEMBRANE CHROMATOGRAPHY MARKET, BY END USER, 2018–2025 (USD MILLION)
TABLE 92 GERMANY: MEMBRANE CHROMATOGRAPHY MARKET, BY PRODUCT, 2018–2025 (USD MILLION)
TABLE 93 GERMANY: MEMBRANE CHROMATOGRAPHY CONSUMABLES MARKET, BY TYPE, 2018–2025 (USD MILLION)
TABLE 94 GERMANY: MEMBRANE ADSORBERS MARKET, BY TECHNIQUE, 2018–2025 (USD MILLION)
TABLE 95 GERMANY: ION EXCHANGE MEMBRANE CHROMATOGRAPHY MARKET, BY TYPE, 2018–2025 (USD MILLION)
TABLE 96 GERMANY: MEMBRANE ADSORBERS MARKET, BY OPERATION MODE, 2018–2025 (USD MILLION)
TABLE 97 GERMANY: MEMBRANE CHROMATOGRAPHY MARKET, BY END USER, 2018–2025 (USD MILLION)
TABLE 98 UK: MEMBRANE CHROMATOGRAPHY MARKET, BY PRODUCT, 2018–2025 (USD MILLION)
TABLE 99 UK: MEMBRANE CHROMATOGRAPHY CONSUMABLES MARKET, BY TYPE, 2018–2025 (USD MILLION)
TABLE 100 UK: MEMBRANE ADSORBERS MARKET, BY TECHNIQUE, 2018–2025 (USD MILLION)
TABLE 101 UK: ION EXCHANGE MEMBRANE CHROMATOGRAPHY MARKET, BY TYPE, 2018–2025 (USD MILLION)
TABLE 102 UK: MEMBRANE ADSORBERS MARKET, BY OPERATION MODE, 2018–2025 (USD MILLION)
TABLE 103 UK: MEMBRANE CHROMATOGRAPHY MARKET, BY END USER, 2018–2025 (USD MILLION)
TABLE 104 FRANCE: MEMBRANE CHROMATOGRAPHY MARKET, BY PRODUCT, 2018–2025 (USD MILLION)
TABLE 105 FRANCE: MEMBRANE CHROMATOGRAPHY CONSUMABLES MARKET, BY TYPE, 2018–2025 (USD MILLION)
TABLE 106 FRANCE: MEMBRANE ADSORBERS MARKET, BY TECHNIQUE, 2018–2025 (USD MILLION)
TABLE 107 FRANCE: ION EXCHANGE MEMBRANE CHROMATOGRAPHY MARKET, BY TYPE, 2018–2025 (USD MILLION)
TABLE 108 FRANCE: MEMBRANE ADSORBERS MARKET, BY OPERATION MODE, 2018–2025 (USD MILLION)
TABLE 109 FRANCE: MEMBRANE CHROMATOGRAPHY MARKET, BY END USER, 2018–2025 (USD MILLION)
TABLE 110 ROE: MEMBRANE CHROMATOGRAPHY MARKET, BY PRODUCT, 2018–2025 (USD MILLION)
TABLE 111 ROE: MEMBRANE CHROMATOGRAPHY CONSUMABLES MARKET, BY TYPE, 2018–2025 (USD MILLION)
TABLE 112 ROE: MEMBRANE ADSORBERS MARKET, BY TECHNIQUE, 2018–2025 (USD MILLION)
TABLE 113 ROE: ION EXCHANGE MEMBRANE CHROMATOGRAPHY MARKET, BY TYPE, 2018–2025 (USD MILLION)
TABLE 114 ROE: MEMBRANE ADSORBERS MARKET, BY OPERATION MODE, 2018–2025 (USD MILLION)
TABLE 115 ROE: MEMBRANE CHROMATOGRAPHY MARKET, BY END USER, 2018–2025 (USD MILLION)
TABLE 116 ASIA PACIFIC: MEMBRANE CHROMATOGRAPHY MARKET, BY PRODUCT, 2018–2025 (USD MILLION)
TABLE 117 ASIA PACIFIC: MEMBRANE CHROMATOGRAPHY CONSUMABLES MARKET, BY TYPE, 2018–2025 (USD MILLION)
TABLE 118 ASIA PACIFIC: MEMBRANE ADSORBERS MARKET, BY TECHNIQUE, 2018–2025 (USD MILLION)
TABLE 119 ASIA PACIFIC: ION EXCHANGE MEMBRANE CHROMATOGRAPHY MARKET, BY TYPE, 2018–2025 (USD MILLION)
TABLE 120 ASIA PACIFIC: MEMBRANE ADSORBERS MARKET, BY OPERATION MODE, 2018–2025 (USD MILLION)
TABLE 121 ASIA PACIFIC: MEMBRANE CHROMATOGRAPHY MARKET, BY END USER, 2018–2025 (USD MILLION)
TABLE 122 ASIA PACIFIC: MEMBRANE CHROMATOGRAPHY MARKET, BY COUNTRY, 2018–2025 (USD MILLION)
TABLE 123 CHINA: MEMBRANE CHROMATOGRAPHY MARKET, BY PRODUCT, 2018–2025 (USD MILLION)
TABLE 124 CHINA: MEMBRANE CHROMATOGRAPHY CONSUMABLES MARKET, BY TYPE, 2018–2025 (USD MILLION)
TABLE 125 INDIA: MEMBRANE CHROMATOGRAPHY MARKET, BY PRODUCT, 2018–2025 (USD MILLION)
TABLE 126 INDIA: MEMBRANE CHROMATOGRAPHY CONSUMABLES MARKET, BY TYPE, 2018–2025 (USD MILLION)
TABLE 127 JAPAN: MEMBRANE CHROMATOGRAPHY MARKET, BY PRODUCT, 2018–2025 (USD MILLION)
TABLE 128 JAPAN: MEMBRANE CHROMATOGRAPHY CONSUMABLES MARKET, BY TYPE, 2018–2025 (USD MILLION)
TABLE 129 ROAPAC: MEMBRANE CHROMATOGRAPHY MARKET, BY PRODUCT, 2018–2025 (USD MILLION)
TABLE 130 ROAPAC: MEMBRANE CHROMATOGRAPHY CONSUMABLES MARKET, BY TYPE, 2018–2025 (USD MILLION)
TABLE 131 ROW: MEMBRANE CHROMATOGRAPHY MARKET, BY PRODUCT, 2018–2025 (USD MILLION)
TABLE 132 ROW: MEMBRANE CHROMATOGRAPHY CONSUMABLES MARKET, BY TYPE, 2018–2025 (USD MILLION)
TABLE 133 ROW: MEMBRANE ADSORBERS MARKET, BY TECHNIQUE, 2018–2025 (USD MILLION)
TABLE 134 ROW: ION EXCHANGE MEMBRANE CHROMATOGRAPHY MARKET, BY TYPE, 2018–2025 (USD MILLION)
TABLE 135 ROW: MEMBRANE ADSORBERS MARKET, BY OPERATION MODE, 2018–2025 (USD MILLION)
TABLE 136 ROW: MEMBRANE CHROMATOGRAPHY MARKET, BY END USER, 2018–2025 (USD MILLION)


LIST OF FIGURES (33 FIGURES)

FIGURE 1 MEMBRANE CHROMATOGRAPHY MARKET SIZE IS EXPECTED TO DECLINE DURING 2020−2022, COMPARED WITH THE PREVIOUS ESTIMATES OF THIS MARKET
FIGURE 2 BREAKDOWN OF PRIMARIES: MEMBRANE CHROMATOGRAPHY MARKET
FIGURE 3 DATA TRIANGULATION METHODOLOGY
FIGURE 4 MARKET SIZE ESTIMATION: APPROACH 1 (REVENUE-BASED ESTIMATION), 2019
FIGURE 5 MARKET SIZE ESTIMATION: APPROACH 2 (MNM REPOSITORY ANALYSIS-BASED ESTIMATION), 2019
FIGURE 6 MEMBRANE CHROMATOGRAPHY MARKET SIZE ESTIMATION, 2019
FIGURE 7 MEMBRANE CHROMATOGRAPHY MARKET: CAGR PROJECTIONS
FIGURE 8 MEMBRANE CHROMATOGRAPHY MARKET SHARE, BY PRODUCT, 2019
FIGURE 9 MEMBRANE ADSORBERS MARKET, BY TECHNIQUE, 2020−2025
FIGURE 10 MEMBRANE ADSORBERS MARKET SHARE, BY OPERATION MODE, 2019
FIGURE 11 MEMBRANE CHROMATOGRAPHY MARKET, BY END USER, 2020 VS. 2025 (USD MILLION)
FIGURE 12 GEOGRAPHICAL SNAPSHOT OF THE MEMBRANE CHROMATOGRAPHY MARKET
FIGURE 13 BENEFITS OFFERED BY MEMBRANE CHROMATOGRAPHY TO SUPPORT MARKET GROWTH
FIGURE 14 CONSUMABLES SEGMENT ACCOUNTED FOR THE LARGEST SHARE OF THE NORTH AMERICAN MEMBRANE CHROMATOGRAPHY MARKET IN 2019
FIGURE 15 PHARMACEUTICAL & BIOPHARMACEUTICAL COMPANIES SEGMENT ACCOUNTED FOR THE LARGEST MARKET SHARE IN 2019
FIGURE 16 FLOW-THROUGH MEMBRANE CHROMATOGRAPHY SEGMENT WILL CONTINUE TO DOMINATE THE MARKET IN 2025
FIGURE 17 ASIA PACIFIC MARKET TO REGISTER THE HIGHEST GROWTH IN THE MEMBRANE CHROMATOGRAPHY MARKET FROM 2020 TO 2025
FIGURE 18 MEMBRANE CHROMATOGRAPHY MARKET: DRIVERS, RESTRAINTS, OPPORTUNITIES, AND CHALLENGES
FIGURE 19 GLOBAL R&D INVESTMENTS BY PHARMACEUTICAL & BIOTECHNOLOGY COMPANIES, 2010−2024 (USD BILLION)
FIGURE 20 PORTER’S FIVE FORCES ANALYSIS (2019)
FIGURE 21 VALUE CHAIN ANALYSIS OF MEMBRANE CHROMATOGRAPHY: R&D AND MANUFACTURING PHASES ADD MAXIMUM VALUE
FIGURE 22 MEMBRANE CHROMATOGRAPHY MARKET, BY REGION, 2020 VS. 2025 ( USD MILLION)
FIGURE 23 NORTH AMERICA: MEMBRANE CHROMATOGRAPHY MARKET SNAPSHOT
FIGURE 24 ASIA PACIFIC: MEMBRANE CHROMATOGRAPHY MARKET SNAPSHOT
FIGURE 25 MARKET EVALUATION FRAMEWORK
FIGURE 26 MARKET SHARE ANALYSIS: 2019. VS 2020
FIGURE 27 GLOBAL MEMBRANE CHROMATOGRAPHY MARKET: COMPANY EVALUATION MATRIX, 2019
FIGURE 28 SARTORIUS AG: COMPANY SNAPSHOT (2019)
FIGURE 29 DANAHER CORPORATION: COMPANY SNAPSHOT (2019)
FIGURE 30 MERCK MILLIPORE: COMPANY SNAPSHOT (2019)
FIGURE 31 THERMO FISHER SCIENTIFIC: COMPANY SNAPSHOT (2019)
FIGURE 32 3M COMPANY: COMPANY SNAPSHOT (2019)
FIGURE 33 ASAHI KASEI CORPORATION: COMPANY SNAPSHOT (2019)

The study involved two major activities in estimating the current size of the membrane chromatography market. Exhaustive research was conducted to collect information on the market as well as its peer and parent markets. The next step was to validate these findings, assumptions, and sizing estimates with industry experts across the value chain through primary research. Both revenue-based and product-based estimation approaches were employed to estimate the complete market size. After that, market breakdown and data triangulation procedures were used to estimate the size of the segments and subsegments.

Secondary Research

The secondary sources referred to for this research study include publications from government sources, such as World Health Organization (WHO), US Food and Drug Administration (FDA), Chinese American Chromatography Association, Chromatography Institute of America, International Separation Science Society, National Institutes of Health (NIH), Pharmaceutical Research and Manufacturers of America (PhRMA), Organisation for Economic Co-operation and Development (OECD), European Federation of Pharmaceutical Industries and Associations, World Health Organization (WHO), and National Center for Biotechnology Information (NCBI). Secondary sources also include corporate and regulatory filings (such as annual reports, SEC filings, investor presentations, and financial statements); business magazines and research journals; press releases; and trade, business, and professional associations, among others. Secondary data was collected and analyzed to arrive at the overall size of the global membrane chromatography market, which was validated through primary research.

Primary Research

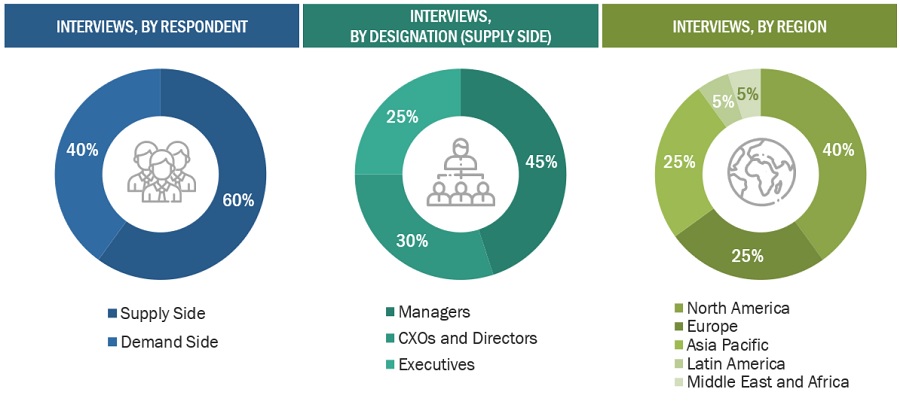
The membrane chromatography market comprises several stakeholders such as manufacturers and distributors of membrane chromatography products, third-party suppliers of chromatography products, pharmaceutical and biotechnology companies, contract manufacturing companies (CMOs), contract research organizations (CROs), market research and consulting firms, and R&D centers. Several primary interviews were conducted from the demand side (personnel from pharmaceutical and biotechnology companies and academic and research institutes, and purchase managers in healthcare provider organizations) and supply side (such as C-level and D-level executives, product managers, and marketing and sales managers of key manufacturers, distributors, and channel partners, among others) across four major regions—North America, Europe, Asia Pacific, and the Rest of the World. Approximately 70% and 30% of primary interviews were conducted with supply-side and demand-side participants, respectively. This primary data was collected through questionnaires, e-mails, online surveys, personal interviews, and telephonic interviews.

Membrane Chromatography Market Size, and Share

To know about the assumptions considered for the study, download the pdf brochure

Market Size Estimation

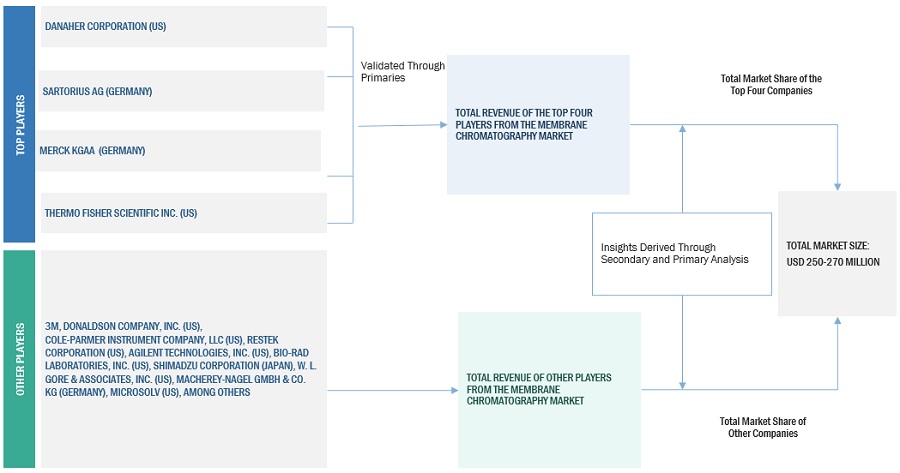
For calculating the global market value, segmental revenues were arrived at based on the revenue mapping of major players active in the membrane chromatography market. This process involved the following steps:

  • Generating a list of the major global players operating in the membrane chromatography market
  • Mapping the annual revenues generated by major global players from the membrane chromatography segment (or the nearest reported business unit/product category)
  • Estimating the revenue of the top players to cover at least 90–95% of the global market share, as of 2019
  • Calculating 100% of the global market value of membrane chromatography based on 90-95% revenue share of the top three players

Data Triangulation

After arriving at the overall market size—using the market size estimation processes explained above, the market was split into several segments and subsegments. To complete the overall market engineering process and arrive at the exact statistics of each market segment and subsegment, data triangulation and market breakdown procedures were employed, wherever applicable. The data was triangulated by studying various factors and trends from both the demand and supply sides of the membrane chromatography market.

Report Objectives

  • To define, describe, segment, and forecast the membrane chromatography market on the basis of product, technique, operation mode, end user, and region
  • To provide detailed information about the factors influencing market growth, such as drivers, restraints, opportunities, and challenges
  • To strategically analyze micromarkets1 with respect to individual growth trends, prospects, and contributions to the overall membrane chromatography market
  • To analyze market opportunities for stakeholders and provide details of the competitive landscape for key players

Available Customizations

With the given market data, MarketsandMarkets offers customizations as per the company’s specific needs. The following customization options are available for the report:

Product Analysis

  • Product matrix, which gives a detailed comparison of the product portfolios of the top five companies

Geographic Analysis

  • Further breakdown of the RoW membrane chromatography market into Latin America and the Middle East & Africa
  • Further breakdown of the European membrane chromatography market into Spain and Italy

Company Information

  • Detailed analysis and profiling of additional market players (Up to 5)
Custom Market Research Services

We will customize the research for you, in case the report listed above does not meet with your exact requirements. Our custom research will comprehensively cover the business information you require to help you arrive at strategic and profitable business decisions.

Request Customization

Instant Answers with GPT - Ask Now!

Ask real questions. Get complete answers !
Report Code
BT 6006
Published ON
Jun, 2020
Choose License Type
BUY NOW
  • SHARE
X
Request Customization
Speak to Analyst
Speak to Analyst
OR FACE-TO-FACE MEETING
PERSONALIZE THIS RESEARCH
  • Triangulate with your Own Data
  • Get Data as per your Format and Definition
  • Gain a Deeper Dive on a Specific Application, Geography, Customer or Competitor
  • Any level of Personalization
REQUEST A FREE CUSTOMIZATION
LET US HELP YOU!
  • What are the Known and Unknown Adjacencies Impacting the Membrane Chromatography Market
  • What will your New Revenue Sources be?
  • Who will be your Top Customer; what will make them switch?
  • Defend your Market Share or Win Competitors
  • Get a Scorecard for Target Partners
CUSTOMIZED WORKSHOP REQUEST
+1-888-600-6441
  • Call Us
  • +1-888-600-6441 (Corporate office hours)
  • +1-888-600-6441 (US/Can toll free)
  • +44-800-368-9399 (UK office hours)
CONNECT WITH US
ABOUT TRUST ONLINE
©2024 MarketsandMarkets Research Private Ltd. All rights reserved
DMCA.com Protection Status Website Feedback