
Microcars Market

Microcars Market by Category (Kei Cars, A00, Neighborhood Electric Vehicles, Quadricycles), Power Output (<5, 5-25, 26-40, >40 kW), End-use Application, Kei Cars and Quadricycles (Propulsion and Classification), and Region - Global Forecast to 2032


OVERVIEW
Source: Secondary Research, Interviews with Experts, MarketsandMarkets Analysis
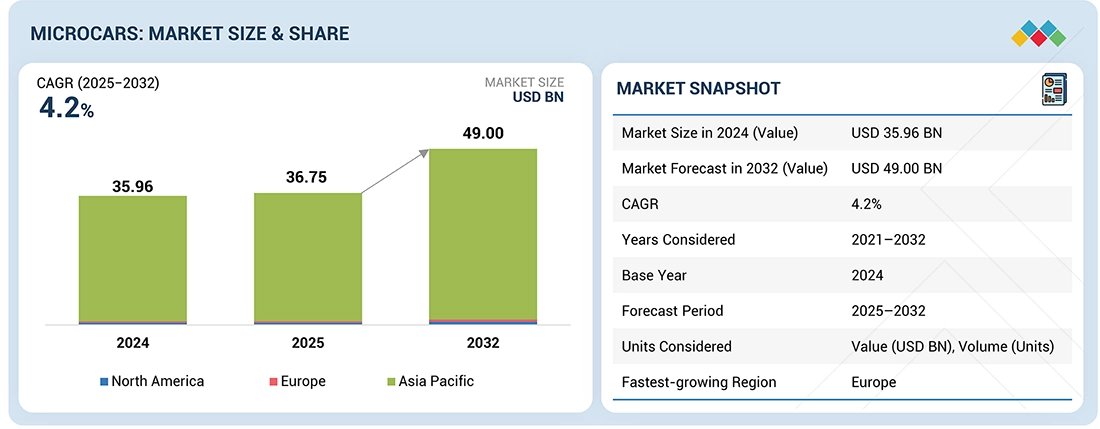
The Microcars market is projected to reach USD 49.00 billion by 2032, from USD 36.75 billion in 2025, at a CAGR of 4.2% during the forecast period. The microcar market is growing as a result of electrification and strategic city mobility challenges. With their smaller battery packs, they are an economical way to enter EVs, complementing tighter EU CO2 regulations and LEV incentives. OEMs are tapping microcars for shared mobility and last-mile logistics, while modular platform creation facilitates fast, profitable launches.
Market Size and Forecast:
- Market Size Value in 2025: USD 36.75 Billion
- Revenue Forecast in 2032: USD 49.00 Billion
- Growth Rate: CAGR of 4.2% from 2025 to 2035
- Data available from 2021 to 2032
- Base year: 2024
- Forecast period: 2025–2035
Key Market Trends and Insights
- Market Growth: Growth is driven by increasing urbanization, rising traffic congestion, growing demand for affordable mobility solutions, and the need for compact vehicles in densely populated cities.
-
Technology Impact: Advancements in electric powertrains, lightweight materials, battery technologies, and connected vehicle systems are improving vehicle efficiency, safety, and user convenience.
- Growing Trends: The market is witnessing increased adoption of electric microcars, shared mobility services, smart urban transportation solutions, and low-emission city vehicles.
- Growth Opportunities: Opportunities are driven by supportive government policies for sustainable mobility, expansion of EV charging infrastructure, increasing demand for last-mile transportation, and growing adoption across emerging economies.
KEY TAKEAWAYS
-
BY POWER OUTPUT40 KW will lead the global microcars market as they balance urban efficiency and performance needs with entry-level A00 & Kei Cars. These higher-output vehicles allow for quicker acceleration, better hill-climbing abilities, and compatibility with advanced comfort and safety features like air conditioning, regenerative braking, and ADAS.
-
BY CATEGORYKei cars are estimated to dominate the global microcar market because they combine affordability, compact design, and regulatory requirements in the Japanese market, making them ideal for congested urban environments. Their proven success in Japan, versatility for personal and commercial use, and growing electrification potential give them a more potent edge in the microcars market.
-
BY END USE APPLICATIONPersonal use will be the primary application of microcars because urban commuters increasingly seek affordable, compact, and eco-friendly vehicles for short daily trips. Their low ownership costs, ease of parking, and suitability for crowded city environments make them more attractive for individuals than for niche fleet or commercial purposes.
-
BY PROPULSIONElectric microcars will lead the global microcar market. A00 category vehicles were fully electric by 2022. Demand for hybrid electric Kei cars is rising in Japan, and most quadricycles sold in Europe are electric driven.
-
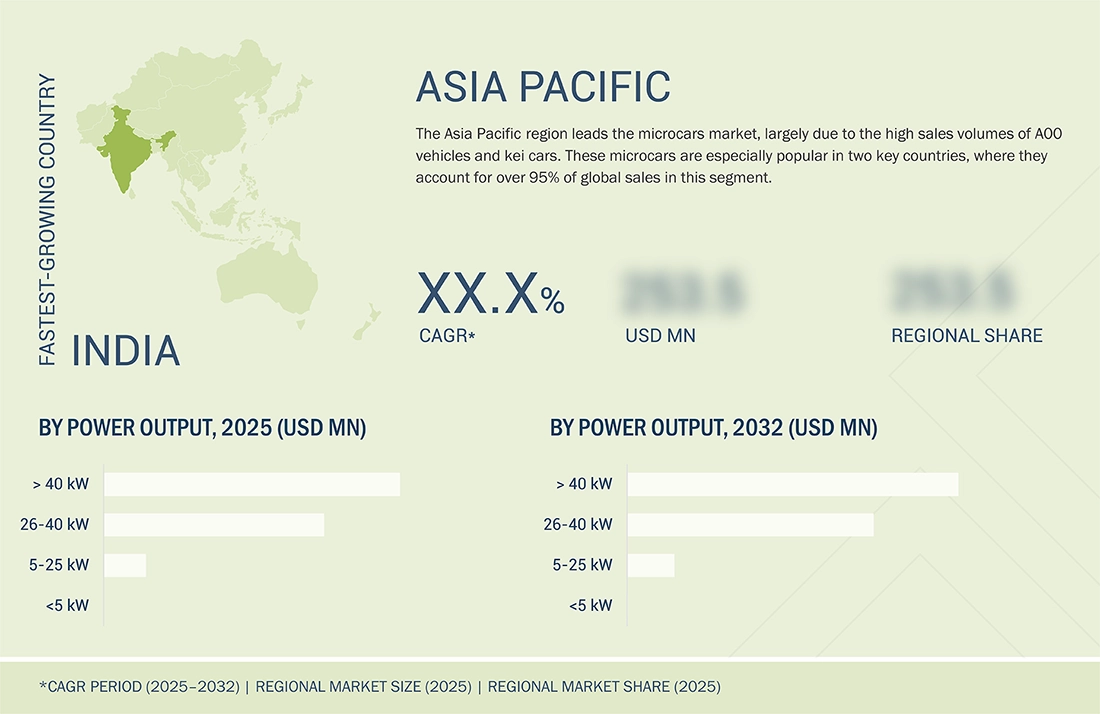
BY REGIONAsia Pacific is estimated to dominate the global market in terms of volume and value.
-
COMPETITIVE LANDSCAPEThe major market players have adopted both organic and inorganic strategies, including partnerships and investments. For instance, in May 2024, Suzuki Motor Corporation invested in Glydways, Inc., which is developing an on-demand Personal Rapid Transit (PRT) system using small electric vehicles that operate autonomously in dedicated lanes.
The microcar market is expanding, fueled by electrification costs and shifting urban mobility patterns. Smaller battery packs make microcars an affordable entry point into electric vehicles, helping meet stricter EU CO2 rules and taking advantage of LEV incentives. Automakers are increasingly using them for shared mobility and last-mile delivery, while modular platforms allow for quicker and more profitable product launches.
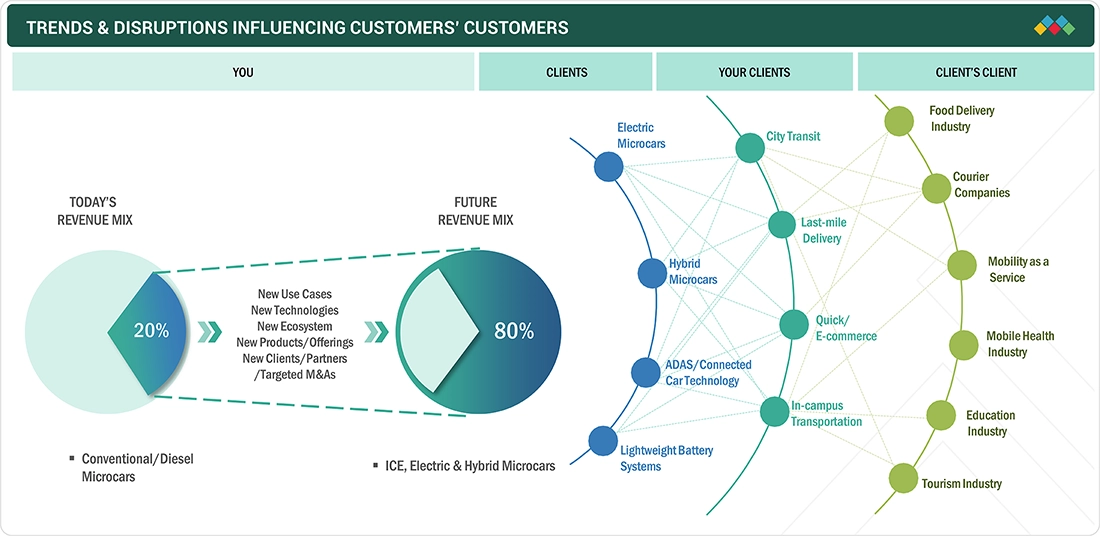
TRENDS & DISRUPTIONS IMPACTING CUSTOMERS' CUSTOMERS
The microcar market is undergoing a transformation driven by shifts in technology, mobility trends, and customer expectations. While current revenue is mostly generated by ICE microcars, the next 4–5 years will see a reversal as electric, hybrid, and connected microcars will gain traction. OEMs are focusing on new business models around city travel, shared mobility, and last-mile delivery, while component providers are prioritizing electrified powertrains with higher efficiency. In the coming years, mobility as a service and food & courier delivery industries will be the major users of microcars for future mobility.
Source: Secondary Research, Interviews with Experts, MarketsandMarkets Analysis
MARKET DYNAMICS
Level
-
Rapid Urbanization

-
Ongoing developments in electric vehicle charging infrastructure

Level
-
Limited adoption in emerging economies due to high costs

Level
-
Advancements in connected car and related technologies

-
Surge in demand for last-mile delivery

Level
-
Consumer skepticism regarding safety and reliability

Source: Secondary Research, Interviews with Experts, MarketsandMarkets Analysis
Driver: Rapid urbanization
Rapid urbanization is a key driver of the microcars market, as the escalating density of urban populations necessitates the adoption of compact vehicles capable of maneuvering in constrained environments and addressing acute parking shortages. Microcars, characterized by their small size and fuel efficiency, are specifically engineered to meet the challenges posed by urban settings. Currently, over 50% of the global population, approximately 4.4 billion individuals, reside in urban areas (Source: World Bank). This trend is likely to persist, with projections indicating that by 2025, the urban population may exceed 70% of the global population. This shift toward increased urban density will likely catalyze demand for compact vehicles, driven by the critical limitations in parking space availability in metropolitan regions.
Restraint: Limited adoption in emerging economies
Microcars offer several benefits, such as practicality, lightweight design, and easy handling. However, their adoption remains limited in emerging economies. The price of a microcar starts at around USD 6,000 and can go up to USD 22,000. According to the International Monetary Fund (IMF), the GDP per capita, measured in purchasing power parity (PPP), is about USD 11,900 in emerging economies like India. Industry experts believe microcars could become popular in the country’s urban and semi-rural commuting areas. Still, the price will be a key factor in determining their popularity in cost-sensitive markets. Additionally, the cost of alternatives to mobility, such as used small cars starting at nearly USD 2,000, which offer more space and comfort than microcars, limits the adoption of microcars in these markets.
Opportunity: Advancements in connected cars and other related technologies
Connected vehicles, active width adjustment, and drive-by-wire are key technologies that improve microcar performance and user experience. Connected vehicle technology allows communication between vehicles and infrastructure, enhancing traffic management and safety. Carly Car Subscription Pty Ltd. (Australia) partnered with INVERS GmbH (Germany) to integrate real-time tracking and efficient fleet management for electric microcars like the Microlino, supporting urban mobility through car sharing. Another popular technology in the microcars market is drive-by-wire, which replaces traditional mechanical linkages with electronic controls, providing excellent maneuverability and responsiveness, especially in busy city environments. Wings EV (India) used this technology in its Robin microcar, combining efficiency with the agility of a motorbike. As technological advancements continue to boost urban mobility and convenience, the demand for microcars is expected to grow during the forecast period.
Challenge: Consumer skepticism related to safety of microcars
The widespread consumer skepticism about the safety of microcars challenges their market growth. This doubt mainly comes from worries over their build quality and the perceived affordability compared to traditional vehicles. In Europe, microcars, classified as quadricycles, are subject to less strict safety regulations, which exempt them from the rigorous crash test standards that regular passenger vehicles must pass. This regulatory difference fuels a general feeling of insecurity about their safety, hindering their expansion in global markets.
Microcars Market: COMMERCIAL USE CASES ACROSS INDUSTRIES
| COMPANY | USE CASE DESCRIPTION | BENEFITS |
|---|---|---|
 |
Honda has launched a new business unit called Fastport to build a zero-emission electric quadricycle (eQuad) for last-mile logistics. The eQuad is meant for urban deliveries, designed to fit in bike lanes and use swappable batteries and software-defined features, with a “Fleet-as-a-Service” model for customers. | It reduces emissions and congestion in dense urban zones, lowers costs over conventional delivery vans, allows operators to monitor and manage fleets via cloud dashboards, and adapts cargo/size options for varying regional needs. |
 |
INVERS microcars are being integrated into carsharing/shared mobility services to provide an intermediate mobility option between e-scooters and full cars. They examine design, operational, regulatory, and sharing suitability aspects of microcars in urban fleets. | Microcars enable shared mobility providers to deliver car-like comfort at reduced costs and footprint, with improved parking and space efficiency, lower energy use, and possibly fewer licensing restrictions. |
Logos and trademarks shown above are the property of their respective owners. Their use here is for informational and illustrative purposes only.
MARKET ECOSYSTEM
The microcar market ecosystem is built on strong collaboration across component suppliers, vehicle manufacturers, and end users. Component manufacturers such as HELLA, Magna, LG Energy Solution, and BYD are driving advancements in batteries, electric powertrains, and lightweight components. These technologies enable leading microcar OEMs such as SGMW (China), Suzuki (Japan), Renault (France) and BYD (China) to develop compact, efficient, and sustainable vehicles. End users such as Amazon, Uber Eats, DHL, and FedEx are increasingly adopting these microcars for last-mile delivery and urban logistics.
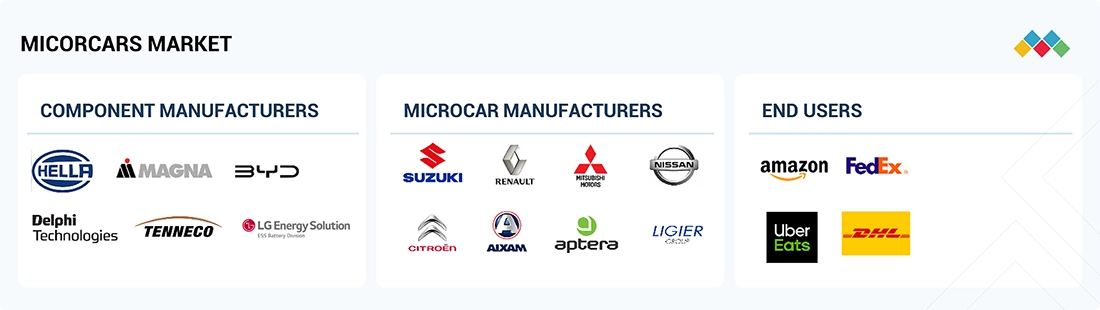
Logos and trademarks shown above are the property of their respective owners. Their use here is for informational and illustrative purposes only.
MARKET SEGMENTS
Source: Secondary Research, Interviews with Experts, MarketsandMarkets Analysis
Microcars Market, By Power Output
The 40 kW segment is anticipated to hold the largest market share in terms of power output. The increasing demand for high-power microcars propels growth within this segment. Despite their compact size, these vehicles possess power outputs comparable to traditional hatchbacks and sedans. They also provide the highest load-carrying capacity within the microcar category. China and Japan exhibit the highest demand for vehicles exceeding 40 kW. In China, BYD Auto Co., Ltd. offers the BYD Seagull, which falls within this power output range. It was the leading vehicle in sales in China, with approximately 0.45 million units sold in 2024. The Japanese market predominantly features microcars with power outputs of 38 kW and 47 kW, depending on whether the vehicle is turbocharged or non-turbocharged. Consumers show a preference for turbocharged variants, as they deliver additional power at an extra cost of approximately USD 1.5-2 thousand.
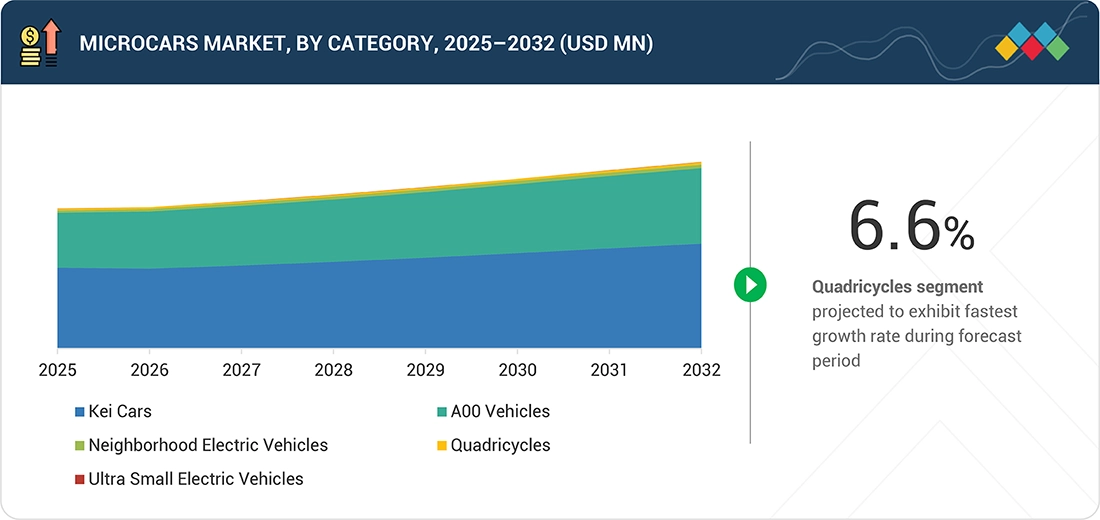
Microcars Market, By Category
Kei cars dominate the global microcars market by category in terms of value. They are offered with internal combustion engine (ICE), electric, and hybrid propulsion options, and are available in 2WD and 4WD configurations. The growing adoption of hybrid Kei cars in Japan is closely linked to the country’s unique geographical challenges. Japan is prone to frequent seismic activity, which significantly impacts both residential and commercial infrastructure, including charging stations. This vulnerability has led Japanese automakers to prioritize hybrid technology over fully electric solutions. Leading Japanese OEMs, such as Honda Motor Co., Ltd., Suzuki Motor Corporation, Toyota Motor Corporation, and Mitsubishi Motors Co., Ltd., have made substantial advancements in hybrid technology. These companies continue to innovate to improve hybrid systems, serving both domestic markets and international ones.
Microcars Market, By End-use Application
Personal end-use application is expected to dominate the market during the forecast period. Microcars are short, compact, and provide better options for short-distance commutes, as well as being able to park in small spaces. Most microcars used in China and Japan are primarily for short-distance travel and urban commuting; they serve as second vehicles for families, especially in city areas. Additionally, in Europe and the US, NEVs and quadricycles are more popular for personal use, mainly for city travel where parking is limited. Moreover, in Europe, license-accessible options for drivers over 16 years old drive the adoption of microcars among younger people.
Microcars Market, By Propulsion
Electric and hybrid microcars are considered to be dominant in the market. Chinese A00 vehicles achieved full electrification in 2022, and there has been an increase in demand for hybrid Kei cars in Japan. In Europe, electric quadricycles are dominating the market, while in the US, microcars are cars offered under the neighborhood electric vehicles category with 100% electrification. These factors are estimated to propel the market demand for electric and hybrid microcars.
REGION
Americas to be largest region in global heavy equipment telematics market during forecast period
The Asia Pacific region dominates the global microcar market, mainly due to high demand for Chinese A00 vehicles and Japanese Kei cars. Their lower initial and operating costs remain key factors driving growth in this market. China and Japan together make up over 99% of the region’s market value, with Japan holding 64.1% and China 35.8%. In China, market growth has been supported by improvements in charging infrastructure, with A00 vehicles shifting to fully electric models since 2022. Meanwhile, the popularity of Kei cars in Japan is fueled by ongoing hybrid technology advancements from Honda Motor Co., Ltd. (Japan), Suzuki Motor Corporation (Japan), and Mitsubishi (Japan). Leading microcar manufacturers in the region include SAIC-GM-Wuling and BYD Auto in China, along with Suzuki, Honda, Daihatsu, Nissan, and Mitsubishi in Japan.
Microcars Market: COMPANY EVALUATION MATRIX
In the microcars market matrix, Suzuki Motor Corporation (Japan) (Star) leads with a strong market presence and a wide product portfolio, driving large-scale adoption across Japan. Beijing Automobile Works (China) (Emerging Leader) is gaining traction in the microcars market by offerings cost-effective and feature rich A00 vehicles in the Chinese market.

Source: Secondary Research, Interviews with Experts, MarketsandMarkets Analysis
KEY MARKET PLAYERS
MARKET SCOPE
| REPORT METRIC | DETAILS |
|---|---|
| Market Size in 2024 (Value) | USD 35.96 Billion |
| Market Forecast in 2032 (Value) | USD 49.00 Billion |
| Growth Rate | 4.2% |
| Years Considered | 2021-2032 |
| Base Year | 2024 |
| Forecast Period | 2025-2032 |
| Units Considered | Volume (Units), Value (USD Million/Billion) |
| Report Coverage | Revenue forecast, regional market share, competitive landscape, growth factors, trends & disruption, and industry-wise penetration |
| Segments Covered |
|
| Regional Scope | Asia Pacific, Europe, North America |
WHAT IS IN IT FOR YOU: Microcars Market REPORT CONTENT GUIDE
DELIVERED CUSTOMIZATIONS
We have successfully delivered the following deep-dive customizations:
| CLIENT REQUEST | CUSTOMIZATION DELIVERED | VALUE ADDS |
|---|---|---|
| Urban Mobility Startup (Germany) |
|
|
| Automotive OEM (Japan) |
|
|
RECENT DEVELOPMENTS
- Jan-25 : Daihatsu Motor Co., Ltd. unveiled the Mira e:S GR Sport Concept at the Tokyo Auto Salon 2025. The vehicle is equipped with a 660cc engine and is expected to deliver 63 HP of power.
- September 2024 : Suzuki Motor Corporation introduced the Suzuki Spacia Gear high-roof wagon-style kei car on September 20, 2024. The new model features water-repellent seats, dirt-resistant luggage floors, and roof rails.
- September 2024 : Honda Motor Co., Ltd. introduced the N-Box Joy in September 2024. This vehicle represents an enhanced edition of the N-Box, specifically tailored for camping purposes. Furthermore, the vehicle provides a 4WD option.
- May 2024 : Suzuki Motor Corporation introduced the Suzuki Hustler Tough Wild in May 2024. The vehicle is an enhanced version of the Suzuki Hustler, featuring standard LED headlamps, 360° premium UV and IR cut glass, and is available in a turbocharged model as well.
- November 2023 : SAIC-GM-Wuling (SGMW) launched the third generation of Wuling Hongguang EV Macaron in the Chinese market. The car was priced at around USD 6,400. The car has a cruising range of 215 km and a top speed of 100km/hr.
Table of Contents
 Exclusive indicates content/data unique to MarketsandMarkets and not available with any competitors.
Methodology
The study encompassed four primary tasks to determine the present and future scope of the microcars market. Initially, extensive secondary research was conducted to gather data on the market, its related sectors, and overarching industries. Subsequently, primary research involving industry experts across the supply chain corroborated and validated these findings and assumptions. The complete market size was estimated by using both top-down and bottom-up methodologies. Following this, a market breakdown and data triangulation approach were utilized to determine the size of specific segments and subsegments within the market.
Secondary Research
The secondary sources referred to were the company's annual reports/presentations, industry association publications, directories, technical handbooks, World Economic Outlook, technical articles, and databases, which were used to identify and collect information for an extensive study of the microcars market. The secondary sources used while estimating the market sizing are the Japan Automobile Manufacturers Association, China Association of Automobile Manufacturers, and corporate filings (such as annual reports, investor presentations, and financial statements). Secondary data was collected and analyzed to determine the overall market size, further validated through primary research. The primary sources—experts from related industries and OEMs—were interviewed to obtain and verify critical information and assess prospects and market estimations. Historical sales data was collected and analyzed, and the industry trend was considered to arrive at the forecast, which was further validated by primary research.
Primary Research
In the primary research process, various primary sources from both the supply and demand sides were interviewed to obtain qualitative and quantitative information on the market. The primary sources from the supply side included various industry experts, such as CXOs, vice presidents, directors from business development, marketing, product development/innovation teams, and related key executives from various key companies. Various system integrators, industry associations, independent consultants/industry veterans, and key opinion leaders were also interviewed.
Primary interviews were conducted to gather insights such as sizing estimates on the microcars market and forecast, future technology trends, and upcoming technologies in the microcars market. Data triangulation of all these points was done using the information gathered from secondary research and model mapping. Stakeholders from the demand and supply sides were interviewed to understand their views on the abovementioned points.

Note 1: Others include sales managers, marketing managers, and product managers.
Note 2: Tier 1 companies’ revenues are more than USD 10 billion; tier 2 companies’ revenues range between USD 1 and 10 billion; and tier 3 companies’ revenues range between USD 500 million and USD 1 billion.
Source: Industry Experts
To know about the assumptions considered for the study, download the pdf brochure
Market Size Estimation
As mentioned below, a detailed market estimation approach was followed to estimate and validate the value of the microcars market and other dependent submarkets.
- The bottom-up approach was used to estimate and validate the microcars market size. The microcars market size, by power output and by country, was derived by mapping the historical sales of different microcars at the country level. These data points were largely fetched from country-level associations, paid repositories, and OEM data excerpts. The sales forecast for microcar categories was based on factors such as country-wise macroeconomic indicators, emission regulations, automotive industry growth, GDP growth, growth in urbanization, growth in the share mobility business, and government initiatives. The market size, by value, was derived by multiplying the microcar-wise average selling price with the respective sales volumes of vehicles calculated in units. Each country’s/region’s total volume and value were then summed up to reveal the total volume of the global microcars market for each power output segment. The data was validated through primary interviews with industry experts.
- The market data gathered was consolidated, enhanced with detailed inputs, analyzed, and presented in this report.
Microcars Market : Top-Down and Bottom-Up Approach

Data Triangulation
All percentage shares, splits, and breakdowns were determined using secondary sources and verified by primary sources. All parameters that affect the markets covered in this research study were accounted for, viewed in extensive detail, and analyzed to obtain the final quantitative and qualitative data. This data was consolidated and enhanced with detailed inputs and analysis from MarketsandMarkets and presented in the report.
Market Definition
- Kei cars: According to the Japan Automobile Standards Internationalization Centre, Kei cars are also referred to as Japanese city cars, ultra mini cars, or Japanese microcars. They are the smallest highway-legal passenger cars with restricted dimensions and engine capacity.
- Ultra microelectric cars: Ultra microelectric cars are a class of enclosed vehicles that are smaller than conventional cars. Microelectric cars or new energy vehicles (NEVs), also known as micro EVs, are small electric vehicles that are designed for short-range travel in urban areas. Micro EVs can often be categorized as quadricycles or tricycles, depending on the number of wheels.
- A00 cars: A00 category cars in China refer to micro-sized passenger vehicles, primarily electric, with a wheelbase of 2.0–2.3 meters and seating for fewer than four passengers. These vehicles are designed for short-distance commuting.
- Neighborhood electric vehicles: According to the US Department of Energy, an NEV is defined as a four-wheeled electric vehicle that has a maximum speed greater than 20 miles per hour (mph) but not more than 25 mph.
- Quadricycles (India): The vehicle should be the size of a three-wheeler but with four tires and fully covered like a car. It has an engine like that of a three-wheeler. It must have a curb weight of < 475 kg and pass safety and crash-test norms and clear emissions tests based on the powertrain.
- Quadricycles (Europe): The European microcars are known as quadricycles and are categorized into L6 and L7 categories. L6 is a light quadricycle, and L7 is a heavy quadricycle. The L6 category cars have four wheels, two seats, and a power output of 6kW. The L7 category cars have four wheels, a maximum of four seats, and a power output of 15kW.
Stakeholders
- Microcar manufacturers
- Tier 1 companies (Component suppliers)
- Battery, motor, and other electric component suppliers
- Rental service providers
- Raw material suppliers for microcar component/system manufacturers
- Consulting companies
- On highway-vehicle safety regulatory bodies
- Government and research institutions
- On-highway associations
Report Objectives
-
To define, describe, and forecast the size of the microcars market in terms of value (USD million) and volume (units) based on
- By category (Kei cars and ultra micro electric vehicles, quadricycles, neighborhood electric vehicles, and A00 vehicles)
- Kei cars and ultra micro electric vehicles by propulsion (ICE and electric/hybrid)
- Quadricycles by propulsion (ICE and electric/hybrid)
- By end-use application (Personal and commercial)
- By power output (Below 5 kW, 5-15 kW, and above 15 kW)
- By Region (Asia, Europe, and North America)
- To understand the market dynamics (drivers, restraints, opportunities, and challenges) of the market
- To analyze the market share of leading players operating in the market and their evaluation matrix
- To strategically analyze the key player strategies and company revenue analysis
-
To study the following with respect to the market
- Trends/Disruptions impacting the microcars market
- Market ecosystem
- Technology analysis
- Supply chain analysis
- Patent analysis
- Regulatory landscape
- Case study analysis
- Key stakeholders and buying criteria
- Key conferences and events
- Pricing analysis by key players and by key regions
- Macroeconomic outlook
- Company valuation and financial metrics
- Brand and product comparison
- OEM analysis
- Market share analysis
- To strategically profile key players and comprehensively analyze their respective market share and core competencies
- To analyze recent developments, including product launches and deals, among others, undertaken by key players in the market
- To understand the dynamics of key players and evaluate the company evaluation matrix
- To analyze the opportunities offered by various market segments to its stakeholders
To provide a brief understanding of the core business segments in the microcars market in the recommendations chapter and how key stakeholders in the business will benefit from the available opportunities
Available Customizations
Microcars Market, by Seating Capacity
- 2-seater
- 4-seater
Note: Each seating capacity will be further analyzed for countries considered under the study scope of the report.
Microcars Market, By Drive Type
- 2WD
- AWD
Note: Each drive type will be further analyzed for countries considered under the study scope of the report.
Key Questions Addressed by the Report
Need a Tailored Report?
Customize this report to your needs
Get 10% FREE Customization
Customize This ReportPersonalize This Research
- Triangulate with your Own Data
- Get Data as per your Format and Definition
- Gain a Deeper Dive on a Specific Application, Geography, Customer or Competitor
- Any level of Personalization
Let Us Help You
- What are the Known and Unknown Adjacencies Impacting the Microcars Market
- What will your New Revenue Sources be?
- Who will be your Top Customer; what will make them switch?
- Defend your Market Share or Win Competitors
- Get a Scorecard for Target Partners

Custom Market Research Services
We Will Customise The Research For You, In Case The Report Listed Above Does Not Meet With Your Requirements
Get 10% Free CustomisationTESTIMONIALS

JIM NAAS
PRODUCT DIRECTOR, WEASLER
Weasler Engineering, a CentroMotion organization
Global Provider of Industrial Actuation & Control Solutionswww.weasler.com
Our organization was interested in learning more about the attractiveness of a particular market space. We contacted MarketsandMarkets to help us based on previous positive experiences we had with them. The results did not disappoint! We discussed our objectives with them, and the team at MarketsandMarkets developed and executed a proposal that met our needs precisely. We were very impressed by their level of expertise, the quality of the analysis and their insightful recommendations. We would not hesitate in working with them again in the future.

Matt Kardel,
Vice President
Aptiv,
A global technology company that develops safer, greener and more connected solutions.www.aptiv.com
We contracted with
MarketsandMarkets to evaluate the value chain and potential go-to-market partners related to our
interest in the Fleet Management space. The team successfully completed the work on time and at the
pricing agreed. MarketsandMarkets listened and understood our objectives and collaborated well with
us to help us get the visibility we needed to make an investment.
We have subsequently used
MarketsandMarkets again related to Smart Cities to good results.


Growth opportunities and latent adjacency in Microcars Market