
Modular UPS Market

Modular UPS Market by Technology (Double conversion online UPS, Line Interactive UPS), Phase Type (Three Phase UPS, Single Phase UPS), Voltage (100V-250V, 250-480V, 480-1000V, >1000V), Power Capacity, Form Factor, Battery Type - Global Forecast to 2030


OVERVIEW
Source: Secondary Research, Interviews with Experts, MarketsandMarkets Analysis
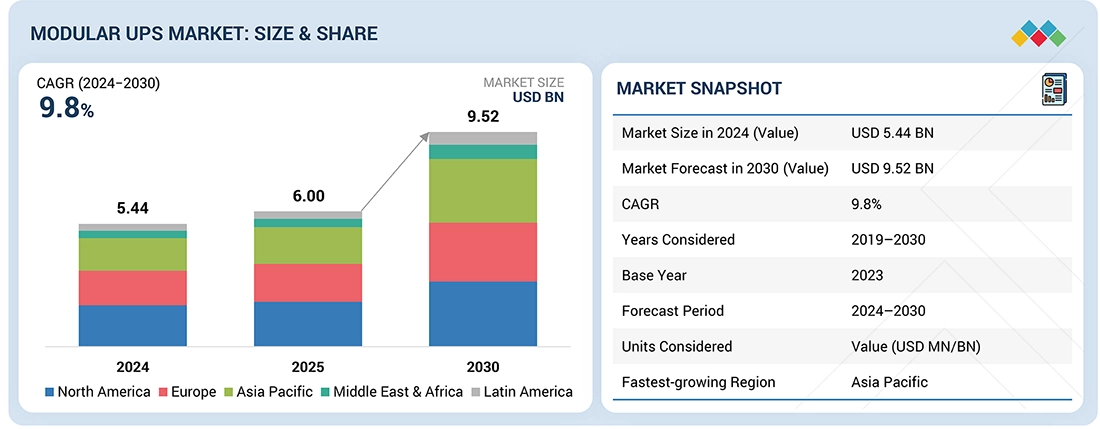
The global modular UPS market is expected to grow substantially, projected to rise from USD 5.44 billion in 2024 to USD 9.52 billion by 2030, reflecting a CAGR of 9.8%. This surge is driven by escalating demand for scalable, energy-efficient, and high-availability power solutions across mission-critical environments. Modular UPS systems are increasingly adopted in data centers, edge computing facilities, industrial automation setups, and enterprise IT infrastructures, where redundancy, load balancing, and hot-swappable modules are essential for maintaining uptime and operational continuity. These systems offer flexible power capacity scaling, reduced footprint, and simplified maintenance, aligning with the evolving needs of digital transformation, Industry 4.0, and hybrid cloud deployments.
Market Size and Forecast:
- Market Size Value in 2024: USD 5.44 Billion
- Market Size Value in 2025 : USD 6.00 Billion
- Revenue Forecast in 2031: USD 9.52 Billion
- Growth Rate: CAGR of 9.8 % from 2025 to 2030
- Data available from 2019 to 2030
- Base year: 2023
- Forecast period: 2024-2030
- Largest Growing Region: North America
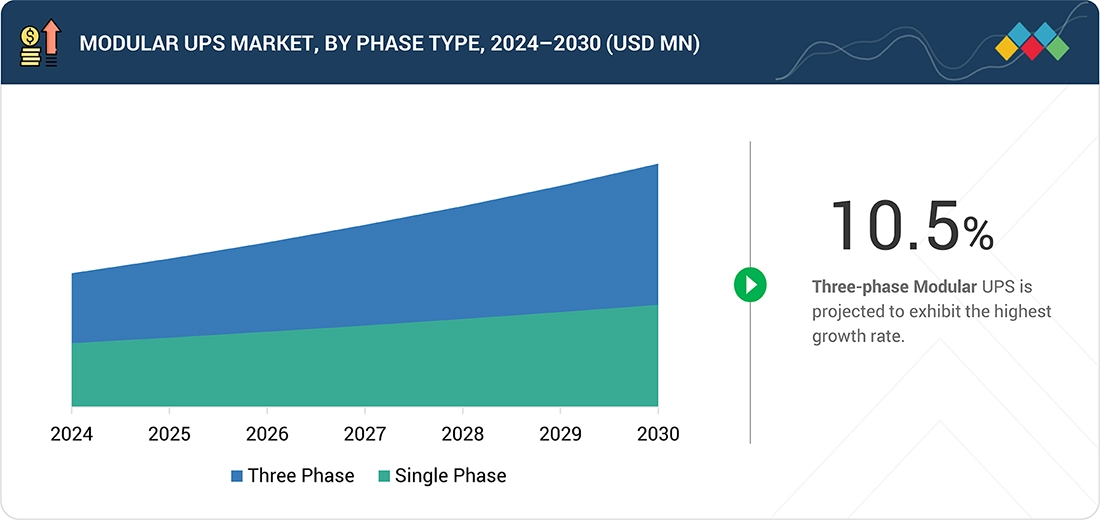
- The Modular UPS Three-phase modular segment growing at a CAGR of 10.5 %
KEY TAKEAWAYS
-
BY COMPONENTSolutions dominate adoption, driven by demand for customizable, scalable UPS architectures that align with dynamic load requirements and evolving IT infrastructure. Services—including remote monitoring, predictive maintenance, and performance optimization—are critical for ensuring long-term reliability and generating recurring revenue streams for vendors.
-
BY PHASEThree-phase modular UPS systems are preferred for high-capacity loads, particularly in large-scale industrial facilities and enterprise-grade data centers, offering enhanced power stability, load balancing, and energy efficiency.
-
BY BATTERY TYPELithium-ion batteries are gaining traction due to their high energy density, longer lifecycle, and compact footprint, ideal for space-constrained environments and AI-intensive workloads. Lead-acid batteries remain relevant for cost-sensitive deployments and traditional infrastructure, offering a balance of affordability and reliability.
-
BY END-USERData centers lead modular UPS adoption, driven by the need for 24/7 uptime, scalable power redundancy, and support for cloud, edge, and AI workloads.
-
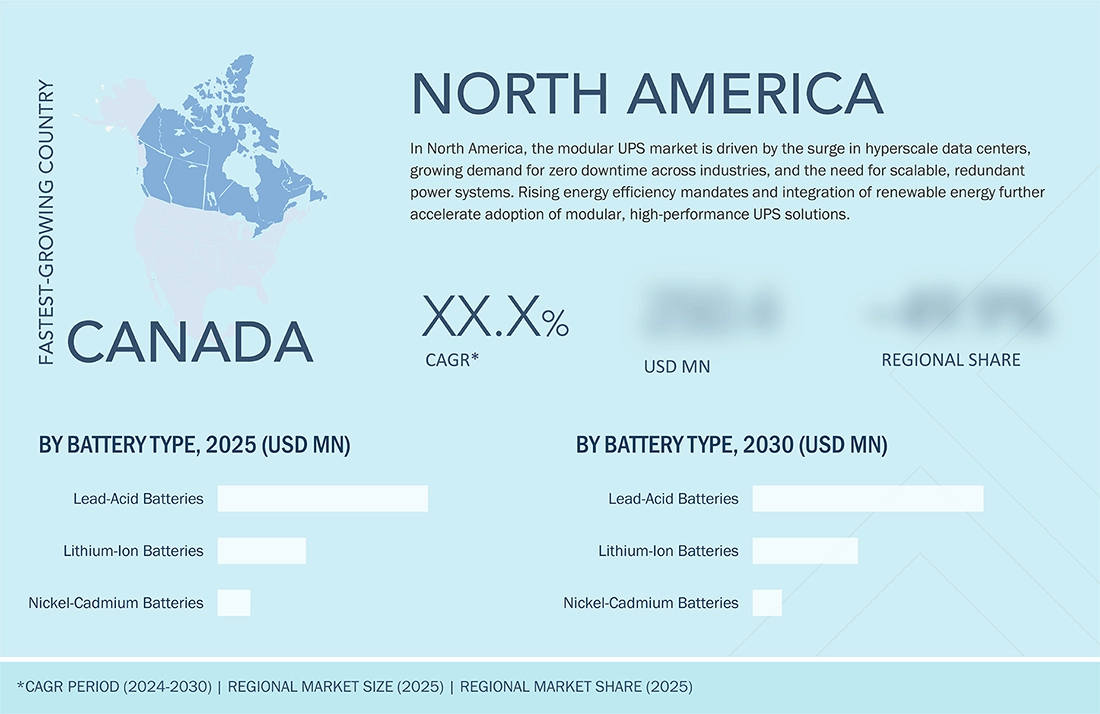
BY REGIONNorth America is the dominant market, propelled by hyperscale data center expansion, enterprise IT investments, and stringent uptime SLAs. The United States leads growth, with major cloud providers, colocation operators, and AI infrastructure developers investing in modular, energy-efficient UPS solutions to ensure business continuity and sustainable operations.
-
COMPETITIVE LANDSCAPELeading vendors such as Huawei (China), Schneider Electric (France), and ABB (Switzerland) are leveraging strategic partnerships, technology alliances, and R&D investments to expand their modular UPS portfolios. These initiatives aim to deliver next-gen power backup solutions that meet the evolving needs of data centers, industrial automation, and smart infrastructure worldwide.
The accelerating development of smart cities, industrial automation, and hyperscale data centers is fueling demand for reliable, scalable, and energy-efficient power infrastructure. Modular UPS (uninterruptible power supply) systems are emerging as a cornerstone of modern power continuity strategies, offering flexible capacity expansion, hot-swappable modules, and fault-tolerant architecture to support uninterrupted operations in mission-critical IT and industrial environments.
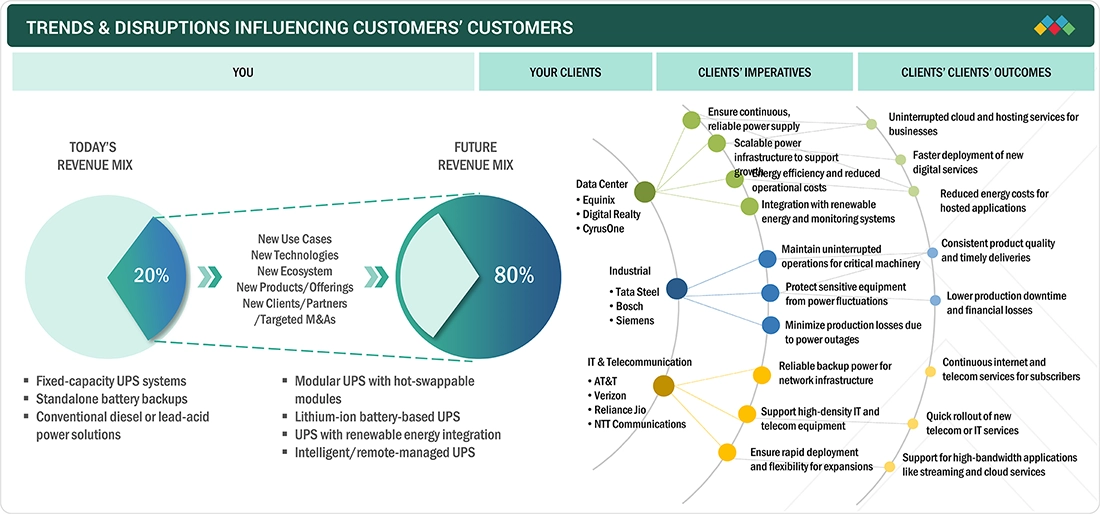
TRENDS & DISRUPTIONS IMPACTING CUSTOMERS' CUSTOMERS
Rising power demand and increasing reliance on digital infrastructure create mounting pressure on enterprises and data centers to ensure uninterrupted operations. Modular UPS systems, supported by scalable architecture, hot-swappable components, advanced monitoring, and efficient battery technologies, help organizations reduce downtime, optimize energy use, and adapt quickly to load changes. These systems lower maintenance costs, extend lifecycle reliability, and improve operational resilience. Shifts in energy regulations, data center expansions, and the adoption of battery technology directly influence these outcomes and drive growth for modular UPS providers.
Source: Secondary Research, Interviews with Experts, MarketsandMarkets Analysis
MARKET DYNAMICS
Level
-
Zero Downtime imperative across industries

-
Global expansion of data centers

Level
-
Availability of alternative backup solutions

Level
-
Growth in high-performance computing (HPC) and AI infrastructure

-
Expansion of EV charging infrastructure

Level
-
Battery lifecycle limitations

-
Competition from conventional backup systems

Source: Secondary Research, Interviews with Experts, MarketsandMarkets Analysis
Driver: Global Expansion of Data Centers
The exponential rise in data center investments—most notably a 168% increase in Europe in 2024 across hubs such as Paris, London, and Frankfurt—is a major catalyst for the adoption of modular UPS systems. Similar expansions in Asia Pacific, North America, and emerging markets are driven by surging cloud computing, AI workloads, and digital transformation initiatives. Modular UPS systems are essential for: Uninterrupted power delivery Voltage stabilization Scalable energy management These features make them ideal for supporting the high-density, high-availability environments of modern data centers.
Restraint: Competing Backup Power Alternatives
The presence of alternate power backup systems—including diesel generators, traditional UPS, and hybrid energy storage solutions—poses a restraint to modular UPS adoption. These alternatives offer: Cost-effective customization High-output reliability Flexible deployment models Organizations with legacy infrastructure or budget constraints may opt for these solutions, especially in non-critical or cost-sensitive environments.
Opportunity:Growth in HPC and AI Infrastructure
The rapid development of high-performance computing (HPC) and AI infrastructure is creating new demand for high-capacity, fault-tolerant power systems. Key trends include: 30% annual increase in electricity use by AI servers vs. 9% for conventional servers GPU clusters and supercomputers requiring stable, scalable power Modular UPS systems are uniquely positioned to support these energy-intensive workloads, offering real-time monitoring, load balancing, and redundant architecture for mission-critical AI and HPC environments.
Challenge:Battery Lifecycle Limitations
Battery longevity remains a challenge for modular UPS systems: VRLA batteries: 3–5 years lifespan Lithium-ion batteries: 8–10 years under optimal conditions Continuous operation in industrial automation, data centers, and smart infrastructure accelerates battery wear, leading to: Frequent replacements Increased maintenance costs Potential downtime risks This impacts long-term ROI and may slow adoption in high-demand sectors unless vendors innovate with next-gen battery chemistries and predictive maintenance solutions.
Modular UPS Market: COMMERCIAL USE CASES ACROSS INDUSTRIES
| COMPANY | USE CASE DESCRIPTION | BENEFITS |
|---|---|---|
 |
Ficolo, a leading data center operator, deployed ABB's DPA UPS system to address challenges in maintaining uninterrupted power, scaling operations, and improving energy efficiency. The solution featured: Hot-swappable modules for zero-downtime maintenance Scalable architecture to support dynamic load growth Integration with renewable energy sources for sustainable operations | Flexible power scalability aligned with workload expansion Lower operational costs through high-efficiency power conversion Continuous uptime with modular redundancy and real-time monitoring |
 |
Faced with space limitations, Converge ICT Solutions Inc. required ultra-reliable power and implemented a Huawei SmartLi UPS solution equipped with intelligent lithium-ion battery systems. This deployment enabled: High-density power delivery in a compact footprint An extended battery lifecycle reducing replacement frequency Modular design for seamless expansion and maintenance | Optimized space utilization for power infrastructure Long-lasting lithium-ion batteries enhancing reliability and sustainability Redundant, scalable power architecture supporting mission-critical workloads |
Logos and trademarks shown above are the property of their respective owners. Their use here is for informational and illustrative purposes only.
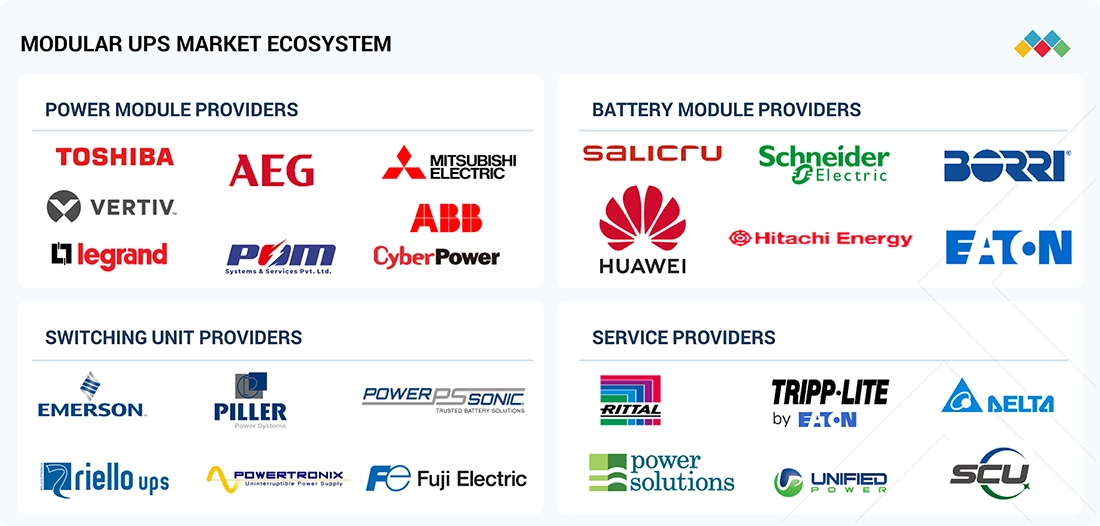
MARKET ECOSYSTEM
Prominent modular UPS market companies include power module providers, battery module providers, switching unit providers, and service providers. These companies offer a broad range of modular UPS components and support services, leveraging advanced technologies and global distribution networks to ensure flexible deployment, operational continuity, and effective maintenance across data centers, industrial environments, and IT systems.
Logos and trademarks shown above are the property of their respective owners. Their use here is for informational and illustrative purposes only.
MARKET SEGMENTS
Source: Secondary Research, Interviews with Experts, MarketsandMarkets Analysis
Modular UPS Market, By Component
The solutions segment is projected to dominate the modular UPS market throughout the forecast period. Enterprises and data centers are increasingly adopting modular UPS solutions due to their scalable and energy-efficient architecture, which features hot-swappable modules that enable zero-downtime maintenance, advanced monitoring & diagnostics, and integration with renewable energy sources. These systems deliver reliable power protection, reduce downtime risks, and support seamless capacity expansion across distributed IT environments and multi-site operations.
Modular UPS Market, By Phase
Three-phase modular UPS systems are expected to register the highest CAGR due to their suitability for high-power applications in hyperscale data centers, industrial manufacturing plants, and telecom hubs. Their features include stable three-phase output for large electrical loads, concurrent maintenance without system shutdown, N+1 and 2N redundancy for mission-critical operations, and scalable capacity to meet growing power demands with consistent delivery.
Modular UPS Market, By Battery Type
Lithium-ion battery-based modular UPS systems are forecasted to grow at the fastest rate, driven by their higher energy density, longer lifecycle (8–10 years), compact form factor for space-constrained environments, and fast-charging capabilities for rapid recovery after an outage. These systems are ideal for high-density data centers, industrial automation, and telecom networks, where uptime, efficiency, and space optimization are critical.
Modular UPS Market, By End-User
The data center segment is expected to hold the largest market share, as modular UPS systems are essential for protecting servers, storage, and networking equipment, supporting high-density rack deployments, and enabling scalable, redundant power architecture Facilitating capacity expansion without service disruption. Integration with cooling systems, DCIM platforms, and energy monitoring tools ensures optimal power utilization, lowers energy costs, and safeguards sensitive workloads—making modular UPS a foundational element for cloud providers, colocation facilities, and enterprise IT environments.
REGION
North America is expected to hold largest market share in the modular UPS market during the forecast period.
North America is experiencing an unprecedented surge in data center development, driven by the rapid growth of AI workloads, cloud computing, and enterprise-wide digital transformation initiatives. In 2024 alone, data center construction supply in top U.S. markets rose by 70%, reaching 3.9 gigawatts; over 500 megawatts of new capacity were added in the first half of the year. The region hit a record-low vacancy rate of 2.8%, underscoring the urgency for resilient power infrastructure. To meet these escalating demands, modular UPS systems are emerging as a critical enabler of scalable power delivery for hyperscale and edge deployments High-efficiency energy management to reduce operational costs and uninterrupted uptime through hot-swappable modules and N+1 redundancy.
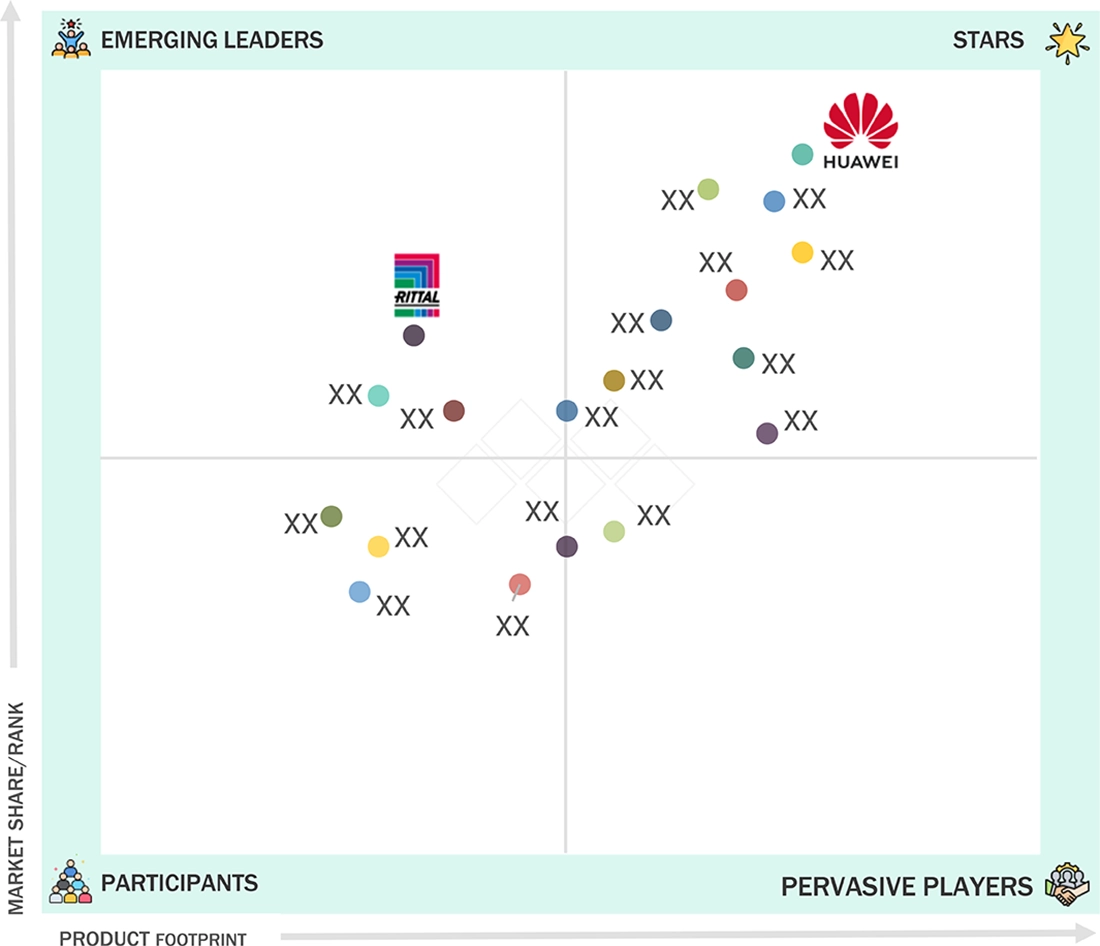
Modular UPS Market: COMPANY EVALUATION MATRIX
Huawei (Star) leads the modular UPS market with a robust global presence, offering integrated high-capacity and smart UPS solutions for data centers and industrial applications. Its scale, innovation in lithium-ion and modular technologies, and extensive service network make it a preferred choice for mission-critical power continuity. Rittal (Emerging Leader) is growing with modular energy solutions and rack-based UPS systems, focusing on flexible deployment and efficient maintenance. While Huawei dominates through breadth and deployment strength, Rittal shows strong potential in specialized, space-optimized UPS applications.
Source: Secondary Research, Interviews with Experts, MarketsandMarkets Analysis
KEY MARKET PLAYERS
MARKET SCOPE
| REPORT METRIC | DETAILS |
|---|---|
| Market Size in 2024 (Value) | USD 5.44 Billion |
| Market Forecast in 2030 (Value) | USD 9.52 Billion |
| Growth Rate | CAGR of 9.8% from 2024-2030 |
| Years Considered | 2019-2030 |
| Base Year | 2023 |
| Forecast Period | 2024-2030 |
| Units Considered | Value (USD Million/Billion) |
| Report Coverage | Revenue forecast, company ranking, competitive landscape, growth factors, and trends |
| Segments Covered | By Component: Solutions, Services I By Power Capacity: Small (up to 100 kW), Medium (101–500 kW), Large (Above 500 kW) I By Voltage: Low-Voltage Modular UPS (100–250 V), Medium-Voltage Modular UPS (251–480 V), High-Voltage Modular UPS (481–1,000 V), Ultra-High-Voltage Modular UPS (>1,000 V) I By Phase Type: Single-Phase UPS, Three-Phase UPS I By Form Factor: Rack-Mounted UPS, Freestanding UPS I By Battery Type: Lead-Acid Batteries, Lithium-Ion Batteries, Nickel-Cadmium Batteries I By Technology Type: Double Conversion Online UPS, Line-Interactive UPS I By End User: BFSI, Data Centers, Healthcare & Life Sciences, IT & Telecom, Government & Defense, Residential, Commercial, Industrial, Other End Users I By Organization Size: Large Enterprises, SMEs |
| Regions Covered | North America, Asia Pacific, Europe, the Middle East & Africa, and Latin America |
WHAT IS IN IT FOR YOU: Modular UPS Market REPORT CONTENT GUIDE
DELIVERED CUSTOMIZATIONS
We have successfully delivered the following deep-dive customizations:
| CLIENT REQUEST | CUSTOMIZATION DELIVERED | VALUE ADDS |
|---|---|---|
| Leading Solution Provider (US) |
|
|
| Leading Solution Provider (EU) | Detailed profiling of additional market players (up to 5 vendors), including product portfolios, strategic initiatives, and regional presence |
|
RECENT DEVELOPMENTS
- October 2024 : Vertiv launched a comprehensive 7MW reference architecture for the NVIDIA GB200 NVL72 platform, co-developed with NVIDIA. This architecture, part of Vertiv's 360AI portfolio, was designed to transform traditional data centers into AI factories supporting enterprise AI applications. Key features included rapid deployment through preconfigured modules, space-efficient power management utilizing the Vertiv Trinergy UPS and EnergyCore lithium batteries, and energy-efficient cooling solutions that offer substantial space and energy savings.
- August 2024 : Huawei partnered with Nigeria’s Galaxy Backbone to deliver the country’s first dual-certified Uptime Tier IV data center in Kano, utilizing its FusionDC1000B prefabricated modular solution. This solution integrates modular UPS, lithium batteries, DCIM, and iCooling to provide rapid, reliable, and scalable digital infrastructure.
- May 2024 : ABB partnered with ZincFive to integrate nickel-zinc (NiZn) batteries into its MegaFlex UPS platform, delivering up to 2.0 MW for mission-critical data centers. The deal enhances sustainability, efficiency, and resilience, targeting colocation, cloud, hyperscale, and AI-powered facilities worldwide.
- August 2024 : Riello UPS has launched its Multi Power2 modular UPS, featuring 67 kW hot-swappable SiC-based modules that deliver up to 98.1% efficiency. Designed for AI-driven, high-density data centers, it offers pay-as-you-grow scalability, reduced TCO, CO2 savings, extended component lifecycle, and superior sustainability performance.
Table of Contents
 Exclusive indicates content/data unique to MarketsandMarkets and not available with any competitors.
Methodology
The study comprised four main activities to estimate the modular UPS market size. We conducted significant secondary research to gather data on the market, the competing market, and the parent market. The following stage involved conducting primary research to confirm these conclusions and hypotheses and sizing with industry experts throughout the value chain. The overall market size was evaluated using a blend of top-down and bottom-up approach methodologies. After that, we estimated the market sizes of the various modular UPS market segments using the market breakup and data triangulation techniques.
Secondary Research
We determined the size of companies offering modular UPS based on secondary data from paid and unpaid sources. We also analyzed major companies' product portfolios and rated them based on their performance and quality.
In the secondary research process, various sources were referred to identify and collect information for this study. Secondary sources included annual reports, press releases, and investor presentations of companies; white papers, journals, and certified publications; and articles from recognized authors, directories, and databases. The data was also collected from other secondary sources, such as journals, government websites, blogs, and vendors' websites. Additionally, the spending of various countries on the modular UPS market was extracted from the respective sources. We used secondary research to obtain the critical information related to the industry's value chain and supply chain to identify the key players based on offering, market classification, and segmentation according to components of the major players, industry trends related to components, users, and regions, and the key developments from both market- and technology-oriented perspectives.
Primary Research
In the primary research process, we interviewed various primary sources from the supply and demand sides of the modular UPS market to obtain qualitative and quantitative information. The primary sources from the supply side included industry experts, such as Chief Executive Officers (CEOs), Vice Presidents (VPs), marketing directors, technology and innovation directors, and related key executives from vendors providing offerings, associated service providers, and operating in the targeted countries. All possible parameters that affect the market covered in this research study have been accounted for, viewed in extensive detail, verified through primary research, and analyzed to arrive at the final quantitative and qualitative data.
After the complete market engineering process (including calculations for market statistics, market breakup, market size estimations, market forecasting, and data triangulation), we conducted extensive primary research to gather information and verify and validate the critical numbers arrived at. The primary research also helped identify and validate the segmentation, industry trends, key players, competitive landscape, and market dynamics, such as drivers, restraints, opportunities, challenges, and key strategies. In the complete market engineering process, the bottom-up approach and several data triangulation methods were extensively used to perform market estimation and market forecasting for the overall market segments and subsegments listed in this report. We conducted an extensive qualitative and quantitative analysis of the complete market engineering process to list the key information/insights throughout the report.

Note 1: Tier 1 companies have revenues greater than USD 10 billion; tier 2 companies' revenues
range between USD 1 and 10 billion; and tier 3 companies' revenues range between USD 500 million
and 1 billion
Note 2: Others include sales, marketing, and product managers.
Source: Secondary Literature, Interviews with Experts, and MarketsandMarkets Analysis
To know about the assumptions considered for the study, download the pdf brochure
Market Size Estimation
Multiple approaches were adopted for estimating and forecasting the web content management market. The first approach involves estimating the market size by companies’ revenue generated through the sale of WCM products.
Market Size Estimation Methodology- Top-down approach
The modular UPS market and related submarkets were estimated and forecasted using top-down and bottom-up methodologies. We used the bottom-up method to determine the market's overall size, using the revenues and product offerings of the major market players. This research ascertained and validated the precise value of the total parent market size through data triangulation techniques and primary interview validation. Next, using percentage splits of the market segments, we utilized the overall market size in the top-down approach to estimate the size of other individual markets.
Modular UPS Market : Top-Down and Bottom-Up Approach

The research methodology used to estimate the market size included the following:
- We used primary and secondary research to determine the revenue contributions of the major market participants in each country after secondary research helped identify them.
- Throughout the process, we obtained critical insights by conducting in-depth interviews with industry professionals, including directors, CEOs, VPs, and marketing executives, and by reading the annual and financial reports of the top firms in the market.
- We used primary sources to verify all percentage splits and breakups, which we calculated using secondary sources.
Data Triangulation
Once the overall market size was determined, we divided the market into segments and subsegments using the previously described market size estimation procedures. When required, market breakdown and data triangulation procedures were employed to complete the market engineering process and specify the exact figures for every market segment and subsegment. The data was triangulated by examining several variables and patterns from government entities' supply and demand sides.
Market Definition
Considering the views of various sources and associations, MarketsandMarkets defines Modular UPS (Uninterruptible Power Supply) as a power backup system designed with a modular architecture, allowing individual components such as power, battery, and control modules to be added or removed as needed. This flexibility enables users to scale the system according to their power requirements, optimize efficiency, and ensure ease of maintenance through hot-swappable modules.
The design enhances adaptability and minimizes downtime, making modular UPS systems especially useful for applications in dynamic environments such as data centers, healthcare facilities, industrial operations, and IT infrastructure. Their scalability, energy efficiency, and fault-tolerant capabilities address the growing need for reliable and customizable power solutions.
Stakeholders
- Modular UPS vendors
- Technology partners
- Consulting firms
- Resellers and distributors
- Enterprise users
- Technology providers
- IT infrastructure equipment providers
- Component providers
- System integrators
- Support service providers
- Consulting service providers
- Cloud service providers
- Data center vendors
- Colocation providers
- Government and standardization bodies
Report Objectives
- To define, describe, and forecast the modular UPS market based on Component (Solutions [Power Modules, Battery Modules, Display Units, Switching Units], Services [Professional Services and Managed Services]), Power Capacity, Voltage, Phase Type, Technology Type, Form Factor, Battery Type, Organization Size, End User, and Region.
- To forecast the market size of the five major regional segments: North America, Europe, Asia Pacific, the Middle East & Africa, and Latin America
- To strategically analyze the market subsegments concerning individual growth trends, prospects, and contributions to the total market
- To provide detailed information related to the significant factors influencing the growth of the market (drivers, restraints, opportunities, and challenges)
- To strategically analyze macro and micro-markets for growth trends, prospects, and their contributions to the overall market
- To analyze industry trends, patents and innovations, and pricing data related to the market
- To analyze the opportunities in the market for stakeholders and provide details of the competitive landscape for major players
- To analyze the impact of AI/GenAI on the modular UPS market
- To profile key players in the market and comprehensively analyze their market share/ranking and core competencies.
- To track and analyze competitive developments, such as mergers & acquisitions, product launches and enhancements, and partnerships & collaborations in the market.
Available Customizations
MarketsandMarkets provides customizations based on the company's unique requirements using market data. The following customization options are available for the report:
Product Analysis
- The product matrix provides a detailed comparison of each company's portfolio.
Geographic Analysis as per Feasibility
- Further breakup of the modular UPS market
Company Information
- Detailed analysis and profiling of five additional market players
Key Questions Addressed by the Report
- Modular UPS vendors
- Technology partners
- Consulting firms
- Resellers and distributors
- Enterprise users
- Technology providers
- IT infrastructure equipment providers
- Component providers
- System integrators
- Support service providers
- Consulting service providers
- Cloud service providers
- Data center vendors
- Colocation providers
- Government and standardization bodies
Need a Tailored Report?
Customize this report to your needs
Get 10% FREE Customization
Customize This ReportPersonalize This Research
- Triangulate with your Own Data
- Get Data as per your Format and Definition
- Gain a Deeper Dive on a Specific Application, Geography, Customer or Competitor
- Any level of Personalization
Let Us Help You
- What are the Known and Unknown Adjacencies Impacting the Modular UPS Market
- What will your New Revenue Sources be?
- Who will be your Top Customer; what will make them switch?
- Defend your Market Share or Win Competitors
- Get a Scorecard for Target Partners

Custom Market Research Services
We Will Customise The Research For You, In Case The Report Listed Above Does Not Meet With Your Requirements
Get 10% Free CustomisationTESTIMONIALS


Growth opportunities and latent adjacency in Modular UPS Market