
Oil Condition Monitoring Market Size, Share & Trends

Oil Condition Monitoring Market by Offering (Oil Analyzers, Oil Sensors, Spectrometers, Viscometers), Oil Sampling Type (On-Site, Off-Site), End Use (Turbines, Compressors, Engines, Hydraulic Systems, Gearboxes, Transformers) - Global Forecast to 2030


OVERVIEW
Source: Secondary Research, Interviews with Experts, MarketsandMarkets Analysis
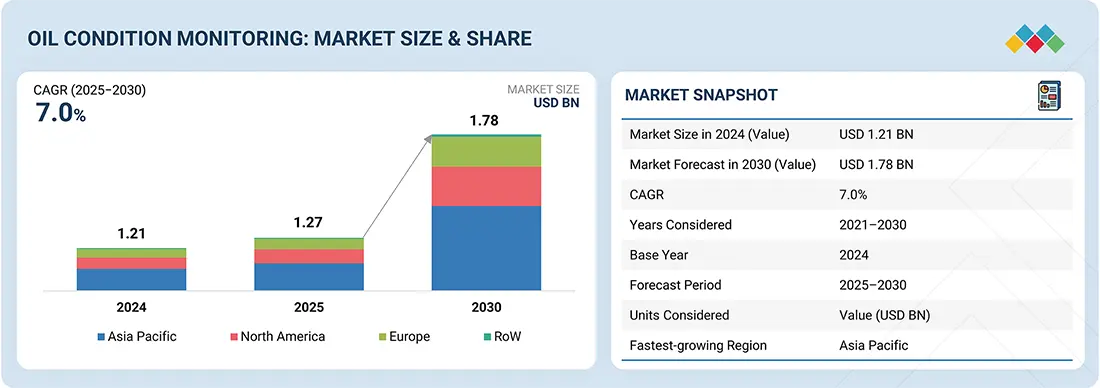
The global oil condition monitoring market is projected to grow from USD 1.27 billion in 2025 to USD 1.78 billion by 2030, registering a CAGR of 7.0%. Oil condition monitoring involves the analysis of lubricants to detect contamination, wear particles, and chemical degradation, ensuring optimal equipment performance and reduced maintenance costs. Its market growth is fuelled by rising adoption of predictive maintenance across industries such as automotive, oil & gas, power generation, and transportation, coupled with integrating advanced technologies, including IoT-enabled sensors and AI-driven analytics to enhance operational reliability.
Market Size & Forecast
KEY TAKEAWAYS
-
BY OFFERINGThe oil condition monitoring market comprises hardware, software, and services. Hardware such as sensors and analyzers plays a central role and holds the largest market share. Technological advancements in hardware components have solidified their market leadership. Software platforms and service offerings are increasingly integrated to deliver predictive insights and optimize maintenance strategies.
-
BY END USEKey end-uses include turbines, compressors, engines, and hydraulic systems, along with other systems such as gear systems, insulating systems, industrial tooling systems, and transformers. End-use industries require oil condition monitoring to ensure equipment reliability and minimize unplanned downtime; as such, manufacturers display a healthy demand for market products.
-
BY INDUSTRYAutomotive & transportation, oil & gas, energy & power, metal & mining, chemicals, food & beverages, and pharmaceuticals are the major industries where oil condition monitoring is used. The automotive and transportation industry is expected to continue being a major contributor, driven by increasing vehicle manufacturing and the demand for predictive maintenance. Other industries, such as pulp & paper and cement, are also contributing to the market expansion.
-
BY REGIONAsia Pacific is projected to record the fastest growth with a CAGR of 8.4%, supported by rapid industrialization, strong demand from automotive and energy sectors, and the increasing adoption of predictive maintenance technologies in countries like China, Japan, and India.
-
COMPETITIVE LANDSCAPELeading players such as Parker Hannifin Corp, Eaton, and TE Connectivity are adopting organic and inorganic growth strategies, including product innovation, partnerships, and investments, to expand their footprint and meet rising demand for oil condition monitoring solutions across industries.
The oil condition monitoring market is projected to grow steadily over the next decade, driven by the rising demand for predictive maintenance and the need to minimize equipment downtime. Adopting IoT sensors, AI-based analytics, and real-time monitoring solutions is enhancing maintenance efficiency, making OCM a critical tool for improving equipment reliability, extending asset life, and reducing operational costs across industries.
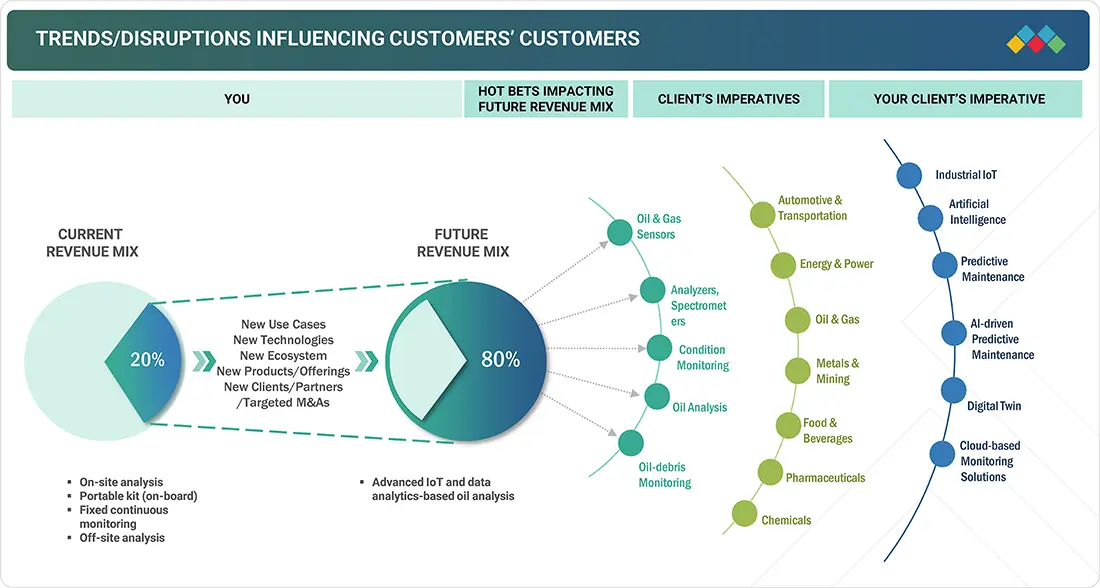
TRENDS & DISRUPTIONS IMPACTING CUSTOMERS' CUSTOMERS
The impact on consumers' business in the oil condition monitoring market emerges from evolving customer trends and industry disruptions. Equipment operators and asset-intensive industries are the primary clients of OCM solution providers, and critical machinery applications represent the target focus areas. Shifts such as the adoption of predictive maintenance, digital monitoring technologies, and stricter compliance requirements directly affect the revenues of end users. These revenue impacts on end users, which in turn, influence the demand for OCM systems and services, ultimately driving the growth trajectory of oil condition monitoring providers.
Source: Secondary Research, Interviews with Experts, MarketsandMarkets Analysis
MARKET DYNAMICS
Level
-
Increasing requirement for cost-efficient strategies to maintain equipment health

-
Growing awareness about value of oil condition monitoring

Level
-
Deficit of expertise in managing data analysis and software systems

-
Rising expenses for modernizing current systems

Level
-
Adoption of big data analytics and IIoT

-
Integration of AI-powered diagnostics for real-time insights

Level
-
Adaptation to harsh operating environments

-
Offline oil sampling limitations

Source: Secondary Research, Interviews with Experts, MarketsandMarkets Analysis
Driver: Increasing requirement for cost-efficient strategies to maintain equipment health
The oil condition monitoring market is driven by rising demand for economical solutions that ensure machinery reliability and longevity. Unlike traditional preventive practices that lead to unnecessary oil changes and downtime, OCM enables predictive and condition-based maintenance, helping reduce breakdowns, optimize oil usage, and extend equipment life. Adoption is robust in capital-intensive sectors such as power generation, oil & gas, transportation, and manufacturing, where minimizing downtime translates directly into cost savings.
Restraint: Deficit of expertise in managing data analysis and software systems
The oil condition monitoring market faces limitations due to the shortage of skilled professionals for managing complex data and software platforms. OCM solutions generate large volumes of information that require expertise in interpretation and system operation. The lack of technical talent often leads to underutilization, delayed maintenance decisions, and reduced efficiency, restricting wider adoption of advanced OCM technologies.
Opportunity: Integration of AI-powered diagnostics for real-time insights
Adopting AI-powered diagnostics in oil condition monitoring enables real-time analysis of machinery health by detecting anomalies, predicting failures, and recommending maintenance actions. This supports the shift toward predictive maintenance, helping reduce downtime, extend equipment life, and lower costs while enhancing reliability across manufacturing, power generation, and renewable energy sectors.
Challenge: Offline oil sampling limitations
Offline oil sampling is labor-intensive, time-consuming, and prone to human error, offering only periodic insights into lubricant health. Unlike real-time monitoring, it delays detection of issues such as contamination or wear, leading to higher maintenance costs and reduced efficiency, limiting its appeal for proactive maintenance strategies.
Oil Condition Monitoring Market: COMMERCIAL USE CASES ACROSS INDUSTRIES
| COMPANY | USE CASE DESCRIPTION | BENEFITS |
|---|---|---|
 |
Fluid condition sensor and on-site test kits for monitoring oil quality, moisture, temperature, and dilution | Real-time oil analysis, reduced downtime, elimination of routine testing, improved asset reliability |
 |
GreaseCheck and Wear Debris sensors to detect contamination, water content, and particulate matter in lubricants | Extended bearing life, reduced lubrication costs, early detection of gearbox damage, optimized maintenance |
 |
Optical particle and oil humidity sensors for real-time monitoring of oil cleanliness and humidity in hydraulic systems | Early detection of contamination, prevention of moisture-related failures, robust performance in harsh conditions |
 |
OPS3 multiparametric oil quality sensors measuring viscosity, density, and dielectric constant for predictive maintenance | Reliable performance in high-pressure environments, optimized maintenance scheduling, improved operational safety |
 |
Aerospace oil condition and debris monitoring sensors integrated in engine and transmission systems | Real-time detection of oxidation and debris, reduced reliance on offline sampling, enhanced reliability of aircraft systems |
Logos and trademarks shown above are the property of their respective owners. Their use here is for informational and illustrative purposes only.
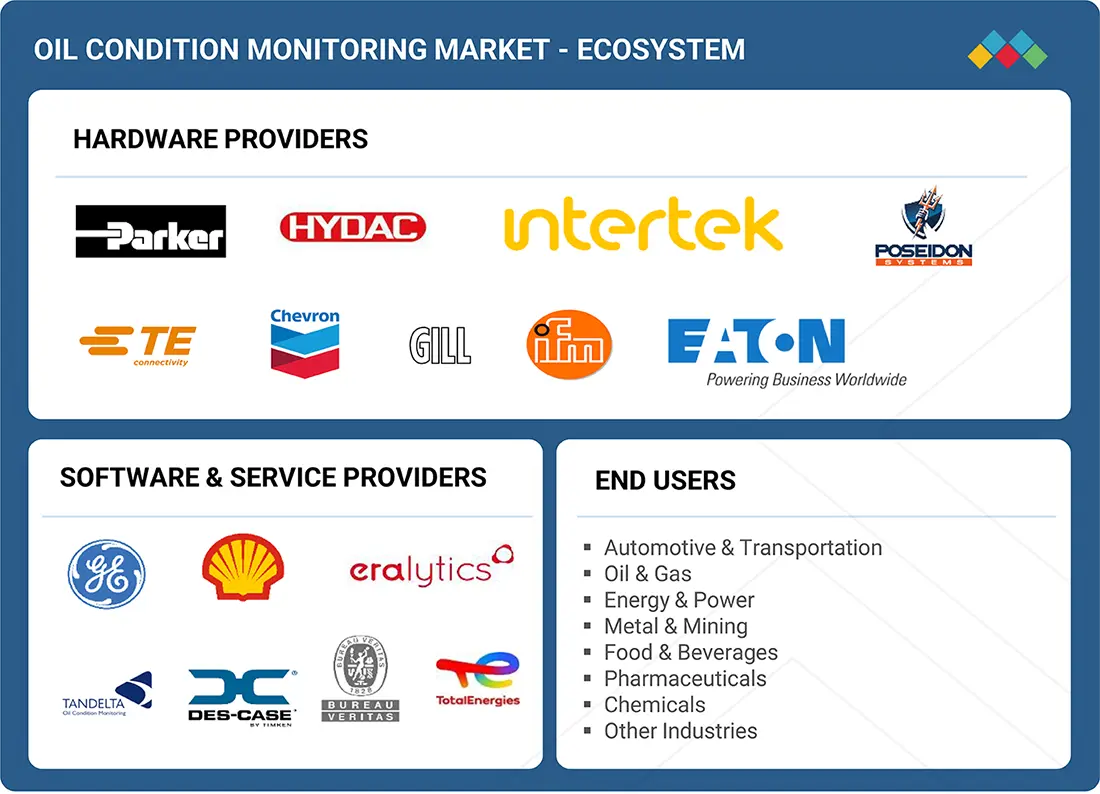
MARKET ECOSYSTEM
The oil condition monitoring ecosystem involves equipment providers, software and service providers, and end users across multiple industries. Equipment providers deliver sensors, analyzers, and monitoring devices to track oil quality, contamination, and wear. Software and service providers enable advanced diagnostics, data analytics, and predictive maintenance capabilities. End users in sectors such as automotive & transportation, oil & gas, energy & power, metal & mining, food & beverages, pharmaceuticals, and chemicals adopt OCM solutions to reduce downtime, extend asset life, and optimize operational efficiency.
Logos and trademarks shown above are the property of their respective owners. Their use here is for informational and illustrative purposes only.
MARKET SEGMENTS
Source: Secondary Research, Interviews with Experts, MarketsandMarkets Analysis
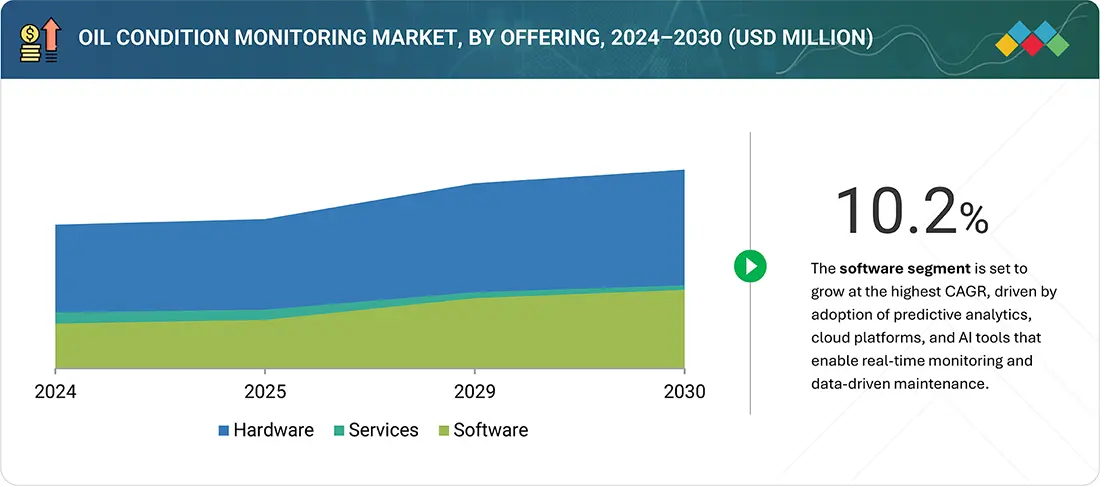
Oil Condition Monitoring Market, By Offering
The hardware segment held the largest market share in 2024, as sensors, analyzers, and test kits form the backbone of oil condition monitoring systems. Their ability to deliver precise, real-time insights on oil quality, contamination, and wear drives industry adoption. Continuous sensor technology advancements and IoT platform integration further reinforce hardware's dominance.
Oil Condition Monitoring Market, By End Use
Engines accounted for a significant market share in 2024, with oil condition monitoring helping detect wear particles, fuel dilution, and lubricant degradation. These insights are critical to ensure efficiency, reduce unplanned downtime, and extend engine life. Growing adoption in automotive, marine, and industrial engines strengthens this segment's role in driving OCM demand.
Oil Condition Monitoring Market, By Industry
The automotive & transportation sector is projected to remain a key contributor, supported by rising vehicle production, expanding commercial fleets, and the need for predictive maintenance. OCM enables real-time monitoring of lubricants in engines and transmissions, lowering maintenance costs and improving fuel efficiency. The shift toward connected vehicles and digital fleet management further accelerates adoption.
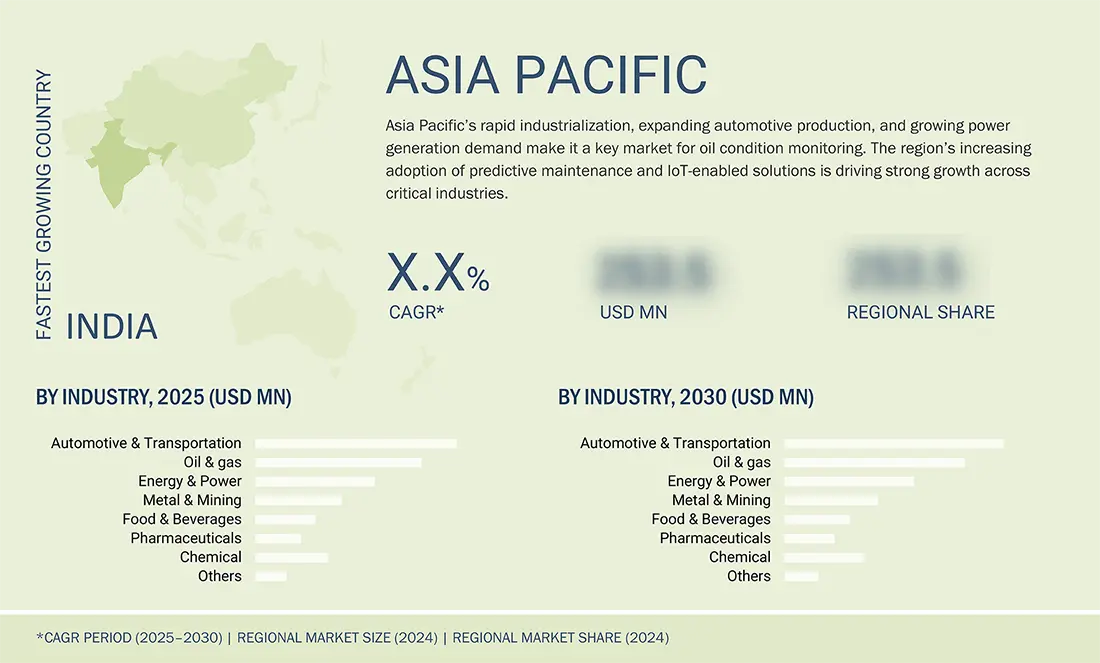
REGION
Asia Pacific is expected to be the fastest-growing region in the global oil condition monitoring market during the forecast period
Asia Pacific is projected to be the fastest-growing market for oil condition monitoring, supported by rapid industrialization, expansion of automotive and power generation sectors, and rising focus on predictive maintenance practices. Increasing investment in smart manufacturing and adopting IoT-enabled monitoring solutions in countries like China, India, and Japan further strengthens the region's growth outlook.
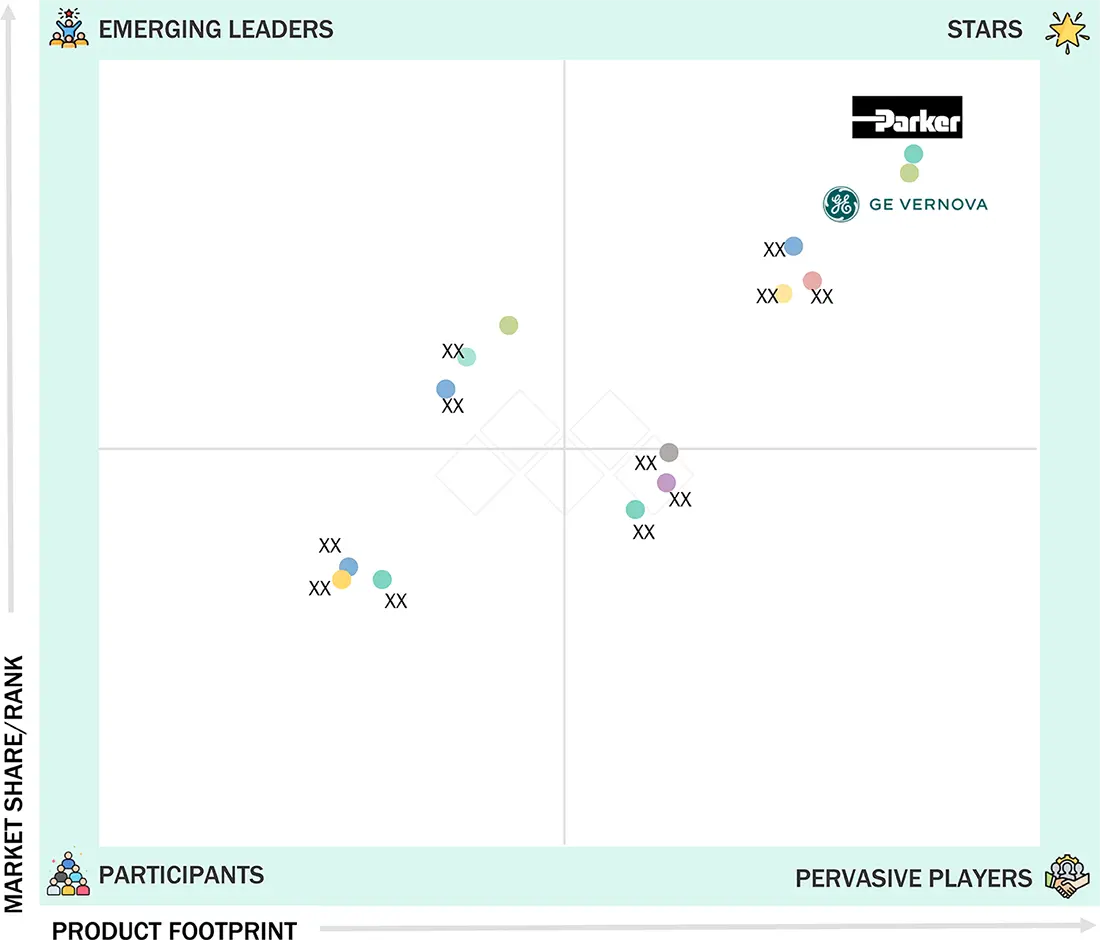
Oil Condition Monitoring Market: COMPANY EVALUATION MATRIX
Parker Hannifin (Star) holds a strong position in the oil condition monitoring market matrix with its extensive range of fluid condition sensors and on-site testing solutions, enabling real-time oil quality analysis and predictive maintenance across multiple industries. GE Vernova (Star) also leads with a comprehensive portfolio of monitoring and diagnostic solutions, leveraging advanced analytics and service capabilities to deliver high reliability and efficiency for industrial assets. Together, these companies drive large-scale adoption of OCM technologies by offering integrated solutions that enhance equipment performance and reduce operational costs.
Source: Secondary Research, Interviews with Experts, MarketsandMarkets Analysis
KEY MARKET PLAYERS
MARKET SCOPE
| REPORT METRIC | DETAILS |
|---|---|
| Market Size in 2024 (Value) | USD 1.21 Billion |
| Market Forecast in 2030 (Value) | USD 1.78 Billion |
| Growth Rate | CAGR of 7.0% from 2025-2030 |
| Years Considered | 2021-2030 |
| Base Year | 2024 |
| Forecast Period | 2025-2030 |
| Units Considered | Value (USD Million/Billion) |
| Report Coverage | Revenue forecast, company ranking, competitive landscape, growth factors, and trends |
| Segments Covered |
|
| Regions Covered | North America, Asia Pacific, Europe, the Middle East & Africa, and Latin America |
WHAT IS IN IT FOR YOU: Oil Condition Monitoring Market REPORT CONTENT GUIDE
DELIVERED CUSTOMIZATIONS
We have successfully delivered the following deep-dive customizations:
| CLIENT REQUEST | CUSTOMIZATION DELIVERED | VALUE ADDS |
|---|---|---|
| European Automotive OEM |
|
|
| North American Oil & Gas Operator | Evaluation of OCM deployment across offshore rigs, pipelines, and refineries - Quantified downtime cost savings using sensor-based monitoring - Vendor scoring model for real-time fluid analysis technologies |
|
| APAC Industrial Equipment Manufacturer |
|
|
RECENT DEVELOPMENTS
- June 2024 : Eaton launched the PFS 02 particle flow sensor for aerospace applications, designed for continuous contamination monitoring of hydraulic and lubrication oils. Capable of operating at pressures up to 6,000 psi (420 bar), the device integrates both the sensor and evaluation unit into a single compact module, replacing earlier separate systems. It delivers immediate contamination diagnostics with multiple output options, including serial, CAN-Bus, and analog interfaces.
- May 2024 : Intertek Group plc entered into a strategic partnership with Korea Testing & Research Institute to streamline global market access for manufacturers of electrical and electronic products. The agreement enables the use of Intertek's CB test reports for Korea Certification and allows Korean companies to obtain Intertek's S Mark for European compliance. This collaboration is designed to accelerate certification timelines, reduce costs, and enhance market readiness for Korean manufacturers, supporting faster and more efficient entry into international markets.
- August 2021 : Shell partnered with Baker Hughes' Bently Nevada to launch VitalyX, an advanced analytics-based oil condition monitoring and machine health service tailored for the marine sector. The solution leverages real-time IIoT sensor data and artificial intelligence to provide precise diagnostics, enhance maintenance strategies, and improve equipment uptime. By integrating predictive analytics with continuous monitoring, the partnership aims to reduce unplanned downtime, extend asset life, and deliver cost savings for marine operators, marking a significant step toward smarter, data-driven maritime operations.
- June 2021 : Parker Hannifin Corporation introduced the DIGI Plus, a next-generation portable oil condition monitoring device designed for rapid on-site and on-board testing in the marine industry. Building on nearly three decades of DIGI cell technology, the DIGI Plus allows users to measure water-in-oil content and base number (BN) levels, enabling early detection of out-of-spec lubricants to prevent equipment failures. The device incorporates a backlit color display, onboard memory, and USB data transfer for enhanced usability, while its rugged design ensures reliable performance in harsh marine environments. This launch strengthened Parker Hannifin's portfolio of advanced condition monitoring solutions for maritime applications.
Table of Contents
 Exclusive indicates content/data unique to MarketsandMarkets and not available with any competitors.
Methodology
The study involved four major activities in estimating the current size of the oil condition monitoring market. Exhaustive secondary research has been conducted to gather information on the market, adjacent markets, and the overall oil condition monitoring landscape. These findings, along with assumptions and projections, were validated through primary research involving interviews with industry experts and key stakeholders across the value chain. Both top-down and bottom-up approaches were utilized to estimate the overall market size. Subsequently, market breakdown and data triangulation techniques were applied to determine the sizes of various segments and subsegments. Two key sources, secondary and primary, were leveraged to conduct a comprehensive technical and commercial assessment of the oil condition monitoring market.
Secondary Research
Various secondary sources have been referred to in the secondary research process to identify and collect important information for this study. The secondary sources include annual reports, press releases, and investor presentations of companies; white papers; journals and certified publications; and articles from recognized authors, websites, directories, and databases. Secondary research has been conducted to obtain key information about the industry’s supply chain, the market’s value chain, the total pool of key players, market segmentation according to the industry trends (to the bottom-most level), regional markets, and key developments from market- and technology-oriented perspectives. The secondary data has been collected and analyzed to determine the overall market size, further validated by primary research.
Primary Research
Extensive primary research was conducted after gaining knowledge about the current scenario of the oil condition monitoring market through secondary research. Several primary interviews were conducted with experts from the demand and supply sides across four major regions—North America, Europe, Asia Pacific, and RoW. This primary data was collected through questionnaires, emails, and telephone interviews.

Other designations include sales and product managers.
The three tiers of the companies are defined based on their total revenue in 2024: Tier 1 - revenue greater than or equal to USD 1 billion; Tier 2 - revenue between USD 500 million and USD 1 billion; and Tier 3 revenue less than or equal to USD 500 million.
To know about the assumptions considered for the study, download the pdf brochure
Market Size Estimation
Both top-down and bottom-up approaches have been used to estimate and validate the total size of the oil condition monitoring market. These methods have also been used extensively to estimate the size of various subsegments in the market. The following research methodology has been used to estimate the market size:
- Major players in the industry and markets have been identified through extensive secondary research.
- The industry’s value chain and market size (in terms of value) have been determined through primary and secondary research processes.
- All percentage shares, splits, and breakdowns have been determined using secondary sources and verified through primary sources.
Oil Condition Monitoring Market : Top-Down and Bottom-Up Approach

Data Triangulation
After arriving at the overall size of the oil condition monitoring market from the market size estimation process explained above, the total market has been split into several segments and subsegments. Data triangulation and market breakdown procedures have been employed, wherever applicable, to complete the overall market engineering process and arrive at the exact statistics for all segments and subsegments of the market. The data has been triangulated by studying various factors and trends from both the demand and supply sides. Along with this, the market size has been validated using both top-down and bottom-up approaches.
Market Definition
The oil condition monitoring market encompasses solutions that assess and track the quality, performance, and health of lubricants used in machinery and equipment across industries. These solutions include hardware, software, and services designed to provide real-time insights into oil properties such as viscosity, oxidation, contamination, and additive depletion, enabling proactive maintenance and minimizing equipment failures. By offering predictive and condition-based maintenance capabilities, oil condition monitoring helps optimize operational efficiency, reduce maintenance costs, and extend equipment life. The market serves diverse sectors, including automotive and transportation, energy & power, industrial manufacturing, oil and gas, and is increasingly driven by digitalization, IoT integration, and growing emphasis on reliability, efficiency, and cost-effective operations.
Key Stakeholders
- Suppliers of raw materials
- Manufacturers and providers of components
- Manufacturers and providers of oil condition monitoring systems/solutions
- Original equipment manufacturers (OEMs)
- Market research and consulting firms
- Associations, organizations, forums, and alliances related to the oil condition monitoring industry
- Technology investors
- Governments and financial institutions
- Venture capitalists, private equity firms, and startups
- Maintenance service providers and third-party service contractors
- End users
Report Objectives
- To define, describe, and forecast the oil condition monitoring market, in terms of offering, end use, industry, and region
- To describe and forecast the market, in terms of value, with regard to four main regions: North America, Europe, Asia Pacific, and Rest of the World (RoW), along with their respective countries
- To provide detailed information regarding major factors influencing the market growth (drivers, restraints, opportunities, and challenges)
- To provide a detailed overview of the value chain of the oil condition monitoring market.
- To strategically analyze micromarkets with respect to individual growth trends, prospects, and contributions to the oil condition monitoring market
- To analyze opportunities in the market for stakeholders by identifying high-growth segments of the oil condition monitoring market
- To strategically profile key players and comprehensively analyze their market position in terms of ranking and core competencies, along with detailing the competitive landscape for market leaders
- To analyze competitive strategies, such as product launches, expansions, mergers, and acquisitions, adopted by key market players in the oil condition monitoring market
Available Customizations:
With the given market data, MarketsandMarkets offers customizations according to the company’s specific needs. The following customization options are available for the report:
Company Information:
- Detailed analysis and profiling of additional market players (up to 5)
Key Questions Addressed by the Report
What is the total CAGR expected to be recorded for the oil condition monitoring market during 2025-2030?
The global oil condition monitoring market is expected to record a CAGR of 7.0% from 2025 to 2030.
What are the driving factors for the oil condition monitoring market?
The oil condition monitoring market is driven by the growing focus on predictive maintenance to reduce equipment downtime and operational costs, alongside the rising adoption of Industry 4.0 technologies for real-time data analysis. Increasing industrialization, expansion of automotive and transportation sectors, and the need for improved asset reliability across industries such as oil and gas, power generation, and manufacturing are further accelerating market growth.
What is the impact of AI on the oil condition monitoring market?
Artificial intelligence (AI) is transforming the oil condition monitoring market by enabling advanced predictive analytics, real-time anomaly detection, and automated diagnostics. AI-powered algorithms can process large volumes of sensor and laboratory data to identify subtle changes in oil properties, predict potential equipment failures, and optimize maintenance schedules. This shift from reactive to predictive maintenance improves operational efficiency, reduces downtime, and extends asset life. Additionally, AI integration enhances decision-making by delivering actionable insights, supporting remote monitoring, and enabling faster response times in industries such as oil and gas, power generation, and transportation.
Which are the significant players operating in the oil condition monitoring market?
Parker Hannifin Corp (US), Eaton (Ireland), ifm electronic gmbh (Germany), TE Connectivity (Ireland), and Schaeffler AG (Germany)
Which region will offer lucrative growth for the oil condition monitoring market by 2030?
During the projected period, the Asia Pacific is expected to grow at the highest CAGR.
Need a Tailored Report?
Customize this report to your needs
Get 10% FREE Customization
Customize This ReportPersonalize This Research
- Triangulate with your Own Data
- Get Data as per your Format and Definition
- Gain a Deeper Dive on a Specific Application, Geography, Customer or Competitor
- Any level of Personalization
Let Us Help You
- What are the Known and Unknown Adjacencies Impacting the Oil Condition Monitoring Market
- What will your New Revenue Sources be?
- Who will be your Top Customer; what will make them switch?
- Defend your Market Share or Win Competitors
- Get a Scorecard for Target Partners

Custom Market Research Services
We Will Customise The Research For You, In Case The Report Listed Above Does Not Meet With Your Requirements
Get 10% Free CustomisationTESTIMONIALS

Tetsuya Ohhira
Business Development Manager-Technology Business
Nikon Corporation,
Leading Japanese MNC specializing in optics and imaging productswww.nikon.com
MarketsandMarkets™ response
is quick. Their attitude is flexible and positive. Analyst Insights are globally considered and
significant. Client Services quickly respond to our inquiry and demand. Their wide range of global
surveys help us make our strategic plan.
We hope Knowledge Store will be easier to search
for a report.
VP - Marketing & Business Development
Leading Provider of Process Control Solutions
We engaged with MarketsandMarkets on a study to perform an analysis and recommend a Go-To-Market strategy for metrology and process control in the semiconductor market. The study was tailored to our targets and needs with well-defined milestones. Our overall experience with the MarketsandMarkets team was very good throughout the project in all aspects including the analysis methodologies used, the quality and depth of primary and secondary data sets, the professionalism and flexibility of the team and the ability to meet the target schedule and milestones. We want to thank MarketsandMarkets team for a job well done.


Growth opportunities and latent adjacency in Oil Condition Monitoring Market