
Metering Pumps Market

Metering Pumps Market by Type (Diaphragm Pump, Pistons/Plungers), End-use Industry (Water Treatment, Petrochemicals and Oil & Gas, Chemical Processing, Pharmaceuticals), Pump Drive (Motor, Solenoid, Pneumatic) and Region - Global Forecast to 2030


METERING PUMPS MARKET
Source: Secondary Research, Interviews with Experts, MarketsandMarkets Analysis | Updated on : March 16, 2026
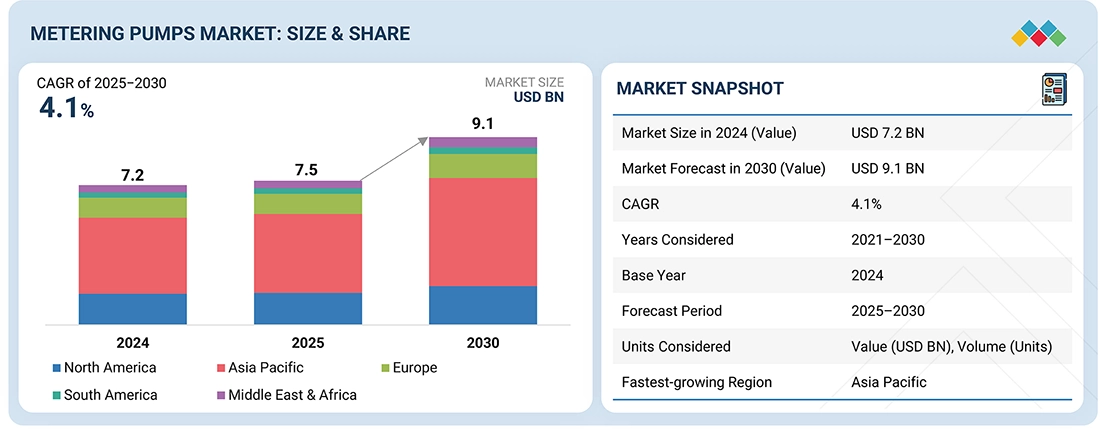
The global metering pumps market was valued at USD 7.5 billion in 2025 and is projected to reach USD 9.1 billion by 2030, growing at 4.1% cagr from 2025 to 2030. A metering pump is a chemical injection positive displacement device that can vary capacity manually or automatically as per the requirement. The characteristics of metering pumps, such as accuracy and uninterrupted operations without frequent monitoring, are driving the demand for metering pumps across industries, especially in water treatment and chemical processing industries.
KEY TAKEAWAYS
-
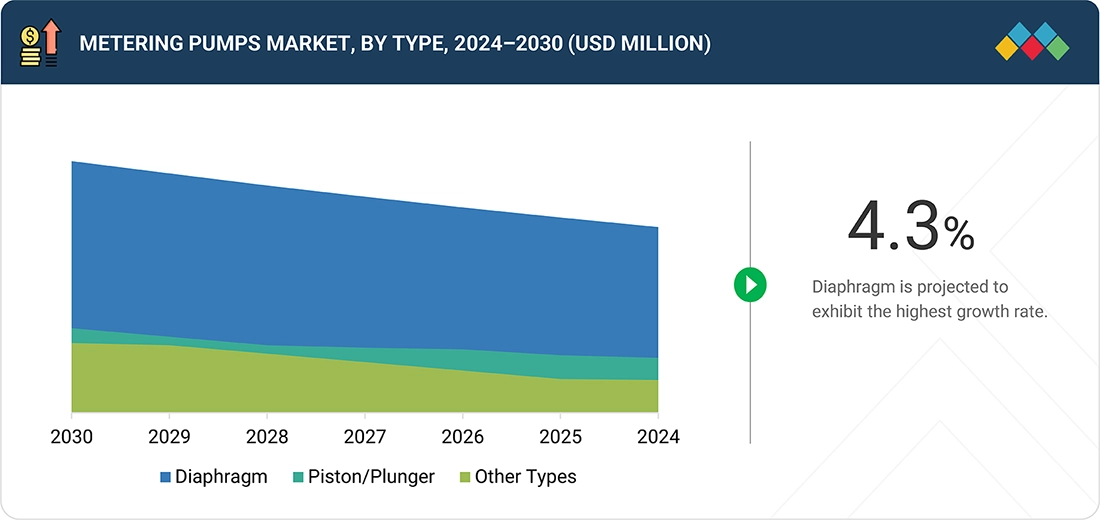
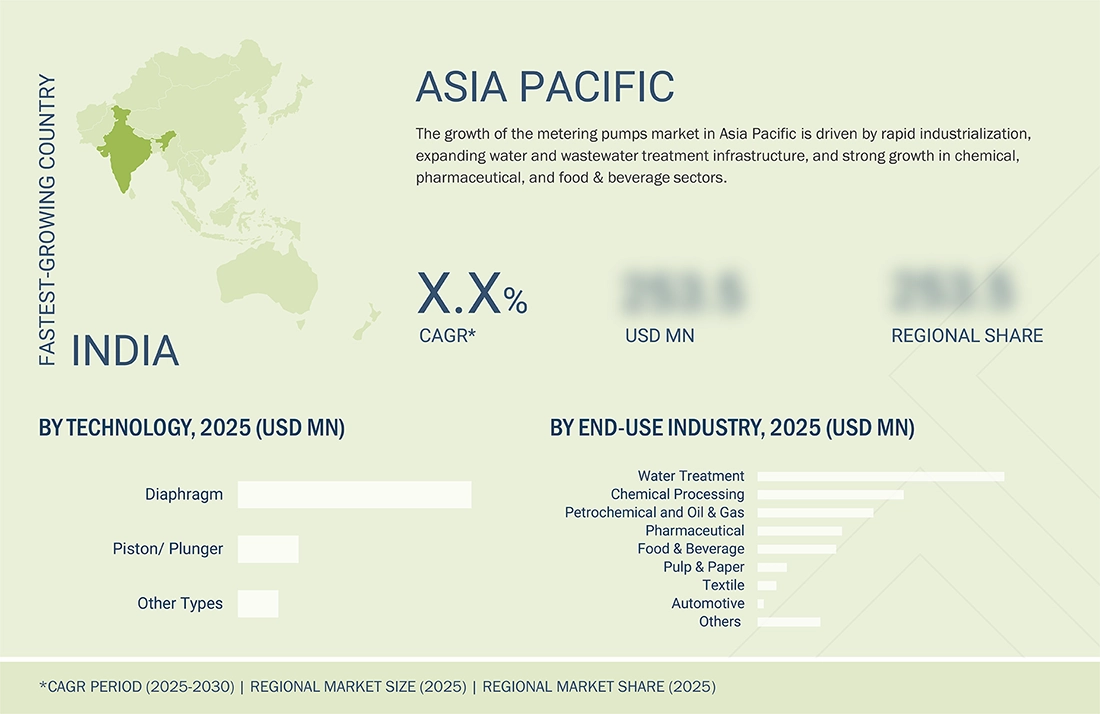
BY TYPEBased on type, the metering pumps market is segmented into diaphragm, piston/plunger, peristaltic, and other pump types. Among these, diaphragm metering pumps lead the market owing to their high precision, chemical resistance, and low maintenance requirements, making them ideal for applications in water treatment, chemical processing, and pharmaceuticals.
-
BY END-USE INDUSTRYThe metering pumps market serves a wide range of end-use industries, including water treatment, petrochemical and oil & gas, chemical processing, pharmaceuticals, food & beverage, pulp & paper, automotive, textile, and others. Among these, water treatment remains the leading segment, driven by rising demand for precise chemical dosing in wastewater and potable water treatment facilities.
-
BY PUMP-DRIVEBy pump drive, the metering pumps market is segmented into motor-driven, solenoid-driven, pneumatic-driven, and others. Among these, motor-driven metering pumps hold the largest market share due to their superior performance, precise flow control, and suitability for continuous industrial operations. They are widely adopted in sectors such as water treatment, chemicals, and oil & gas, where high reliability and accuracy are critical. Solenoid-driven pumps are preferred in applications requiring compact design and lower flow rates, such as laboratory or small-scale dosing systems
-
BY REGIONThe market is segmented based on region into Asia Pacific, North America, Europe, Latin America, and the Middle East & Africa. Asia Pacific is the fastest-growing market due to rapid industrialization, expanding water/wastewater projects, and growth in the chemicals and pharmaceuticals sector.
-
COMPETITIVE LANDSCAPEThe metering pumps market is characterized by strategic product innovations, mergers, acquisitions, and partnerships among leading players such as Ingersoll Rand Inc., IDEX Corporation, Dover Corporation, Grundfos Holding A/S, SEKO S.p.A., LEWA GmbH, ProMinent GmbH, Watson-Marlow Fluid Technology Solutions (Spirax Group), SPX Flow, Inc., and Milton Roy Company. These companies focus on expanding their product portfolios, enhancing automation capabilities, and strengthening their regional presence through technological upgrades and service networks. Emerging players are increasingly investing in energy-efficient and smart dosing solutions to gain a competitive edge in the global market.
The metering pumps market is supported by the rising need for exact fluid dosing in various sectors like water treatment, chemical processing, and pharmaceutical. Nevertheless, expensive installation and maintenance of the equipment hinder the market, whereas improvements in digital control technology open up possibilities in a situation of problems such as fluctuation in raw material prices and competition from low-cost substitutes.
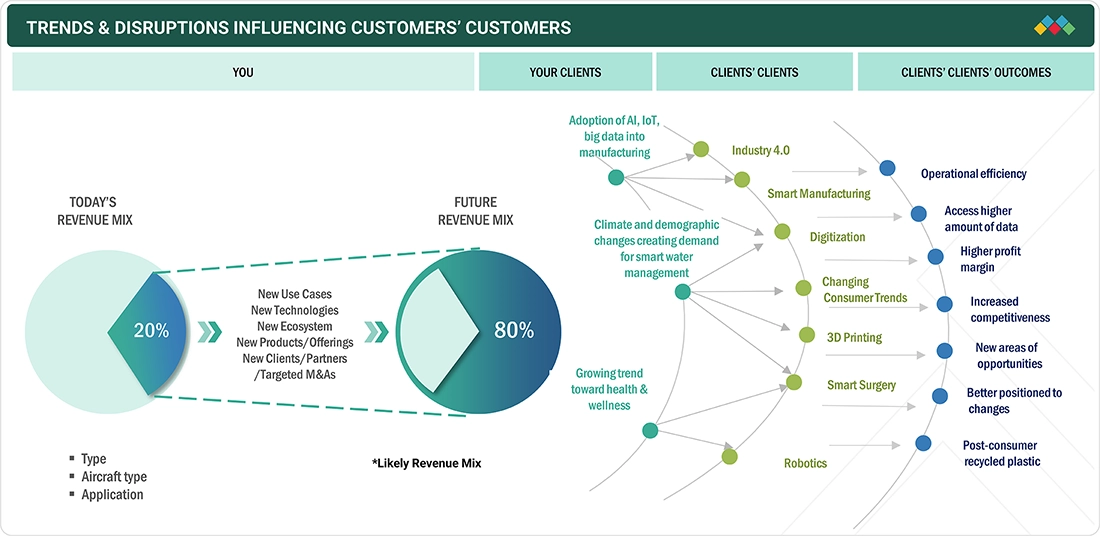
METERING PUMPS MARKET TRENDS & DISRUPTIONS IMPACTING CUSTOMERS' CUSTOMERS
Rapid industrial expansion, stricter environmental regulations, and increasing demand for precise fluid dosing in applications such as water treatment, chemical processing, and pharmaceuticals are reshaping the metering pumps market. Additionally, rising adoption of energy-efficient and smart dosing technologies, coupled with fluctuating raw material costs and supply chain constraints, is driving both innovation and competitive transformation across the global market.
Source: Secondary Research, Interviews with Experts, MarketsandMarkets Analysis
METERING PUMPS MARKET DYNAMICS
Level
-
Increasingly stringent wastewater treatment regulations

-
Rise in population and rapid urbanization

Level
-
Frequent maintenance requirement

-
Volatility in raw material prices

Level
-
Joint venture activities and expansions by end users in high-growth markets

-
Growing preference for digital pumping solutions and advanced pumps

Level
-
Growing customization demands from end-use industries

-
Low scope of product differentiation

Source: Secondary Research, Interviews with Experts, MarketsandMarkets Analysis
Driver: Increasingly stringent wastewater treatment regulations
Worldwide?????? water use is increasing by about 1% every year, which is putting more and more pressure on the available resources. The lack of access to clean drinking water affects more than 2.2 billion people, which is a loud call for an efficient wastewater management system. Almost 80% of wastewater in the world is being discharged without treatment into nature. The industrial sector is a major contributor to the use of fresh water. Is it responsible for about 19% of the total global consumption, which is projected to reach 24% by 2050. The skyrocketing water demand has caused many governments to implement stricter regulations aimed at reducing pollution and promoting sustainable use. The United Nations has also pointed out the increasing inequality of freshwater distribution, as some areas have more than enough water while others suffer from severe shortages. In such a context, the need for metering pumps is increasing. These devices are instrumental in achieving accurate chemical dosing in wastewater treatment plants. These units have become the core of the most stringent environmental regulations compliance and the driving force of the ongoing water purification processes on a global ??????scale.
Restraint: Volatility in raw material prices
The metering pumps market faces a significant restraint due to the unpredictable fluctuations in the prices of key raw materials. The cost of metering pumps is predominantly influenced by factors such as their operating range and the materials of construction (MoC). Essential components of metering pumps encompass a variety of materials, including metals, polymers, and alloys. Consequently, the market is susceptible to erratic pricing patterns of these essential materials. These unpredictable price shifts present manufacturers with difficulties in securing consistent supplies of high-quality raw materials and adhering to the rigid delivery schedules imposed by suppliers. Such fluctuations often result in additional expenses for metering pump manufacturers. These uncertainties in material costs pose challenges in meeting buyer commitments and can lead to substantial financial losses for manufacturers, thereby impeding the growth of the metering pumps market.
Opportunity: Growing preference for digital pumping solutions and advanced pumps
The metering pump market is a beneficiary of the uptrend in heavy industrial operations and the increasing willingness to invest in advanced digital pumping technologies. After a period of fast industrialization, companies have been driven to expand their production capacities, and also, go for strategic collaborations. The Asia Pacific region is turning into a major growth hub due to its rapidly increasing population, rising living standard, and the availability of cheap labor. As a result, the demand for efficient metering systems will grow exponentially with the increase in the number of manufacturing facilities. Conversely, customers are changing their preference by choosing digitally automated pumping systems that have features such as intelligent diagnostic tools, variable-speed controls, and precision flow-monitoring capabilities. This technology upgrade leads to improved accuracy, tighter process control, and higher operational efficiency, thereby creating vast potential for the market to grow over the next years.
Challenge: Growing customization demands from end-use industries
The most critical problem faced by the metering pump market is the need for customer product customization. As industries become more diverse and their technical requirements are more specialized, end users demand customized products specific to their operational needs. The process of creating personalized products typically entails spending more on engineering, adopting specialized production setups, and a more complicated supply chain. These factors can increase the cost of operation, which make it difficult to achieve a balance between flexibility and efficiency. It is a very challenging task for market players to supply the most highly customized pump configurations and, at the same time, uphold the affordability and reliability factor. Manufacturers have to be innovative and implement adaptation strategies in their manufacturing methods to be able to compete in the long ??????run.
Metering Pumps Market: COMMERCIAL USE CASES ACROSS INDUSTRIES
| COMPANY | USE CASE DESCRIPTION | BENEFITS |
|---|---|---|
 |
PSG highlighted the use of metering pumps in power generation plants to ensure precise chemical dosing in critical applications such as boiler feedwater treatment, cooling water conditioning, and emissions control. The pumps deliver accurate, consistent flow rates of treatment chemicals, such as oxygen scavengers, corrosion inhibitors, and pH control agents, to maintain optimal operating efficiency and equipment protection. | By maintaining exact chemical dosing levels, PSG’s metering pumps help maximize plant reliability, extend equipment life, and minimize downtime. Their advanced design enables energy-efficient operation, improved process safety, and reduced chemical consumption, supporting both cost-effective and environmentally compliant power generation. |
 |
The company provided six Hydra-Cell P200 diaphragm metering pumps for green hydrogen production, which are used to dose deionized water and methanol at variable flow rates and pressures up to 15 bar in ATEX Zone 2 environments. | It delivered precise, pulse-free dosing for stable hydrogen production, ensured safe operation in hazardous areas, and improved process reliability and efficiency. |
Logos and trademarks shown above are the property of their respective owners. Their use here is for informational and illustrative purposes only.
METERING PUMPS MARKET ECOSYSTEM
The metering pumps market ecosystem comprises several key participants, including raw material suppliers (metals, plastics, elastomers, and electronic components), manufacturers (producing diaphragm, piston, and peristaltic metering pumps), distributors (handling sales, logistics, and aftersales support), and end users across industries such as water & wastewater treatment, chemicals, oil & gas, pharmaceuticals, food & beverages, and pulp & paper.
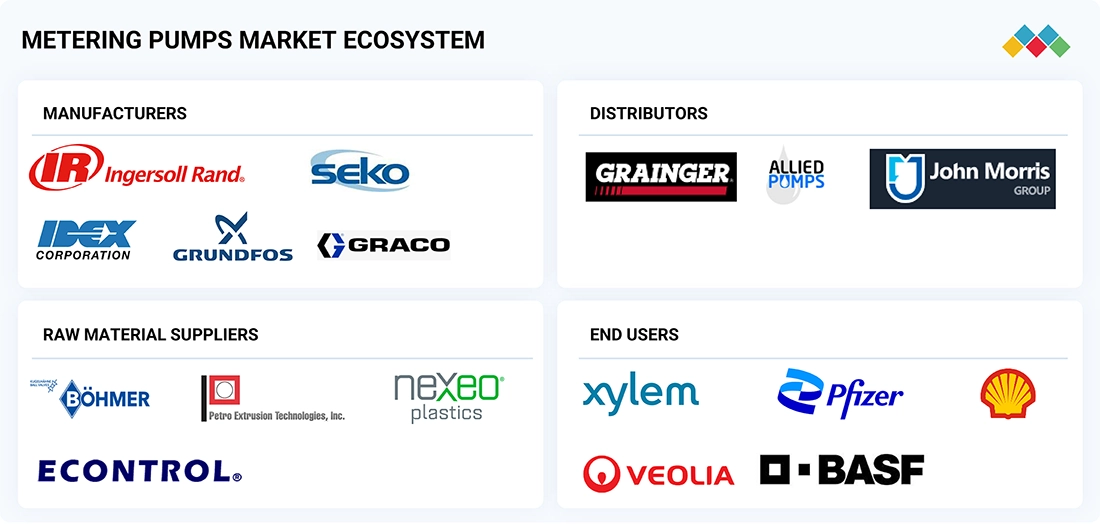
Logos and trademarks shown above are the property of their respective owners. Their use here is for informational and illustrative purposes only.
METERING PUMPS MARKET SEGMENTS
Source: Secondary Research, Interviews with Experts, MarketsandMarkets Analysis
Metering Pumps Market, By Type
The diaphragm pumps segment dominated the overall metering pumps market in 2024. Diaphragm pumps, being accurate, safe in operation, and always reliable in performance, are still the most popular ones in various industries. The demand for these devices is mainly influenced by the water treatment industry, along with the pharmaceutical and medical sectors. Owing to their ability to provide exact chemical dosing, these pumps are indispensable in pharmaceutical production, laboratory research, and other vital fluid-handling operations.
Metering Pumps Market, By End-use industry
The water treatment sector is the largest end user of metering pumps. Metering pumps are used for the control and dosing of chemicals used in water treatment. The limited availability of freshwater and the need for safe water have sped up the process of water treatment all over the globe. Besides this, the requirements for purification systems have been further increased by industrialization and urbanization.
By Pump Drive
The motor-driven metering pumps segment accounted for the largest share of the overall market in 2024. They are mainly used in low- to medium-pressure applications as they can be efficient without compromising the performance. The advantages that these pumps offer are changing the speed, the stroke length, and the frequency to match the exact metering need. They have become a necessary tool for industries such as chemical processing and wastewater treatment. These pumps offer reliability, energy efficiency, and continuous dosing accuracy.
REGION
Asia Pacific to be largest metering pumps market
Asia Pacific is the largest market for metering pumps and is expected to maintain its position as a leader during the forecast period. The region's strong industrial activities countries, influenced by increasing operations in oil and gas refining, growing chemical industry, and heavy investments in desalination, fuel the market growth. The pharmaceutical and food & beverage sectors of the region are booming, which further accelerates the demand for metering pumps. Also, rapid urbanization combined with increasing population levels continues to push the demand for sustainable water solutions.
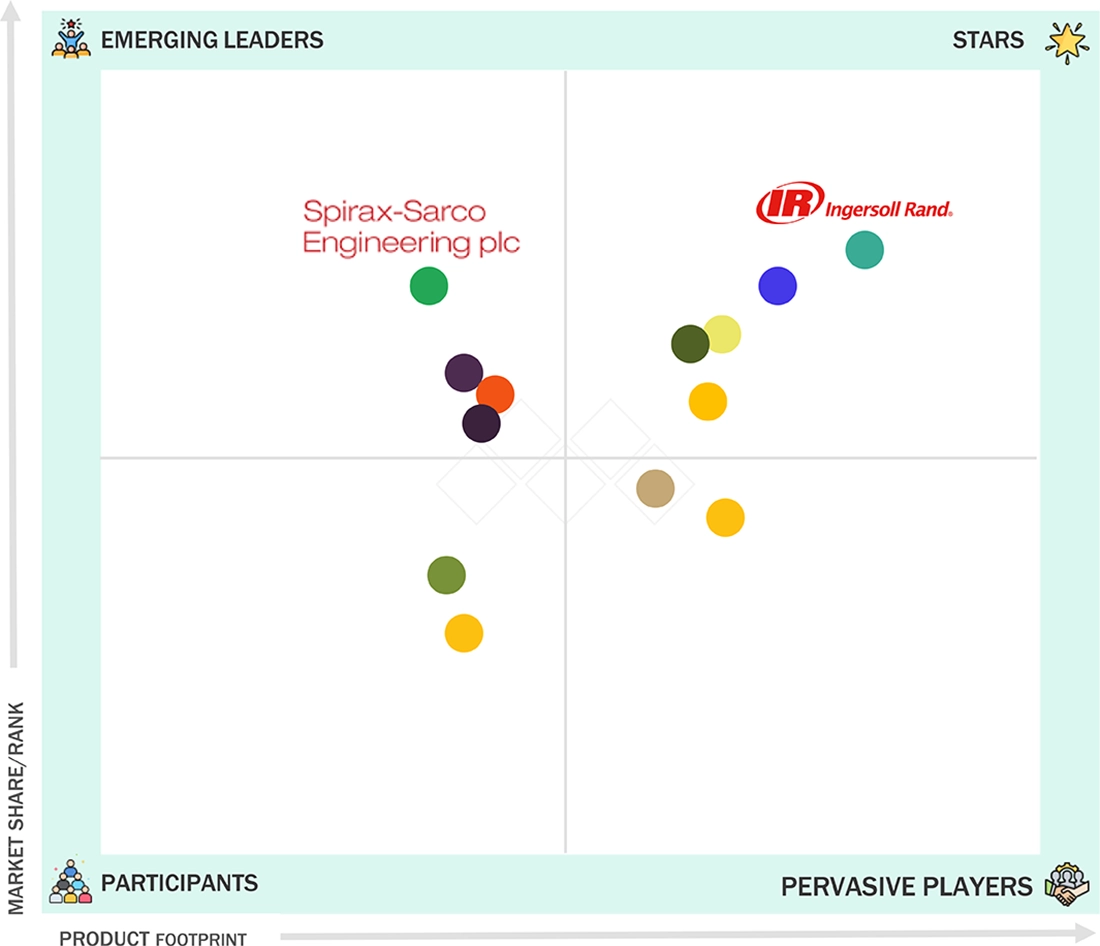
Metering Pumps Market: COMPANY EVALUATION MATRIX
In the metering pumps market, Ingersoll Rand Inc. stands as the leader, backed by its global scale, robust product portfolio, and strategic brands like Milton Roy and Dosatron that deliver advanced dosing solutions across the water treatment, chemical, and oil & gas sectors. Meanwhile, Spirax-Sarco Engineering plc (Spirax Group) is emerging as a strong contender, leveraging its Watson-Marlow Fluid Technology Solutions division to expand into precision metering applications in the pharmaceuticals, food & beverage, and water treatment sectors, positioning itself as an agile, innovation-driven challenger in the global market.
Source: Secondary Research, Interviews with Experts, MarketsandMarkets Analysis
KEY MARKET PLAYERS
MARKET SCOPE
| REPORT METRIC | DETAILS |
|---|---|
| Market Size in 2024 (Value) | USD 7.2 Billion |
| Market Forecast in 2030 (Value) | USD 9.1 Billion |
| Growth Rate | CAGR of 4.1% from 2025-2030 |
| Years Considered | 2021-2030 |
| Base Year | 2024 |
| Forecast Period | 2025-2030 |
| Units Considered | Value (USD Million), Volume (Units) |
| Report Coverage | Revenue forecast, company ranking, competitive landscape, growth factors, and trends |
| Segments Covered | By Type: Diaphragm Pumps, Piston/Plunger Pumps, Other Types By Pump Drive: Motor-Driven Metering Pumps, Solenoid-Driven Metering Pumps, Pneumatic-Driven Metering Pumps, Others By End-use Industry: Water Treatment, Petrochemicals and Oil & Gas, Chemical Processing, Pharmaceuticals, Food & Beverage, Pulp & Paper, Textile, Automotive, Other end-use Industries |
| Regions Covered | North America, Asia Pacific, Europe, South America, Middle East & Africa |
WHAT IS IN IT FOR YOU: Metering Pumps Market REPORT CONTENT GUIDE

DELIVERED CUSTOMIZATIONS
We have successfully delivered the following deep-dive customizations:
| CLIENT REQUEST | CUSTOMIZATION DELIVERED | VALUE ADDS |
|---|---|---|
| Detailed Metering Pumps Market Analysis by Region | Market sizing and demand forecasting for metering pumps across major regions, segmented by pump type, drive, and end-use industry | Delivered region-specific insights on water treatment, chemical, and pharmaceutical sectors; analyzed investment patterns and regulatory trends shaping regional growth |
| Sub-Segmentation within Metering Pumps Market | Further market division by end-user customization requirements | Enabled detailed assessment of digitalization trends, product innovation, and tailored solutions for priority segments like pharmaceuticals and water management |
RECENT DEVELOPMENTS
- February 2025 : Ingersoll Rand’s LMI Pumps business in Ivyland, PA, announced the launch of its TD Series Chemical Metering Pump featuring FLUXDRIVE Technology.
- February 2025 : ProMinent introduced the beta/ X, a next-generation diaphragm metering pump designed for precision, simplicity, and sustainability. With a capacity range of 10 ml/h to 50 l/h and pressure capabilities from 16 to 2 bar, the beta/ X offers versatile dosing solutions.
- March 2022 : Graco expanded its business in the hose pump line. The Solo Tech-range included models for hygienic applications and additional sizes for industrial installations.
- August 2022 : Graco Inc. announced the purchase of approximately twenty acres of land adjacent to the company's existing Anoka facility for future expansion of business.
- August 2022 : Grundfos launched an expansion of range extra-large CR pumps, taking current energy efficiency and performance standards for vertical multi-stage in-line pumps to the next level.
Table of Contents
 Exclusive indicates content/data unique to MarketsandMarkets and not available with any competitors.
Methodology
The study involved four major activities for estimating the current size of the global metering pumps market. Exhaustive secondary research was carried out to collect information on the market, the peer product market, and the parent product group market. The next step was to validate these findings, assumptions, and sizes with the industry experts across the value chain of metering pumps through primary research. Both the top-down and bottom-up approaches were employed to estimate the overall size of the metering pumps market. After that, market breakdown and data triangulation procedures were used to determine the size of different segments and sub-segments of the market.
Secondary Research
In the secondary research process, various secondary sources such as Hoovers, Factiva, Bloomberg BusinessWeek, and Dun & Bradstreet were referred to identify and collect information for this study on the metering pumps market. These secondary sources included annual reports, press releases & investor presentations of companies; white papers; certified publications; articles by recognized authors; regulatory bodies, trade directories, and databases.
Primary Research
The metering pumps market comprises several stakeholders in the supply chain, which include suppliers, processors, and end-product manufacturers. Various primary sources from the supply and demand sides of the markets have been interviewed to obtain qualitative and quantitative information. The primary participants from the demand side include key opinion leaders, executives, vice presidents, and CEOs of companies in the metering pumps market. Primary sources from the supply side include associations and institutions involved in the metering pumps industry, key opinion leaders, and processing players.
The following is the breakdown of primary respondents:

Notes: Other designations include product, sales, and marketing managers.
Tiers of the companies are classified based on their annual revenues as of 2022, Tier 1 = >USD 5 Billion, Tier 2 = USD 1 Billion to USD 5 Billion, and Tier 3= < USD 1 Billion.
To know about the assumptions considered for the study, download the pdf brochure
Market Size Estimation
Both the top-down and bottom-up approaches were used to estimate and validate the size of the global metering pumps market. These approaches were also used extensively to estimate the size of various segments of the market. The research methodology used to estimate the market size included the following details:
- The key players in the industry were identified through extensive secondary research.
- The supply chain of the industry and market size, in terms of value, were determined through primary and secondary research.
- All percentage share splits and breakdowns were determined using secondary sources and verified through primary sources.
- All possible parameters that affect the markets covered in this research study were accounted for, viewed in extensive detail, verified through primary research, and analyzed to obtain the final quantitative and qualitative data.
- The research includes the study of reports, reviews, and newsletters of key industry players, along with extensive interviews with key officials, such as directors and marketing executives.

Data Triangulation
After arriving at the overall market size from the estimation process explained above, the total market was split into several segments and sub-segments. The data triangulation and market breakdown procedures were employed, wherever applicable, to complete the overall market engineering process and arrive at the exact statistics for all the segments and sub-segments of the metering pumps market. The data was triangulated by studying various factors and trends from both the demand and supply sides.
In addition, the market size was validated by using both the top-down and bottom-up approaches. Then, it was verified through primary interviews. Hence, for every data segment, there are three sources: top-down approach, bottom-up approach, and expert interviews. The data were assumed to be correct when the values arrived at from the three sources matched.
Market Definition
Metering pumps, in the context of industrial equipment and fluid handling systems, are specialized devices designed for precise and controlled delivery of fluids at predetermined flow rates and volumes. These pumps are primarily used for accurate chemical injection or dosing of liquids into various processes, often in industries such as water treatment, chemical manufacturing, pharmaceuticals, petrochemicals, food & beverage, and pulp & paper production. Metering pumps play a crucial role in ensuring the consistent and reliable addition of chemicals, additives, or reagents into fluid streams, maintaining optimal process conditions, and complying with strict quality and environmental standards.
Stakeholders
- Raw material suppliers
- Metering pumps manufacturers
- Government & regulatory bodies
- Research organizations
- Associations and industry bodies
- End users
- Traders and distributors
Report Objectives
- To define, analyze, and project the size of the metering pumps market in terms of value and volume based on type, pump drive, end-use industry, and region
- To project the size of the market and its segments with respect to the five main regions, namely, North America, Europe, Asia Pacific, the Middle East & Africa, and South America
- To provide detailed information about the key factors, such as drivers, restraints, opportunities, and challenges, influencing the growth of the market
- To analyze the opportunities in the market for stakeholders and provide a detailed competitive landscape of the market leaders
- To analyze the competitive developments, such as new product launches, expansions, and acquisitions, in the metering pumps market
- To strategically profile the key players operating in the market and comprehensively analyze their market shares and core competencies
Key Questions Addressed by the Report
Which are the major companies in the metering pumps market?
Major companies in the metering pumps market are Grundfos Holding A/S (Denmark), IDEX Corporation (US), ProMinent GmbH (Germany), SEKO S.p.A. (Italy), and Milton Roy Company (US), among others.
Which end users in the metering pumps market are likely to exhibit the highest CAGR during the forecast period?
The water & wastewater treatment industry is expected to witness the highest CAGR due to increasing investments in water treatment infrastructure.
Which pump types in the metering pumps market are likely to drive growth over the coming years?
Diaphragm pumps and piston/plunger pumps, among offerings of the metering pumps market, are likely to drive market growth during the forecast period.
What are the drivers and opportunities for the metering pumps market?
Increasing demand for precise chemical dosing, rising water treatment activities, and expanding chemical processing industries are the major drivers and opportunities of the metering pumps market.
What are the restraints and challenges for the players in the metering pumps market?
High maintenance costs and technical complexities in pump operation are the major challenges faced by market players.
Need a Tailored Report?
Customize this report to your needs
Get 10% FREE Customization
Customize This ReportPersonalize This Research
- Triangulate with your Own Data
- Get Data as per your Format and Definition
- Gain a Deeper Dive on a Specific Application, Geography, Customer or Competitor
- Any level of Personalization
Let Us Help You
- What are the Known and Unknown Adjacencies Impacting the Metering Pumps Market
- What will your New Revenue Sources be?
- Who will be your Top Customer; what will make them switch?
- Defend your Market Share or Win Competitors
- Get a Scorecard for Target Partners

Custom Market Research Services
We Will Customise The Research For You, In Case The Report Listed Above Does Not Meet With Your Requirements
Get 10% Free CustomisationTESTIMONIALS

We at Nissan Chemicals Corporation have been clients of MarketsandMarkets for more than a year now. We recently consulted MarketsandMarkets for a study, the team at MarketsandMarkets was extremely professional and organized. The business insights were very detailed and aligned well with our expectations that really helped us formulate the Business Plans and device new strategies for development themes. MarketsandMarkets offers a unique combination of expertise and dedicated engagement model. Their research findings have helped us in designing our Pricing Strategy which will make it easier for us to predict the future sales and profits for the next ten years. We look forward to working with MarketsandMarkets in the future.
VP of Strategy & New Business Development
Leading Specialty Chemical Company
The MarketsandMarkets Engagement Model, composed of both the Knowledge Store and advisory custom research, has greatly helped us in understanding our markets and making strategic decisions. The Knowledge Store is a fast way to allow everyone in our organization to understand more about most any market they are interested in. The ability to then get custom research done and get answers to specific strategic questions and market insight has been spectacular. The Markets and Markets team feel more like colleagues than vendors and their services have helped us change our culture where statements of things like growth opportunities and competitive position are always backed by industry research.

Rich Gibson,
Director, Corporate Strategy
Milliken & Company,
Leading Industrial Manufacturer of specialty chemical, floor covering, performance and protective textile materials, and healthcaremilliken.com
MarketsandMarkets is a trusted resource that helps us to better understand markets that are near-adjacencies-whether its technology, value chain or geography. Their Knowledge Store platform provides a dashboard of markets and their characteristics which is easy to use and saves us time.
Adam Shaw,
Market Development and Strategy Manager
AdvanSix Inc. USA,
An American Leader in Chemicalswww.advansix.com
The Knowledge Store from MarketsandMarkets is a valuable tool which has helped my team acquire greater insight in to the end markets that our business serves. This has enabled us to help our company build stronger strategies throughout our planning process.
TOSHIO KINOSHITA
Senior Chif Consultion Research & Consulting Division
Mitsubishi Chemical Research Corporation,
Leading Manufacturer of Chemical Productswww.mitsubishichem-res.co.jp/en/

We recently engaged with MarketsandMarkets for a study, the team not only clearly understood our business objectives but was also extremely professional in the way they handled the entire project. The study was efficiently conducted in a phase-wise manner, and the engagement model furnished us with high-quality business insights that far exceeded our expectations at each phase. We were especially happy that MarketsandMarkets could provide us with both, an English as well as a Japanese version of the study. A special thanks to the Analyst Team and Client Services Team, whose fluency in Japanese enhanced our comfort level, as we could converse with them in our preferred language.
Independent entrepreneurs
Arrow Precision
We approached MarketsandMarkets for study on Proppants Market, and their work exceeded our expectations. The study conducted was comprehensive and enabled us to view the market through the various dimensions. In addition, the team was extraordinarily responsive throughout the process and resolved our queries on time. I strongly recommend MarketsandMarkets and will certainly consider them for additional market assessments we will need in the future.
Global engineering company, Japan
Deputy Manager,
Strategic Planning OfficeThe high-quality insights shared by the MarketsandMarkets team helped us understand the pharmaceutical plant designers in a specific geography. It also captured the risks that we may likely face in communicating with our potential partners. The study would enable us identify partners, which would impact our future growth.
Growth opportunities and latent adjacency in Metering Pumps Market


saravanan
Dec, 2015
Information on Metering pumps market size in the water treatment application..
Paul
Apr, 2016
Competative profiles needed for europe and america.
somaia
Feb, 2014
Metering Pumps market report.
Tom
Aug, 2016
Information on Metering pumps, disinfection techniques such as UV, Ozone, ClO2 and electrolysis for water treatment applications..
Sajith
Jun, 2014
Interested in Dosing Pump market.
Timothy
Mar, 2019
General information on the growth of metering pumps market.