
Paper Bags Market

Paper Bags Market by Product Type (Sewn Open Mouth, Pinched Bottom Open Mouth, Pasted Valves, Pasted Open Mouth, & Flat Bottom), Thickness, Material, End-use (Food Service, Retail, E-commerce, Industrial), & Region - Global Forecast to 2029
Updated on : December 11, 2025


PAPER BAGS MARKET
Source: Secondary Research, Interviews with Experts, MarketsandMarkets Analysis
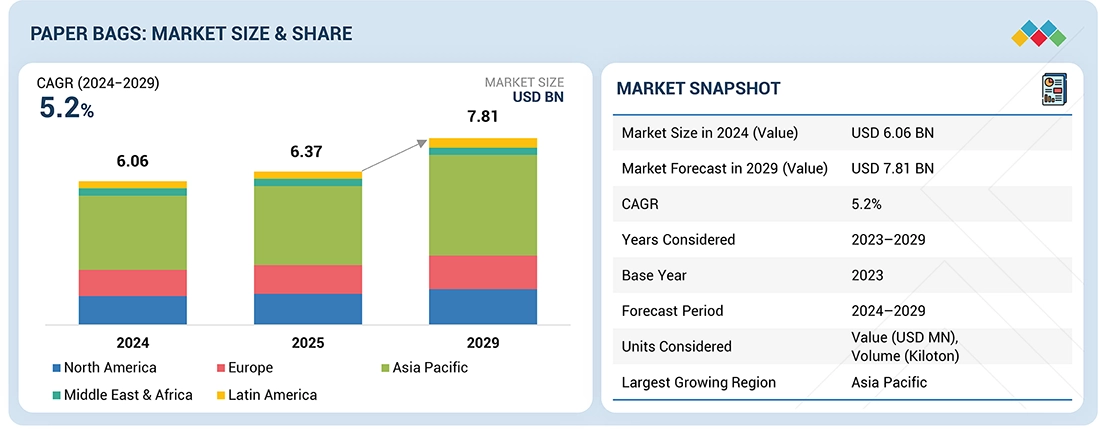
The paper bags market was valued at USD 6.06 billion in 2024 and is projected to reach USD 7.81 billion by 2029, growing at 5.2% cagr from 2025 to 2029. Paper Bags refers to the wrapping of products in an affordable and adaptable way using non–rigid materials. It has gained immense popularity due to its sustainability and efficacy. Paper bags include sewn open mouth, pinched bottom open mouth, pasted valves, pasted open mouth, and flat bottom produced from materials such as brown kraft paper, and white kraft paper. The rising demand for these products in the food services, retail, and e-commerce sectors drives market growth.
KEY TAKEAWAYS
-
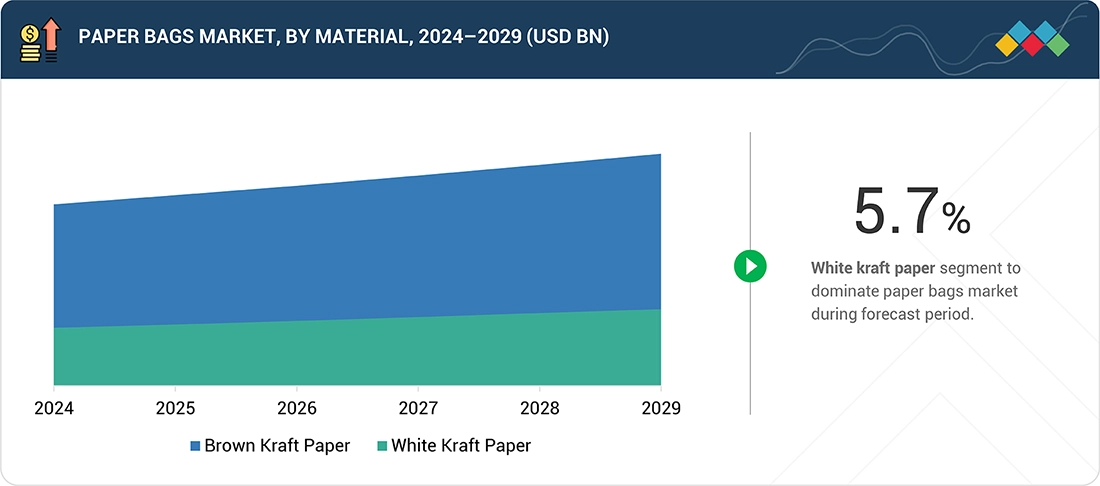
BY MATERIALThe paper bags market by material includes brown kraft paper and white kraft paper. Brown kraft paper dominates the market in terms of demand, because of the growth of online shopping and a strong consumer preference for sustainable packaging solutions.
-
BY THICKNESSThe paper bags market by thickness includes 1 PLY, 2 PLY, 3 PLY, and Over 3 PLY. 1PLY is the largest segment, as the production cost of 1-ply paper bags is lower, making them a cost-effective packaging solution.
-
BY PRODUCT TYPEThe paper bags market by product type includes sewn open mouth, pinched bottom open mouth, pasted valve, pasted open mouth, and flat bottom. Pasted valve is the fastest-growing segment because they are highly efficient and reliable packaging solution designed for the secure handling of bulk materials.
-
BY END-USEThe paper bags market by end-use includes food service, retail, e-commerce, industrial, and others. Food service is the largest segment due to expansion of online food delivery services.
-
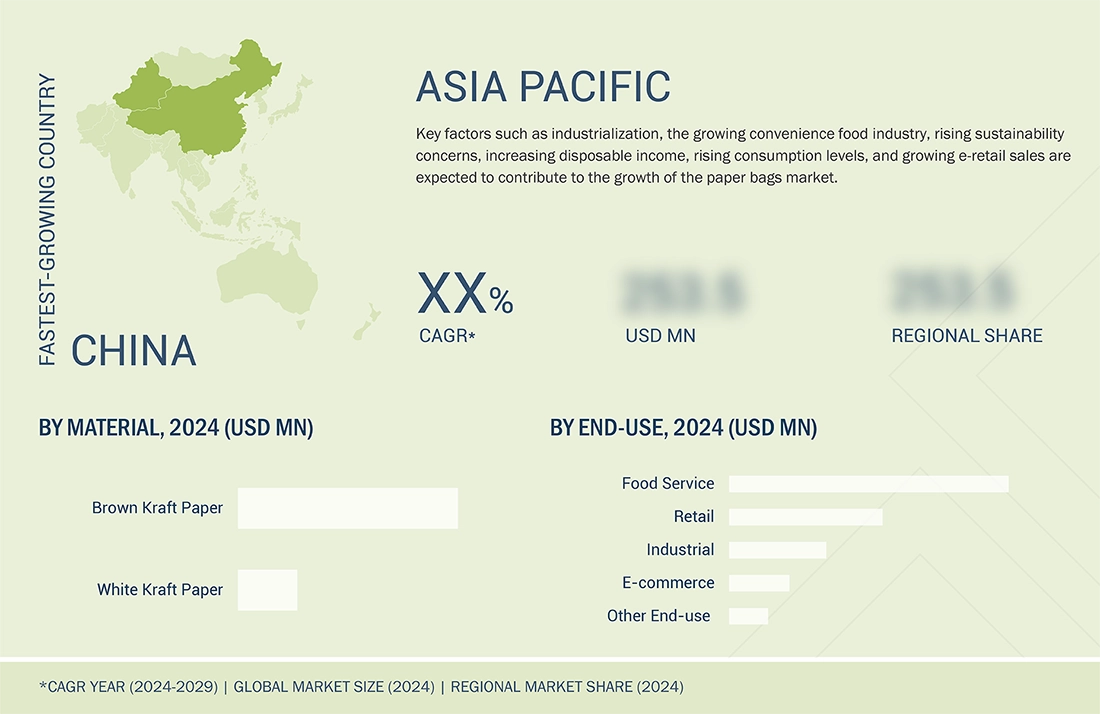
BY REGIONAsia Pacific is expected to grow fastest, with a CAGR of 6.0%, driven by shift towards sustainable practices across various industries.
-
COMPETITIVE LANDSCAPEThe market is driven by strategic product launches, acquisitions, partnerships, agreements, and expansions from leading players such as Mondi Group (UK), International Paper (US), Oji Holdings Corporation (Japan), Smurfit Kappa (Ireland), Stora Enso (Finland), and DS Smith (UK). These companies offer products to end-use sectors through strategic partnerships and acquisitions.
Paper bags have become highly in demand because of their environmental sustainability and the ban on plastic bags, which has gained widespread acceptance due to the ever-growing environmental concerns and legal policies that restrict plastic bag use.
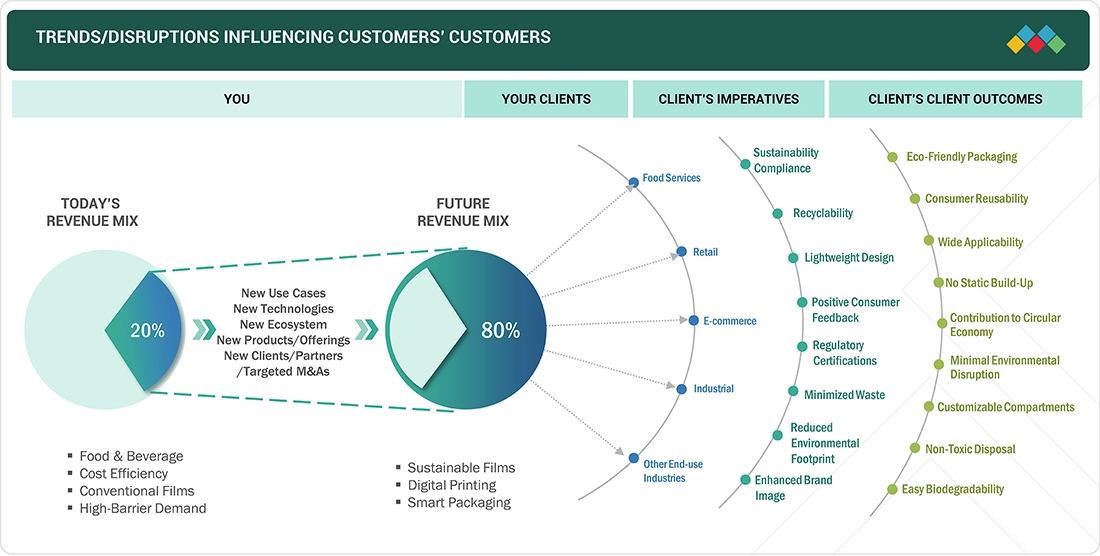
TRENDS & DISRUPTIONS IMPACTING CUSTOMERS' CUSTOMERS
The growing demand for environmentally friendly packaging as a result of plastic bans has an impact on consumers. They favor bags that satisfy their needs and are adaptable, aesthetically pleasing.
Source: Secondary Research, Interviews with Experts, MarketsandMarkets Analysis
PAPER BAGS MARKET DYNAMICS
Level
-
Rising demand from e-commerce sector

-
Government regulations and bans on single-use plastics

Level
-
High cost of production

-
Limited durability in wet conditions

Level
-
Expansion into non-grocery sectors

-
Introducing paper bags with functional features

Level
-
Environmental impact of paper production and recycling

-
Challenges in recycling paper bags due to insufficient infrastructure

Source: Secondary Research, Interviews with Experts, MarketsandMarkets Analysis
Driver: Growth of e-commerce industry
E-commerce growth is revolutionizing the pattern of consumer purchasing and, at the same time, offering new pathways for the paper bag industry to expand. Online retailers continue to expand across international markets and, with an increased requirement for packaging in terms of sustainability and cost-effectiveness, the requirements for sustainable packaging are multiplying. Among all such innovations, the paper bag offers itself as a highly valued substitute by e-commerce providers that look for minimal ecological cost. Their use aligns with the sustainability initiatives of many online retailers while meeting consumer demand for greener packaging options. With the increasing e-commerce sector, paper bag manufacturers now stand at a great opportunity of creating innovative and bespoke solutions that will meet the distinct needs of online businesses. Whether it is in form of an eye-catching branded paper bag or durable designs suited for safe and efficient shipment, paper bag producers improve product protection while at the same time enhancing the whole customer experience. This has also made it possible for e commerce brands to reveal their identity while promoting commitment to sustainable practices.
Restraint: Stringent regulations on deforestation
Severe rules on deforestation result in a lack of natural material for paper production directly affecting the paper bag market. Paper is derived from wood pulp, acquired through tree cutting. As demands for paper have increased due to growing industries, deforestation has increased, and now, it poses severe problems such as greenhouse gas and ecological imbalances. In addition, frequent forest fires in some regions have reduced the supply of wood pulp, making it difficult for paper manufacturers. Due to these environmental hazards, various governments and regulatory bodies of different regions have imposed rigid rules and policies on controlling deforestation. These restrictions, although essential for sustainability, have made things difficult for paper bag manufacturers since they find it hard to acquire raw materials. Restrictions on logging, in addition to constraints on importing and exporting wood pulp, have further strangled the supply chain, thereby making production costly and slowing market growth.
Opportunity: Growing demand for sustainable packaging
There is an increasing demand for sustainable packaging solutions, highlighted by the growing emphasis on waste management. Packaging waste significantly contributes to global environmental issues. The solutions should protect the environment while retaining the functional benefits associated with packaging products. Sustainable packaging materials can be achieved through 100% recycled raw materials, streamlined production processes that reduce carbon footprints, and fostering a much-needed circular economy that promotes the extension of packaging material lifecycles and usability. A study conducted by Trivium Packaging surveyed over 15,000 consumers in Europe, North America, and South America, revealing that 86% of respondents were willing to pay more for sustainable packaging solutions. Consumers are increasingly favoring eco-friendly practices in the market. As a result, many companies have committed to using 100% recycled packaging within the next few years. Employing sustainable practices encourages consumers to buy from businesses and strengthens the brand’s reputation. Several major companies, such as Amcor, Unilever, and The Coca-Cola Company, aim to use 100% recyclable or biodegradable packaging by 2025. This collective endeavor highlights the increasing recognition by brands that sustainable practices are essential for meeting customer expectations and addressing environmental concerns.
Challenge: The higher cost of paper bags in comparison to plastic bags
As demand for eco-friendly packaging continues to rise, manufacturing costs also increase for using sustainable materials and implementing production that is environmentally friendly. Paper bags are the costliest among all these kinds because raw materials have to be responsibly sourced, and manufacturing requires a bit more complexity compared to the other types. While there has been a gradual consumer demand for environmentally friendly packaging, the price gap remains high between paper bags and conventional plastic bags. Therefore, it is essential that manufacturers manage to balance both the needs of sustainability with the economic factor, involving optimized processes for production, product designs cost effective, and seeking other raw materials. Here is the dilemma: making this "green" packaging accessible but not sacrificing its competitiveness as it loses its quality and environment appeal. This pricing issue is going to continue to limit the broader adoption of paper bags, mainly in cost-sensitive industries. So, the higher cost of paper bags compared to plastic bags is likely to stay a major challenge for growth in the market.
Paper Bags Market: COMMERCIAL USE CASES ACROSS INDUSTRIES
| COMPANY | USE CASE DESCRIPTION | BENEFITS |
|---|---|---|
 |
Collaborated with Amcor and CAM-Partena to develop Formpack Dessiflex Ultra, a moisture-resistant blister packaging designed for antibiotic tablets in high-humidity climates. The format features a high-barrier lidding foil with integrated moisture-absorbing properties, eliminating the need for separate desiccant sachets. | Improved product protection and extended shelf life in tropical conditions. Enhanced patient convenience through easier dose tracking. Boosted production safety and efficiency by removing glass bottles. Strengthened product authenticity and reduced contamination risk. |
Logos and trademarks shown above are the property of their respective owners. Their use here is for informational and illustrative purposes only.
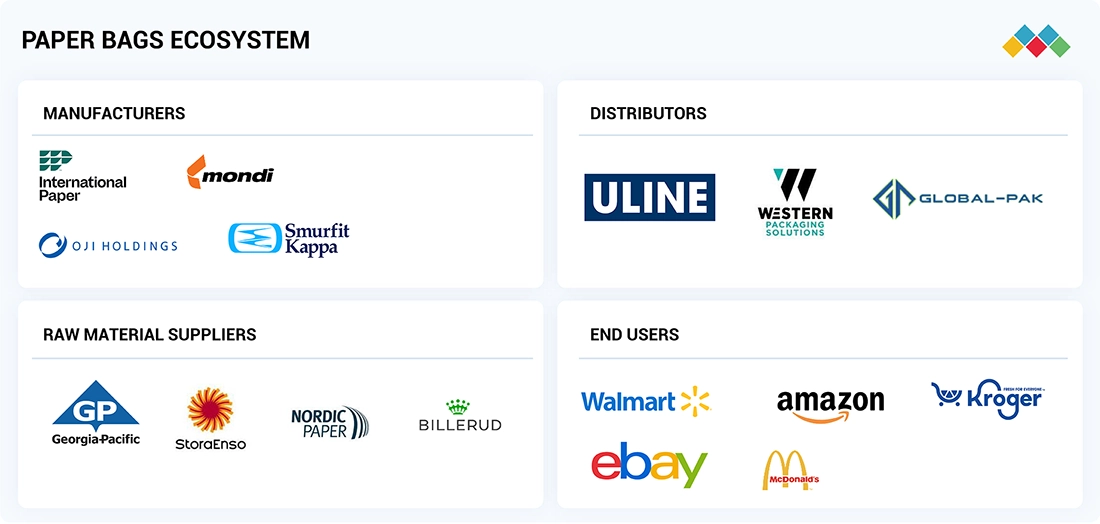
PAPER BAGS MARKET ECOSYSTEM
The paper bags market ecosystem comprises raw material suppliers, manufacturers, distributors, and end users. Raw material suppliers offer the primary inputs to be used in the manufacturing process. Manufacturers create sophisticated packaging solutions. Distributors help the supply chain products to reach the final consumers. Top-tier players/end users use paper bags market solutions/products to accomplish their packaging needs.
Logos and trademarks shown above are the property of their respective owners. Their use here is for informational and illustrative purposes only.
PAPER BAGS MARKET SEGMENTS
Source: Secondary Research, Interviews with Experts, MarketsandMarkets Analysis
Paper Bags Market, By Product Type
The flat-bottom paper bag market was topped, and its growth mainly harnessed the fast-increasing demand for a more sustainable type of packaging. With heightened awareness toward the environmental consequences of actions, consumers prefer to opt for the greener alternative over traditional packaging methods. Being stable and larger in capacity helps to make them ideal for holding something that is bulkier or much heavier. This feature is greatly valued in sectors such as retail, food, and e-commerce where durability and space efficiency are the most crucial requirements. Manufacturers are being compelled to direct their attention to the manufacturing of flat-bottom paper bags using recycled material or wood harvested from a sustainably managed forestry source. This goes in tandem with the larger pattern of moving towards more sustainable and environmentally conscious manufacturing methods. Such bags meet increased consumer demand for greener packaging and reduce the business's environmental footprint even further.
Paper Bags Market, By Material
Brown kraft paper bags accounted for the largest share since they proved to be the most robust and resistant bags with excellent environmentally friendly qualities. These bags come in the form of non-bleached wood pulps, which result in sustainable and biodegradable bags. These can align with the increasingly growing trend of concern regarding the use of environment-friendly alternatives in packaging because they carry heavy loads and are more dependable bags, like grocery bagging, food products, and retail purposes. Increasingly, businesses and consumers are seeking brown kraft paper bags as a substitute for plastic alternatives driven by stiff regulations against the use of plastics and rising environmental concerns. The solid structure of brown kraft paper makes it perfect for carrying heavy and bulky items. Its minimal processing makes the product even more appealing because it is a sustainable one. The ease with which they are made and used has seen widespread application across food & beverage, retail, and e-commerce.
Paper Bags Market, By Thicknes
The 2-ply paper bags have proven to be the most in-demand product in the market segment because of their ideal blend of strength, durability, and cost-effectiveness. Such bags are popularly chosen by businesses because they deliver the needed strength for all sorts of products-from grocery to clothing-without causing significant hikes in production costs. The two layers of material used in the construction of bags make them more robust, thereby giving added protection on the transportation and handling stages, which is a common requirement for many industries. Further, 2-ply paper bags are in high demand as they are more eco-friendly. They can be produced from recycled products or from pulp harvested sustainably, which appeals to companies looking for a more environmentally friendly packaging solution. The more people become conscious of the impact on the environment, the more they prefer sustainable products. The 2-ply design meets that requirement, offering an environmentally friendly option without compromising performance. 2-ply paper bags have been found to be suitable for retail, food, and e-commerce industries due to their flexibility and cost-effectiveness.
REGION
Asia Pacific region to record fastest market growth during forecast period
The Asia-Pacific region leads the paper bag market due to a high concentration of manufacturers and increased demand for sustainable packaging. It is contributed by countries such as China and India. China is going to be at the top due to its technological advancements and production innovations. These innovations have been able to provide better manufacturing efficiency, making it possible to produce greener packaging solutions, which has been one of the contributing factors to the growing need for paper bags in most industries. China has established leadership, especially in scale as concerns sustainability. Thus, from the investments being undertaken regarding modernization infrastructure within their manufacturing and its ecological friendliness of doing, the country ends up increasing the quality of its paper bags to meet the expectations placed all over the globe, concerned with sustainable packaging. India, with its huge and rapidly growing consumer market and manufacturing base, plays an important role in the market.
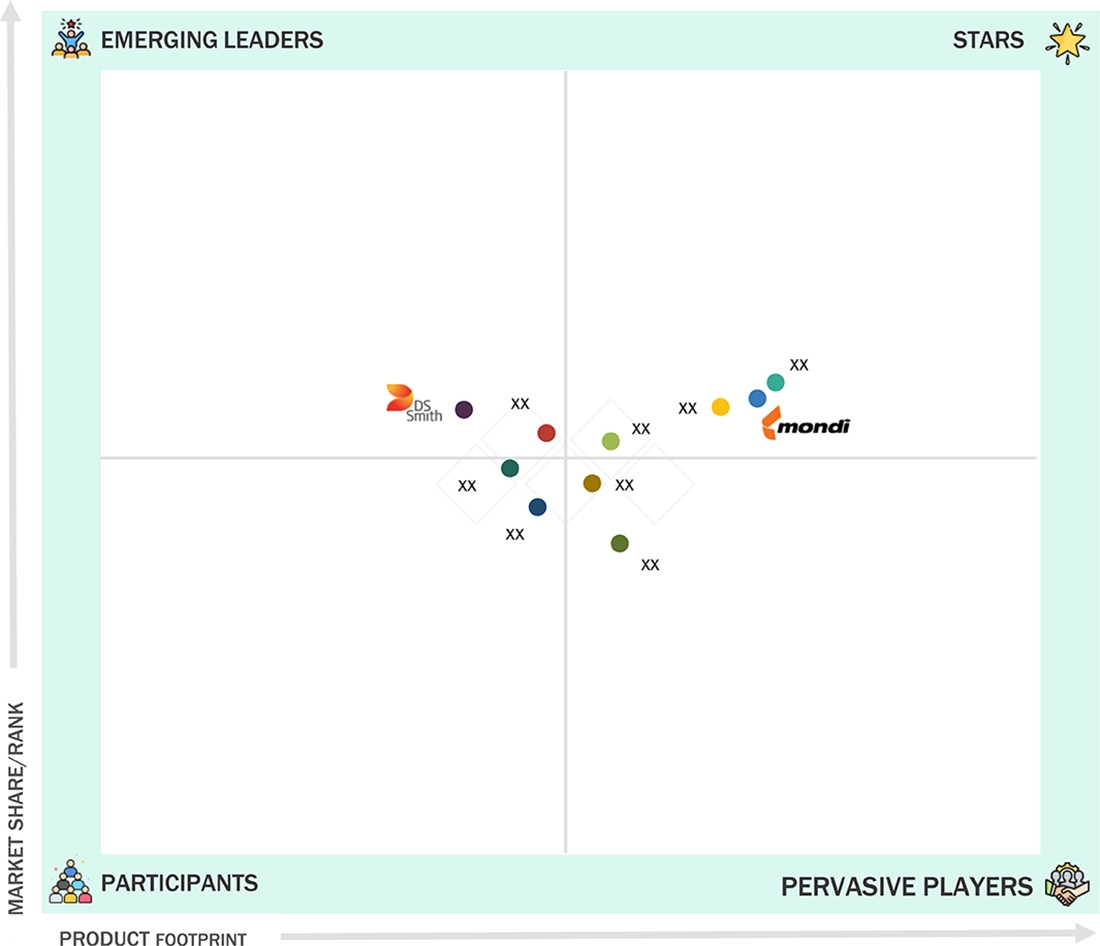
Paper Bags Market: COMPANY EVALUATION MATRIX
In the paper bags market matrix, Mondi Group (Star) leads the market. The company's prominence in the paper bag industry is anchored in its strong operational capabilities and commitment to innovation. Novolex (Emerging Leader) is gaining traction. The company operates five manufacturing plants dedicated to paper shopping bags across North America, allowing it to meet the needs of its customer base.
Source: Secondary Research, Interviews with Experts, MarketsandMarkets Analysis
KEY MARKET PLAYERS
MARKET SCOPE
| REPORT METRIC | DETAILS |
|---|---|
| Market Size in 2024 (Value) | USD 6.06 Billion |
| Market Forecast in 2029 (Value) | USD 7.81 Billion |
| Growth Rate | CAGR of 5.2% from 2024-2029 |
| Years Considered | 2024-2029 |
| Base Year | 2023 |
| Forecast Period | 2024-2029 |
| Units Considered | Value (USD Million), Volume (Kiloton) |
| Report Coverage | Revenue forecast, company ranking, competitive landscape, growth factors, and trends. |
| Segments Covered | By Material: Brown kraft paper and white kraft paper By Thickness: 1 PLY, 2 PLY, 3 PLY, and Over 3 PLY By Product Type: Sewn open mouth, pinched bottom open mouth, pasted valve, pasted open mouth, and flat bottom By End-use: Food service, retail, e-commerce, industrial, and other end-use |
| Regions Covered | North America, Asia Pacific, Europe, South America, the Middle East & Africa |
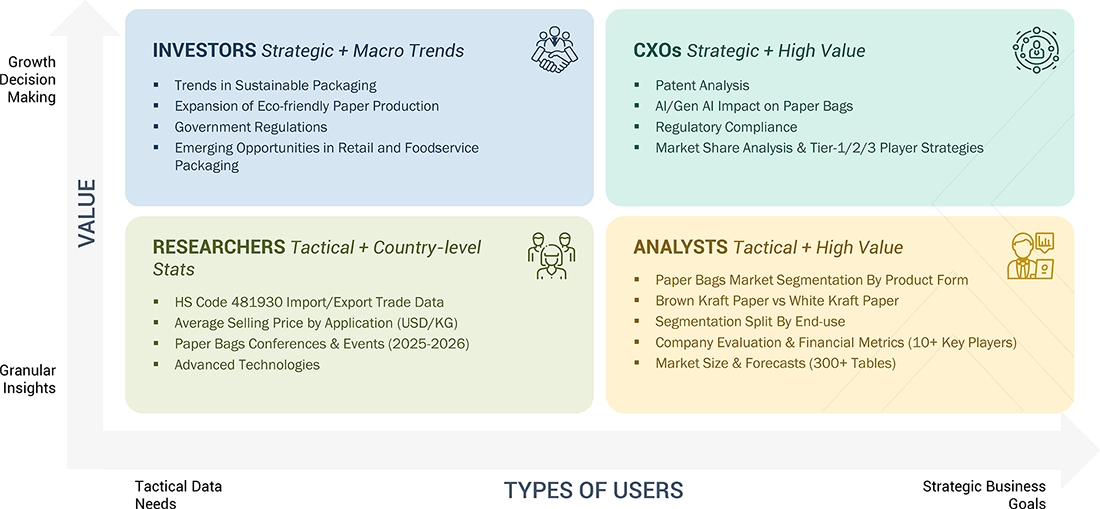
WHAT IS IN IT FOR YOU: Paper Bags Market REPORT CONTENT GUIDE
DELIVERED CUSTOMIZATIONS
We have successfully delivered the following deep-dive customizations:
| CLIENT REQUEST | CUSTOMIZATION DELIVERED | VALUE ADDS |
|---|---|---|
| APAC-based Paper Bags | Detailed company profiles of paper bags competitors (financials, product portfolio, production capacity) End-use mapping (food service, retail, e-commerce, industrial, others) Policy & regulation analysis | Identified & profiled 20+ paper bags producers across APAC Mapped demand trends across high-growth segments (food service, retail, industrial) |
RECENT DEVELOPMENTS
- July 2024 : Mondi announced a strategic partnership with CMC Packaging Automation, a global leader in automated packaging solutions. Mondi will serve as CMC's preferred kraft paper partner to develop innovative packaging solutions
- July 2024 : Smurfit Kappa completed its acquisition of WestRock, forming Smurfit WestRock, one of the world's largest packaging companies. The merger, announced in September 2023, enables the new entity to trade on the New York and London Stock Exchanges.
- February 2024 : Smurfit Kappa Group acquired Artemis Ltd., a Bag-in-Box packaging plant in Shumen, Bulgaria. Specializing in food and beverage packaging, Artemis produces bags, films, and caps for Bag-in-Box products.
- April 2024 : International Paper and DS Smith agreed on the terms of an all-share combination, creating a global leader in sustainable packaging. Each DS Smith share was valued at 415 pence, with International Paper offering 0.1285 shares per DS Smith share. The deal is expected to close by Q4 2024, pending regulatory approvals.
Table of Contents
 Exclusive indicates content/data unique to MarketsandMarkets and not available with any competitors.
Methodology
The study involved four major activities for estimating the current global size of the paper bags market. Exhaustive secondary research was conducted to gather information on the market, the peer market, and the parent market. The next step was to validate these findings, assumptions, and sizes with the industry experts across the value chain of paper bags through primary research. Both the top-down and bottom-up approaches were employed to estimate the overall size of the paper bags market. After that, market breakdown and data triangulation procedures were used to determine the size of different segments and sub-segments of the market.
Secondary Research
In the secondary research process, various secondary sources such as Business Standard, Bloomberg, World Bank, and Factiva were referred to, to identify and collect information for this study on the paper bags market. These secondary sources included annual reports, press releases & investor presentations of companies, white papers, certified publications, articles by recognized authors, regulatory bodies, trade directories, and databases.
Primary Research
Various primary sources from both the supply and demand sides of the paper bags market were interviewed to obtain qualitative and quantitative information. The primary sources from the supply side included industry experts, such as Chief Executive Officers (CEOs), vice presidents, marketing directors, sales professionals, and related key executives from various leading companies and organizations operating in the paper bags industry. The breakdown of the profiles of primary respondents is as follows:
Breakdown of Primary Interviews

Notes: Companies are classified based on their revenue–Tier 1 = >USD 7 billion, Tier 2 = USD 500 million to USD 7 billion, and Tier 3 = < USD 500 million.
Others include sales, marketing, and product managers.
To know about the assumptions considered for the study, download the pdf brochure
Market Size Estimation
Both the top-down and bottom-up approaches were used to estimate and validate the global size of the paper bags market. These approaches were also used extensively to estimate the size of various dependent segments of the market. The research methodology used to estimate the market size included the following details:
- The key players were identified through extensive secondary research.
- The industry’s supply chain and market size, in terms of value, were determined through primary and secondary research processes.
- All percentage shares, splits, and breakdowns were determined using secondary sources and verified through primary sources.
- All possible parameters that affect the markets covered in this research study were accounted for, viewed in extensive detail, verified through primary research, and analyzed to obtain the final quantitative and qualitative data.
- The research includes the study of reports, reviews, and newsletters of key industry players, along with extensive interviews with key officials, such as directors and marketing executives.

Data Triangulation
After arriving at the overall market size from the estimation process explained above, the total market was split into several segments and sub-segments. The data triangulation and market breakdown procedures were employed, wherever applicable, to complete the overall market engineering process and arrive at the exact statistics for all segments and sub-segments of the paper bags market. The data was triangulated by studying various factors and trends from both the demand- and supply-side.
In addition, the market size was validated by using both the top-down and bottom-up approaches. Then, it was verified through primary interviews. Hence, for every data segment, there are three sources—top-down approach, bottom-up approach, and expert interviews. The data were assumed to be correct when the values arrived at from the three sources matched.
Market Definition
A paper bag is a packaging solution made mainly from paper or paperboard, commonly used for carrying goods, groceries, and other items. Available in various shapes and sizes such as sewn open mouth, pinched bottom open mouth, pasted valve, pasted open mouth, and flat bottom, paper bags cater to different needs and preferences. They have become a popular alternative to plastic bags due to increasing environmental concerns and regulations focused on reducing plastic pollution.
Stakeholders
- Paper Bags Manufacturers
- Paper Bags Suppliers
- Raw Material Suppliers
- Research & development entities
- Industry associations and regulatory bodies
- End Users
Report Objectives
- To estimate and forecast the paper bags market, in terms of value and volume
- To provide detailed information about the major factors (drivers, restraints, opportunities, and challenges) influencing the market growth
- To define, describe, and forecast the market size, based on product type, thickness, material, end-use, and region
- To forecast the market size along with segments and submarkets, in key regions: North America, Europe, Asia Pacific (APAC), Middle East & Africa (MEA), and South America along with their key countries
- To strategically analyze micro markets, for individual growth trends, prospects, and their contribution to the total market
- To analyze growth opportunities in the market for stakeholders and provide details on the competitive landscape for market leaders
- To strategically profile key players and comprehensively analyze their market shares and core competencies
- To analyze competitive developments, such as merger & acquisition, expansion & investment, and agreements in the paper bags market
Key Questions Addressed by the Report
Need a Tailored Report?
Customize this report to your needs
Get 10% FREE Customization
Customize This ReportPersonalize This Research
- Triangulate with your Own Data
- Get Data as per your Format and Definition
- Gain a Deeper Dive on a Specific Application, Geography, Customer or Competitor
- Any level of Personalization
Let Us Help You
- What are the Known and Unknown Adjacencies Impacting the Paper Bags Market
- What will your New Revenue Sources be?
- Who will be your Top Customer; what will make them switch?
- Defend your Market Share or Win Competitors
- Get a Scorecard for Target Partners

Custom Market Research Services
We Will Customise The Research For You, In Case The Report Listed Above Does Not Meet With Your Requirements
Get 10% Free CustomisationTESTIMONIALS

We at Nissan Chemicals Corporation have been clients of MarketsandMarkets for more than a year now. We recently consulted MarketsandMarkets for a study, the team at MarketsandMarkets was extremely professional and organized. The business insights were very detailed and aligned well with our expectations that really helped us formulate the Business Plans and device new strategies for development themes. MarketsandMarkets offers a unique combination of expertise and dedicated engagement model. Their research findings have helped us in designing our Pricing Strategy which will make it easier for us to predict the future sales and profits for the next ten years. We look forward to working with MarketsandMarkets in the future.
VP of Strategy & New Business Development
Leading Specialty Chemical Company
The MarketsandMarkets Engagement Model, composed of both the Knowledge Store and advisory custom research, has greatly helped us in understanding our markets and making strategic decisions. The Knowledge Store is a fast way to allow everyone in our organization to understand more about most any market they are interested in. The ability to then get custom research done and get answers to specific strategic questions and market insight has been spectacular. The Markets and Markets team feel more like colleagues than vendors and their services have helped us change our culture where statements of things like growth opportunities and competitive position are always backed by industry research.

Rich Gibson,
Director, Corporate Strategy
Milliken & Company,
Leading Industrial Manufacturer of specialty chemical, floor covering, performance and protective textile materials, and healthcaremilliken.com
MarketsandMarkets is a trusted resource that helps us to better understand markets that are near-adjacencies-whether its technology, value chain or geography. Their Knowledge Store platform provides a dashboard of markets and their characteristics which is easy to use and saves us time.
Adam Shaw,
Market Development and Strategy Manager
AdvanSix Inc. USA,
An American Leader in Chemicalswww.advansix.com
The Knowledge Store from MarketsandMarkets is a valuable tool which has helped my team acquire greater insight in to the end markets that our business serves. This has enabled us to help our company build stronger strategies throughout our planning process.
TOSHIO KINOSHITA
Senior Chif Consultion Research & Consulting Division
Mitsubishi Chemical Research Corporation,
Leading Manufacturer of Chemical Productswww.mitsubishichem-res.co.jp/en/

We recently engaged with MarketsandMarkets for a study, the team not only clearly understood our business objectives but was also extremely professional in the way they handled the entire project. The study was efficiently conducted in a phase-wise manner, and the engagement model furnished us with high-quality business insights that far exceeded our expectations at each phase. We were especially happy that MarketsandMarkets could provide us with both, an English as well as a Japanese version of the study. A special thanks to the Analyst Team and Client Services Team, whose fluency in Japanese enhanced our comfort level, as we could converse with them in our preferred language.
Independent entrepreneurs
Arrow Precision
We approached MarketsandMarkets for study on Proppants Market, and their work exceeded our expectations. The study conducted was comprehensive and enabled us to view the market through the various dimensions. In addition, the team was extraordinarily responsive throughout the process and resolved our queries on time. I strongly recommend MarketsandMarkets and will certainly consider them for additional market assessments we will need in the future.
Global engineering company, Japan
Deputy Manager,
Strategic Planning OfficeThe high-quality insights shared by the MarketsandMarkets team helped us understand the pharmaceutical plant designers in a specific geography. It also captured the risks that we may likely face in communicating with our potential partners. The study would enable us identify partners, which would impact our future growth.


Growth opportunities and latent adjacency in Paper Bags Market