PFAS Waste Management Market

PFAS Waste Management Market by Treatment Technology (Destruction, Recycling & Recovery, Others), Service Type (On-site, Off-site), End-use Industry (Industrial, Commercial, Municipal), and Region - Global forecast to 2031




OVERVIEW
Source: Secondary Research, Interviews with Experts, MarketsandMarkets Analysis
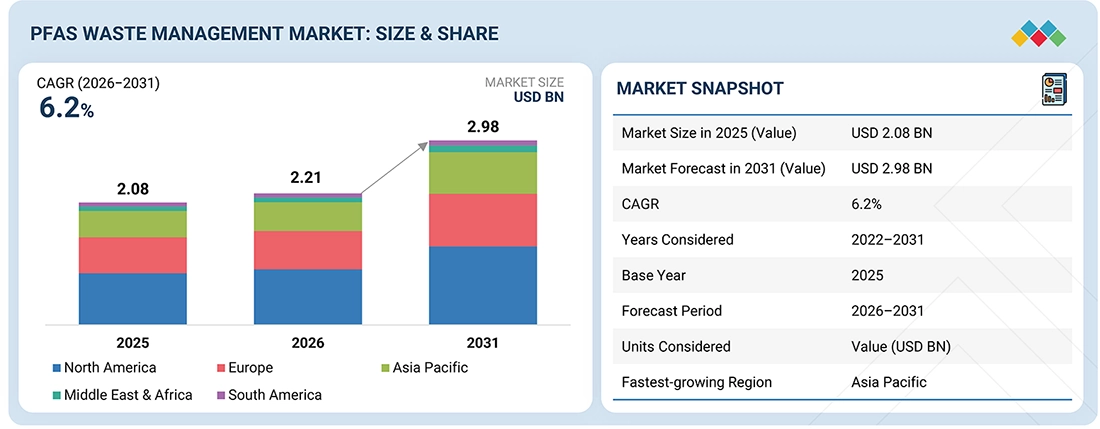
The PFAS waste management market is projected to reach USD 2.98 billion by 2031, up from USD 2.21 billion in 2026, at a CAGR of 6.2% from 2026 to 2031. The global PFAS waste management market is experiencing strong growth due to stringent environmental regulations, growing public awareness, technological advancement, government grants for PFAS research, and the need for proper management of treatment residuals generated during PFAS treatment. The chemicals manufacturing and water treatment sectors are implementing advanced destruction technologies to achieve compliance, decrease liabilities, and achieve their sustainability objectives.
KEY TAKEAWAYS
-
By RegionNorth America accounted for a ~42% share of the global PFAS waste management market in 2025.
-
By Treatment TechnologyBy treatment technology, the destruction systems segment is projected to grow at the fastest rate from 2026 to 2031.
-
By End-use IndustryBy end-use industry, the municipal segment accounted for a ~70% share of the overall market in 2025.
-
By Service TypeBy service type, the on-site segment is expected to dominate the market.
-
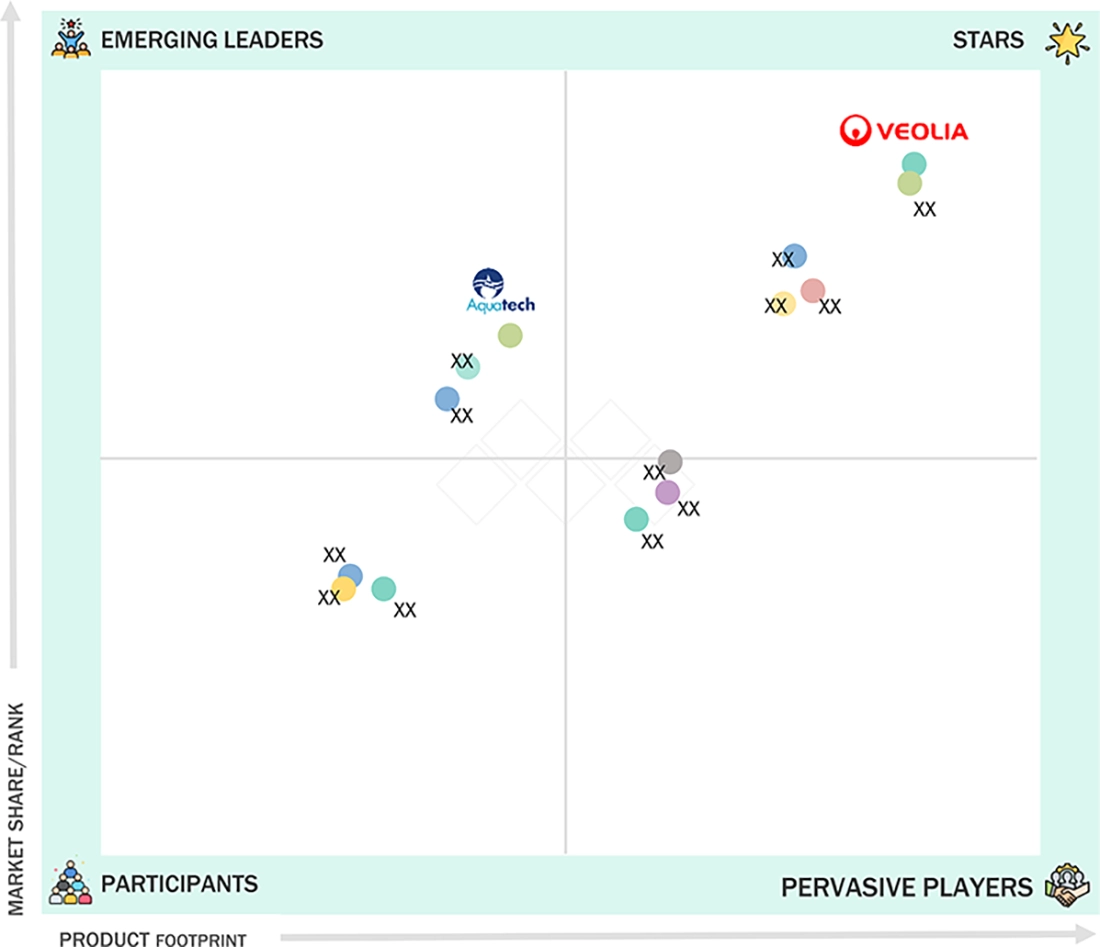
Competitive Landscape - Key PlayersCompanies such as Veolia (France), AECOM (US), and Clean Earth (US) are identified as some of the star players in the PFAS waste management market (global), given their strong market share and product footprint.
-
Competitive Landscape - Startups/SMEsCompanies such as Enviropacific Services Limited, Claros Technologies, and Aclarity, among others, have distinguished themselves among startups and SMEs by securing strong footholds in specialized niche areas, underscoring their potential as emerging market leaders.
The global PFAS waste management market is growing due to stringent environmental regulations, rising public awareness, technological advancements, and government grants for PFAS research and remediation. North America is leading the PFAS waste management market, followed by Europe with strict REACH norms. Asia Pacific is emerging as the fastest-growing region due to continuous industrial expansion, growing public awareness, and stringent environmental regulations.
TRENDS & DISRUPTIONS IMPACTING CUSTOMERS' CUSTOMERS
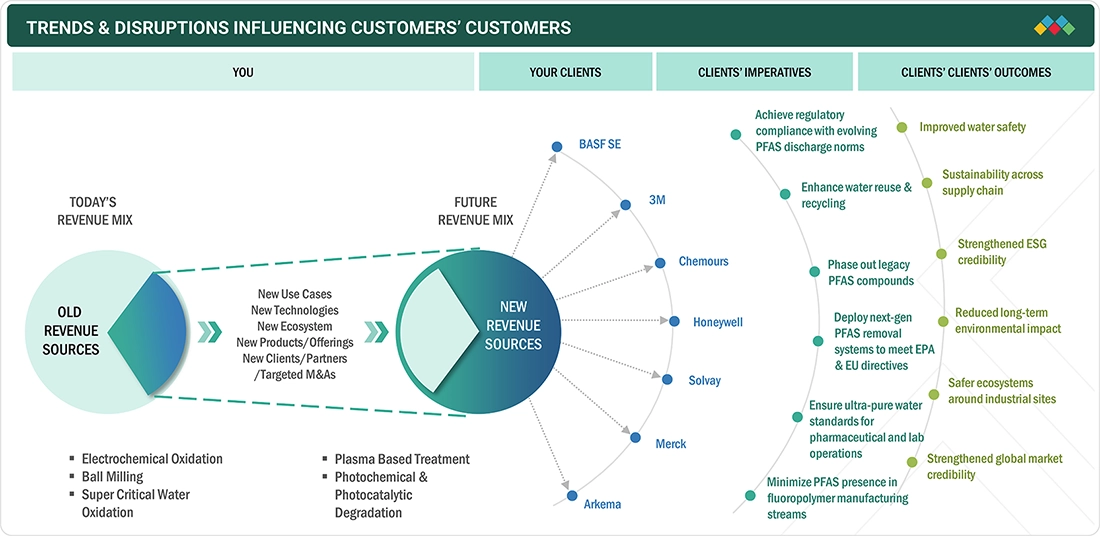
Changes in customer trends or disruptions impact consumers’ businesses. These shifts impact the revenues of end users. Consequently, the revenue impact on end users is expected to affect the revenues of PFAS waste management technology suppliers, which in turn, impacts the revenues of PFAS waste management technology manufacturers.
Source: Secondary Research, Interviews with Experts, MarketsandMarkets Analysis
MARKET DYNAMICS

Level
-
Increasing regulatory scrutiny and tightening of environmental regulations regarding PFAS contamination

-
Rising litigation and liability cost for polluters


Level
-
Expensive and complex process

-
Limited availability of trained professional


Level
-
Significant government funding and support for PFAS research, development, and filtration efforts

-
Significant potential to expand globally


Level
-
Development of practical and scalable technologies for semiconductor industry.

Source: Secondary Research, Interviews with Experts, MarketsandMarkets Analysis
Driver: Increasing regulatory scrutiny and tightening of environmental regulations regarding PFAS contamination
Stringent regulatory pressure and strengthened environmental standards against PFAS pollution are fueling the growth of the PFAS waste management industry. PFAS are synthetic chemicals used across several industrial and consumer goods to provide heat, water, and oil resistance. However, their persistence in the environment and human tissue has led to highly critical ailments such as cancer, immune impairment, and other health issues. Consequently, several regulatory bodies are instituting tighter controls to reduce exposure to PFAS, particularly in drinking water. In April 2024, the US EPA issued a rule adding two harmful PFAS chemicals—PFOA and PFOS—to the list of hazardous substances under the Comprehensive Environmental Response, Compensation, and Liability Act (CERCLA). This action promotes transparency and accountability in PFAS cleanup activities. The EPA also issued an enforcement discretion policy to ensure that cleanup burdens address PFAS pollution. Through collaboration with the General Services Administration (GSA), the EPA introduced modifications requiring that cleaning products used in federal facilities be PFAS-free and that environmentally certified products—such as those carrying EPA’s Safer Choice or GreenSeal labels—be used. These federal initiatives, combined with rising public awareness and increasing pressure for industries to meet PFAS discharge limits, are driving demand for efficient PFAS waste management technologies and positioning the market for continued innovation and growth.
Restraint: Expensive and complex process
The high operational expenses and extensive processing requirements of PFAS destruction systems create a major obstacle to their widespread application across end-use industries such as chemical, automotive, coatings, and others. The successful destruction of PFAS contaminants from water and soil requires advanced treatment systems such as incineration, electrochemical oxidation, supercritical water oxidation, ball milling, and others. The system demonstrates operational efficiency while incurring high capital costs through its establishment and operational requirements to treat extensive contaminated water stores and achieve total destruction of PFAS. The deployment of these systems demands specialized equipment, including energy-intensive components and specialized materials, and requires trained staff to operate them. Industry operators encounter both financial challenges and operational difficulties, which prevent them from using complete destruction systems. Also, the technical complexity limits scalability and slows adoption, particularly for smaller industries and municipalities with limited budgets. As a result, despite growing demand, the widespread implementation of PFAS destruction solutions is often constrained by economic and operational challenges.
Opportunity: Significant government funding and support for PFAS research, development, and filtration efforts
Increasing government investment and institutional support to remove PFAS from the waste stream creates good opportunities for many industry players. Governments are boosting research and remediation funding to address the significant environmental risks and health hazards posed by PFAS. The US Environmental Protection Agency (EPA) has dedicated USD 50 million to combat PFAS pollution nationwide. The funding supports both environmental cleanup work and the development of advanced technologies to improve PFAS detection and destruction capabilities. PFAS, or per- and polyfluoroalkyl substances, consist of almost 15000 chemical compounds that remain in the environment because they possess permanent chemical properties that allow them to build up in air, water, and soil. The National Institute of Environmental Health Sciences reports that people become exposed to these chemicals through their contact with contaminated drinking water, food, and consumer goods. Government-sponsored programs are not only accelerating technological innovation but also strengthening the regulatory and financing environment for companies and researchers involved in PFAS destruction.
Challenge: Development of practical and scalable technologies for semiconductor industry
A major challenge in the PFAS waste management market is developing practical, scalable technologies for the semiconductor industry. Semiconductor manufacturing relies heavily on PFAS due to their unique chemical properties, and eliminating their use is currently not feasible given the complex processes and long development timelines for alternatives. Managing PFAS waste in this sector is particularly difficult because waste streams often contain PFAS at very low concentrations (parts-per-billion levels) within highly complex chemical mixtures, including hundreds of compounds and ultrashort-chain PFAS. Additionally, facilities generate extremely large volumes of waste—up to 35,000 m³ per day—across gas, liquid, and solid phases, while facing constraints related to limited space and system redesign. Developing effective solutions requires technologies that can operate under challenging real-world conditions, such as variable pH, high ionic strength, and short contact times. Integrating these into compact, high-performance systems and validating them through industrial collaboration is essential for achieving cost-effective and scalable PFAS management, making this a critical yet complex area for innovation.
PFAS WASTE MANAGEMENT MARKET: COMMERCIAL USE CASES ACROSS INDUSTRIES
| COMPANY | USE CASE DESCRIPTION | BENEFITS |
|---|---|---|
 |
Implementation of advanced PFAS destruction systems for wastewater from specialty chemicals and coatings production | Achieved regulatory compliance with EU PFAS limits |
 |
Deployment of PFAS removal technologies for process water at fluorochemical plants | Strengthened environmental stewardship and ESG profile |
 |
Adoption of industrial PFAS destruction technologies for textile dyeing and finishing wastewater treatment | Reduced environmental and social risk exposure |
Logos and trademarks shown above are the property of their respective owners. Their use here is for informational and illustrative purposes only.
MARKET ECOSYSTEM
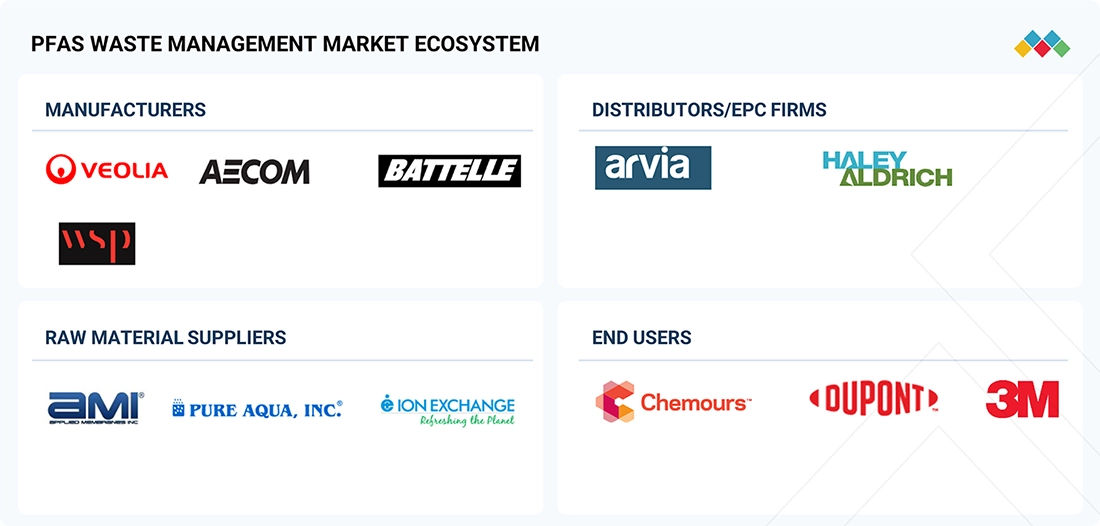
The PFAS waste management ecosystem analysis involves identifying and evaluating the interconnected relationships among key stakeholders, including raw material suppliers, equipment suppliers, manufacturers, distributors, and end users. Raw material suppliers provide essential inputs such as filters, electrodes, and other materials to PFAS waste management technology manufacturers. Distributors and suppliers play a critical role in connecting manufacturers with various end-use industries, helping to streamline the supply chain and improve operational efficiency and profitability.
Logos and trademarks shown above are the property of their respective owners. Their use here is for informational and illustrative purposes only.
MARKET SEGMENTS
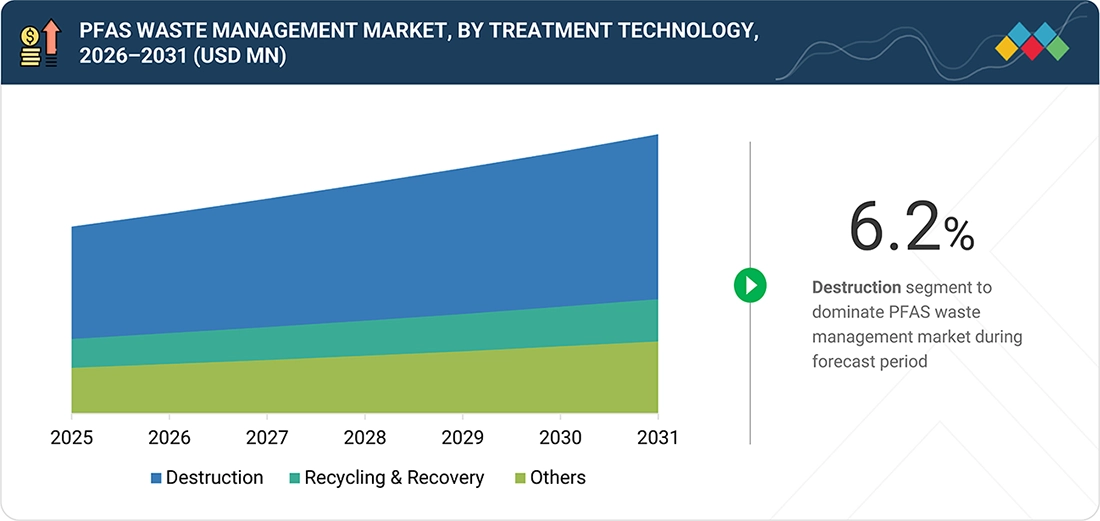
Source: Secondary Research, Interviews with Experts, MarketsandMarkets Analysis
PFAS Waste Management Market, By Service Type
The on-site service segment is emerging as the dominant segment in the PFAS waste management market, strongly driven by the growing need for immediate, cost-effective, and environmentally friendly treatment solutions. On-site treatment involves deploying technologies directly at the contamination source, enabling industries to treat PFAS-containing waste streams without transporting them to external PFAS waste management facilities. This approach reduces logistical complexity, lowers liability risks, and ensures faster compliance with stricter environmental regulations. Additionally, increasing regulatory pressure and the high cost associated with off-site disposal are encouraging industries to adopt on-site solutions, contributing to the segment’s strong market growth. Many companies are offering on-site PFAS destruction service. DROP technology, developed by Veolia, is a new, patented technology effective at achieving up to 99.99% destruction of targeted PFAS in waste streams. DE-FLUORO, developed by AECOM, is an environmentally friendly, cost-effective technology that destroys PFAS at contaminated sites.
PFAS Waste Management Market, By End-use Industry
The industrial segment accounted for the major share of the overall PFAS waste management market. Stringent government regulations, growing public awareness, the need for proper management of treatment residuals generated during PFAS treatment, and growing investment of major industry players in wastewater treatment to comply with stringent environmental regulations are some of the major drivers of the PFAS waste management market. Industries such as chemical, petrochemical, pharmaceutical, and textile use PFAS for their unique properties, including chemical resistance, thermal stability, and water- and oil-repellency, in processes such as coatings, surfactants, and specialty formulations. These substances are commonly used in manufacturing, as processing aids, in stain-resistant textiles, in non-stick coatings, and in high-performance chemical production. The growth of chemical, petrochemical, pharmaceutical, textile, and other end-use industries is driving demand for effective wastewater treatment facilities to comply with discharge requirements. These major end-use industries increasingly adopt advanced destruction solutions, such as electrochemical oxidation, supercritical water oxidation, incineration, and others, to treat contaminants, including PFAS, heavy metals, and organic pollutants.
REGION
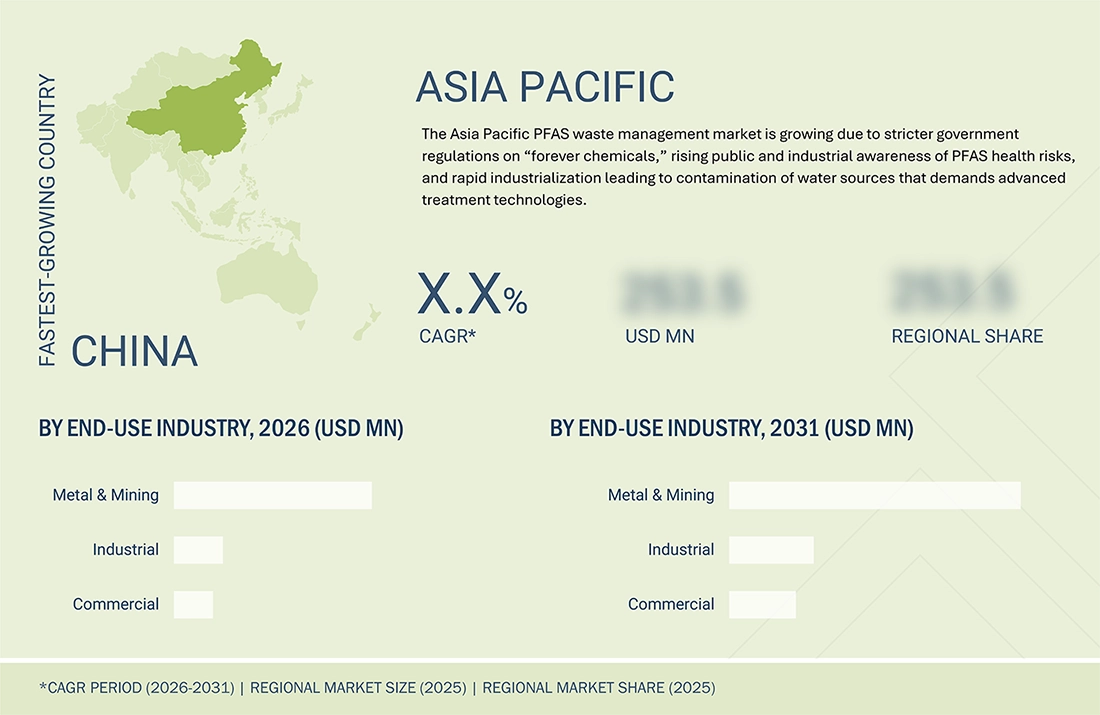
Asia Pacific to be fastest-growing region in global PFAS waste management market during forecast period
The PFAS waste management market in the Asia Pacific region (APAC) is experiencing strong development due to robust industrial growth, growing public awareness of health risks associated with PFAS contamination, and the need for proper management of treatment residuals generated during PFAS treatment. The extensive use of PFAS chemicals across various applications is causing PFAS contamination to increase in China, India, Japan, Australia, and South Korea. The public's growing concern about health risks linked to PFAS is leading regional governments to implement more stringent water quality standards, wastewater treatment requirements, and PFAS discharge requirements. Public utilities and private industries are investing heavily in advanced PFAS destruction technologies because infrastructure expansion and stronger Environmental, Social, and Governance (ESG) commitments create a need for better waste treatment systems. The combination of government regulations, increased demand for fresh water, and advancements in industry accountability has established APAC as a fast-growing market for PFAS waste management systems.
PFAS WASTE MANAGEMENT MARKET: COMPANY EVALUATION MATRIX
In the PFAS waste management market matrix, Veolia (Star), a France-based company, leads the market through its high-quality PFAS waste management technology, namely DROP technology, which has extensive applications across various end-use industries, including industrial, municipal, and others. Aquatech (Emerging Leader) is gaining traction with its technological advancements in PFAS waste management.
Source: Secondary Research, Interviews with Experts, MarketsandMarkets Analysis
KEY MARKET PLAYERS
- Veolia (France)
- AECOM (US)
- WSP (Canada)
- Clean Earth (US)
- Battelle Memorial Institute (US)
- Aquatech (US)
- Jacobs (US)
- Ovivo Water Inc. (Canada)
- Indaver (Belgium)
- Gradient. (US)
- Aquagga (US)
- Ion Exchange (India)
- Calgon Carbon Corporation (US)
- Aclarity (US)
- Axine Water Technologies. (US)
- Onvector LLC (US)
MARKET SCOPE
| REPORT METRIC | DETAILS |
|---|---|
| Market Size in 2025 (Value) | USD2.08 Billion |
| Market Forecast in 2031 (Value) | USD 2.98 Billion |
| Growth Rate | CAGR of 6.2% from 2026-2031 |
| Years Considered | 2022-2031 |
| Base Year | 2025 |
| Forecast Period | 2026-2031 |
| Units Considered | Value (USD Million/Billion) |
| Report Coverage | Revenue forecast, company ranking, competitive landscape, growth factors, and trends |
| Segments Covered |
|
| Regions Covered | North America, Asia Pacific, Europe, South America, Middle East & Africa |
WHAT IS IN IT FOR YOU: PFAS WASTE MANAGEMENT MARKET REPORT CONTENT GUIDE
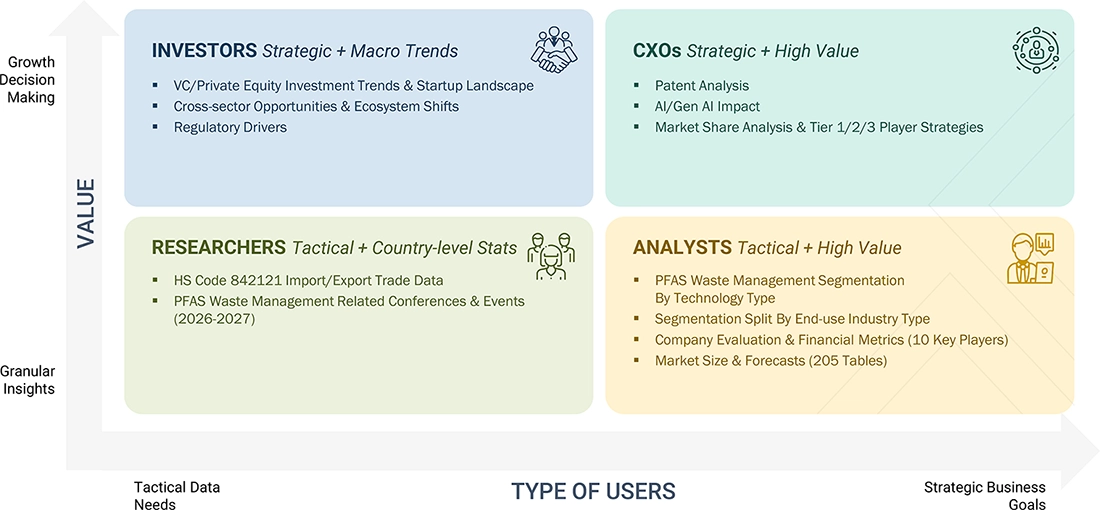
DELIVERED CUSTOMIZATIONS
We have successfully delivered the following deep-dive customizations:
| CLIENT REQUEST | CUSTOMIZATION DELIVERED | VALUE ADDS |
|---|---|---|
| Leading PFAS Waste Management Technologies Supplier |
|
Supported go-to-market strategy and positioning vs competitors |
| Country-level insights for high-growth regions | Provided detailed market sizing and forecasts for North America and Asia Pacific markets | Helped the client identify region-specific growth hotspots and investment opportunities |
| Identify emerging PFAS destruction technologies | Conducted technology scouting and feasibility analysis | Supported investment decisions and innovation roadmap for clients |
| Evaluate regulatory compliance for new market entry | Compiled local emission and safety & efficiency standards per country | Ensured smooth market entry and minimized legal risks |
RECENT DEVELOPMENTS
- June 2025 : Veolia announced a groundbreaking technological advancement in Europe to combat per- and polyfluoroalkyl substances (PFAS), widely known as “forever chemicals.” Developed at the Group’s global research centers, its patented Drop technology achieves up to 99.9999% removal efficiency for several targeted PFAS compounds. Veolia is now rolling out this patented solution across 20 hazardous-waste incineration lines located in France, Germany, Spain, Poland, the United Kingdom, Switzerland, and Hungary, marking a major step forward in eliminating persistent chemical pollutants.
- April 2025 : Clean Earth expanded its capabilities by enhancing its regulatory compliance services, offering customers comprehensive support to meet regulatory requirements. The expanded service portfolio includes reporting and compliance assistance, auditing and compliance assessments, and specialized training, helping organizations strengthen adherence to environmental and regulatory standards.
- June 2024 : AECOM, a globally trusted infrastructure consulting firm, and Aquatech, a leader in water and process technology, partnered to fast-track the deployment of per- and polyfluoroalkyl substances (PFAS) destruction technology. This collaboration combined AECOM’s top-ranked water and environmental practice, along with its innovative DE-FLUORO PFAS destruction technology, and Aquatech’s expertise in process and electrochemical technology, as well as its proven track record in scaling end-to-end technology solutions and services. The combined strengths of these two industry leaders will help accelerate DE-FLUORO as a premier solution for PFAS destruction.
- January 2024 : Clean Earth launched Resolve, a new program that offers a toolbox of innovative solutions to treat and remediate PFAS, and a website detailing news, updates, and guidance on PFAS in the US.
- June 2023 : Veolia Water Technologies expanded its mobile water services fleet in China by adding new modular trailer-mounted reverse osmosis (RO) systems. This expansion enhanced the company's range of mobile solutions tailored for the Chinese market. By integrating the latest modular trailer-mounted RO units, Veolia reinforces its commitment to delivering innovative water treatment solutions to its customers in China. Alongside the RO units, the fleet also features filtration, ultrafiltration, and deionization systems. The addition of these new RO mobile units will boost capacity to meet the increasing demand for dependable and efficient water treatment solutions across China.
- September 2022 : WSP announced the acquisition of the environment & infrastructure business of John Wood. With this, WSP expanded its environmental leadership. This move will also enable the company to further seize opportunities in the fast-growing environmental and water sectors.
Table of Contents
 Exclusive indicates content/data unique to MarketsandMarkets and not available with any competitors.
Methodology
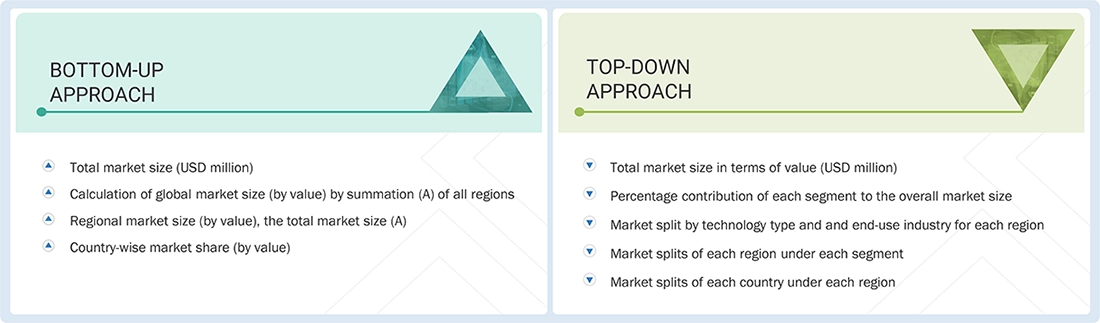
The study involves two major activities in estimating the current market size for the PFAS waste management market. Exhaustive secondary research was done to collect information on the market, peer market, and parent market. The next step was to validate these findings, assumptions, and sizing with industry experts across the value chain through primary research. Both top-down and bottom-up approaches were employed to estimate the complete market size. Following this, market breakdown and data triangulation were employed to determine the market size of segments and subsegments.
Secondary Research
Secondary sources referred to for this research study include financial statements of companies offering PFAS waste management and information from various trade, business, and professional associations. Secondary research has been used to obtain critical information about the industry's value chain, the total pool of key players, market classification, and segmentation according to industry trends to the bottom-most level and regional markets. Secondary data was collected and analyzed to arrive at the overall size of the PFAS waste management market, which was validated through primary respondents.
Primary Research
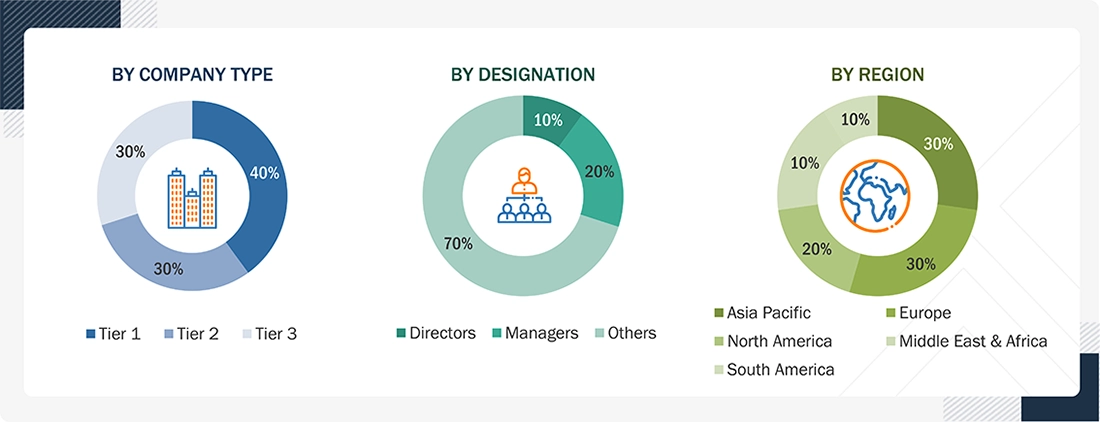
Extensive primary research was conducted after obtaining information regarding the PFAS waste management market scenario through secondary research. Several primary interviews were conducted with market experts from both the demand and supply sides across major countries of North America, Europe, Asia Pacific, the Middle East & Africa, and South America. Primary data was collected through questionnaires, emails, and telephonic interviews. The primary sources from the supply side included various industry experts, such as Chief X Officers (CXOs), Vice Presidents (VPs), Directors from business development, marketing, product development/innovation teams, and related key executives from PFAS waste management industry vendors; material providers; distributors; and key opinion leaders. Primary interviews were conducted to gather insights, including market statistics, revenue data from products and services, market breakdowns, market size estimations, market forecasting, and data triangulation. Primary research also helped in understanding the various trends related to material, sources, manufacturing processes, applications, and regions. Stakeholders from the demand side, such as CIOs, CTOs, CSOs, and installation teams of the customer/end users who are seeking PFAS waste management, were interviewed to understand the buyer's perspective on the suppliers, products, component providers, and their current usage of PFAS waste management technologies and future outlook of their business, which will affect the overall market.
Breakup of Primary Research:
To know about the assumptions considered for the study, download the pdf brochure
Market Size Estimation
The research methodology used to estimate the size of the PFAS waste management market includes the following details. The sizing of the market was undertaken from the demand side. The market was upsized based on the demand for PFAS waste management products in different applications at a regional level. Such procurements provide information on the demand aspects of the PFAS waste management industry for each end-use industry. For each end-use industry, all possible segments of the PFAS waste management market were integrated and mapped.
Data Triangulation
After arriving at the overall size from the market size estimation process explained above, the total market was split into several segments and subsegments. The data triangulation and market breakdown procedures explained below were implemented, wherever applicable, to complete the overall market engineering process and arrive at the exact statistics for various market segments and subsegments. The data was triangulated by studying various factors and trends from the demand and supply sides. Along with this, the market size was validated using both the top-down and bottom-up approaches.
Market Definition
The PFAS waste management market includes all technologies, media, systems, and related services that remove PFAS compounds from water and environmental media to achieve strict regulatory standards that protect public health and allow safe discharge or reuse. The solution includes various destruction, solidification, and recycling & recovery technologies (thermal destruction, electrochemical oxidation, supercritical water oxidation, and complementary technologies) and integration and support services that cover municipal drinking water, industrial wastewater, and groundwater remediation.
Stakeholders
- PFAS Waste Management Technology Manufacturers
- PFAS Waste Management Technology Distributors and Suppliers
- Universities, Governments, and Research Organizations
- Associations and Industrial Bodies
- R&D Institutes
- Environmental Support Agencies
- Investment Banks and Private Equity Firms
- Research and Consulting Firms
Report Objectives
- To define, describe, and forecast the PFAS waste management market size in terms of value
- To provide detailed information regarding the key factors, such as drivers, restraints, opportunities, and challenges influencing market growth
- To analyze and project the global PFAS waste management market by technology, service type, end-use industry, and region
- To forecast the market size concerning five main regions (along with country-level data), namely, North America, Europe, Asia Pacific, the Middle East & Africa, and South America, and analyze the significant region-specific trends
- To strategically analyze micromarkets with respect to individual growth trends, prospects, and contributions of the submarkets to the overall market
- To analyze the market opportunities and the competitive landscape for stakeholders and market leaders
- To assess recent market developments and competitive strategies, such as agreements, contracts, acquisitions, partnerships & collaboration, and new product developments/new product launches, to draw the competitive landscape
- To strategically profile the key market players and comprehensively analyze their core competencies


Personalize This Research
- Triangulate with your Own Data
- Get Data as per your Format and Definition
- Gain a Deeper Dive on a Specific Application, Geography, Customer or Competitor
- Any level of Personalization
Let Us Help You
- What are the Known and Unknown Adjacencies Impacting the PFAS Waste Management Market
- What will your New Revenue Sources be?
- Who will be your Top Customer; what will make them switch?
- Defend your Market Share or Win Competitors
- Get a Scorecard for Target Partners

Custom Market Research Services
We Will Customise The Research For You, In Case The Report Listed Above Does Not Meet With Your Requirements
Get 10% Free CustomisationTESTIMONIALS

We at Nissan Chemicals Corporation have been clients of MarketsandMarkets for more than a year now. We recently consulted MarketsandMarkets for a study, the team at MarketsandMarkets was extremely professional and organized. The business insights were very detailed and aligned well with our expectations that really helped us formulate the Business Plans and device new strategies for development themes. MarketsandMarkets offers a unique combination of expertise and dedicated engagement model. Their research findings have helped us in designing our Pricing Strategy which will make it easier for us to predict the future sales and profits for the next ten years. We look forward to working with MarketsandMarkets in the future.
VP of Strategy & New Business Development
Leading Specialty Chemical Company
The MarketsandMarkets Engagement Model, composed of both the Knowledge Store and advisory custom research, has greatly helped us in understanding our markets and making strategic decisions. The Knowledge Store is a fast way to allow everyone in our organization to understand more about most any market they are interested in. The ability to then get custom research done and get answers to specific strategic questions and market insight has been spectacular. The Markets and Markets team feel more like colleagues than vendors and their services have helped us change our culture where statements of things like growth opportunities and competitive position are always backed by industry research.

Rich Gibson,
Director, Corporate Strategy
Milliken & Company,
Leading Industrial Manufacturer of specialty chemical, floor covering, performance and protective textile materials, and healthcaremilliken.com
MarketsandMarkets is a trusted resource that helps us to better understand markets that are near-adjacencies-whether its technology, value chain or geography. Their Knowledge Store platform provides a dashboard of markets and their characteristics which is easy to use and saves us time.
Adam Shaw,
Market Development and Strategy Manager
AdvanSix Inc. USA,
An American Leader in Chemicalswww.advansix.com
The Knowledge Store from MarketsandMarkets is a valuable tool which has helped my team acquire greater insight in to the end markets that our business serves. This has enabled us to help our company build stronger strategies throughout our planning process.
TOSHIO KINOSHITA
Senior Chif Consultion Research & Consulting Division
Mitsubishi Chemical Research Corporation,
Leading Manufacturer of Chemical Productswww.mitsubishichem-res.co.jp/en/

We recently engaged with MarketsandMarkets for a study, the team not only clearly understood our business objectives but was also extremely professional in the way they handled the entire project. The study was efficiently conducted in a phase-wise manner, and the engagement model furnished us with high-quality business insights that far exceeded our expectations at each phase. We were especially happy that MarketsandMarkets could provide us with both, an English as well as a Japanese version of the study. A special thanks to the Analyst Team and Client Services Team, whose fluency in Japanese enhanced our comfort level, as we could converse with them in our preferred language.
Independent entrepreneurs
Arrow Precision
We approached MarketsandMarkets for study on Proppants Market, and their work exceeded our expectations. The study conducted was comprehensive and enabled us to view the market through the various dimensions. In addition, the team was extraordinarily responsive throughout the process and resolved our queries on time. I strongly recommend MarketsandMarkets and will certainly consider them for additional market assessments we will need in the future.
Global engineering company, Japan
Deputy Manager,
Strategic Planning OfficeThe high-quality insights shared by the MarketsandMarkets team helped us understand the pharmaceutical plant designers in a specific geography. It also captured the risks that we may likely face in communicating with our potential partners. The study would enable us identify partners, which would impact our future growth.
- US PFAS Waste Management Market
- Canada PFAS Waste Management Market
- Mexico PFAS Waste Management Market
- Germany PFAS Waste Management Market
- France PFAS Waste Management Market
- UK PFAS Waste Management Market
- China PFAS Waste Management Market
- Japan PFAS Waste Management Market
- Australia PFAS Waste Management Market
- South Africa PFAS Waste Management Market
- Rest Of Europe PFAS Waste Management Market
- Rest Of Asia Pacific PFAS Waste Management Market
- GCC Countries PFAS Waste Management Market






Growth opportunities and latent adjacency in PFAS Waste Management Market