
Pharmaceutical Metal Detector Market: Growth, Size, Share, and Trends

Pharmaceutical Metal Detector Market by Product (Tablet, Capsule, Powder, Liquid Detectors), Technology (Magnetic Field, Multi-frequency Detector, X-ray Inspection with Metal Detectors), and Application (Packaging Detection, QC) - Global Forecast to 2030


OVERVIEW
Source: Secondary Research, Interviews with Experts, MarketsandMarkets Analysis
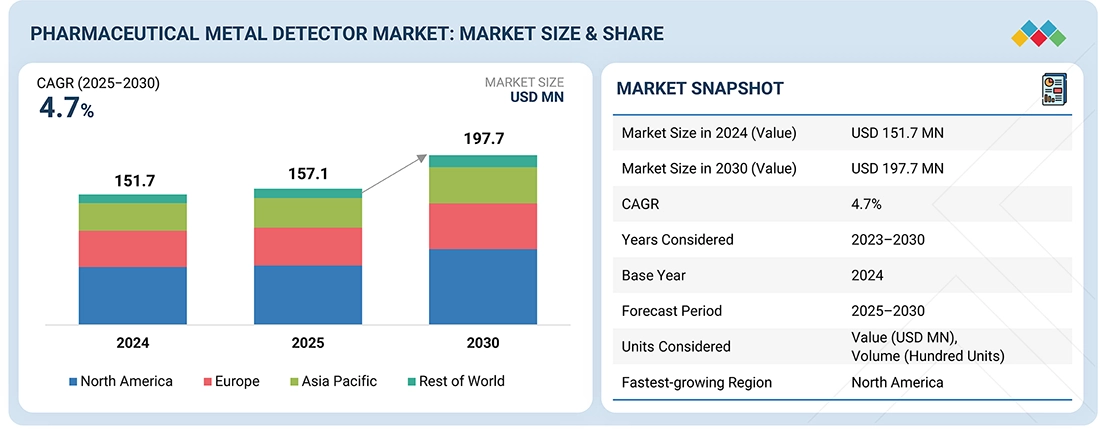
The global pharmaceutical metal detector market is projected to reach USD 197.7 million by 2030 from USD 157.1 million in 2025, registering a CAGR of 4.7% during the forecast period. The growth is primarily driven by stringent regulatory requirements for product safety and the rising demand for contamination-free pharmaceutical products. Increasing cases of product recalls and quality-related concerns have compelled manufacturers to adopt advanced detection technologies. The growing integration of automated and intelligent metal detection systems and innovations in sensor sensitivity and real-time monitoring are further expected to boost market expansion. Emphasis on compliance with GMP and FDA standards is also encouraging pharmaceutical companies to invest in high-precision inspection equipment. Moreover, industry players are increasingly engaging in product innovation and strategic collaborations to enhance their competitive edge and ensure process reliability.
KEY TAKEAWAYS
-
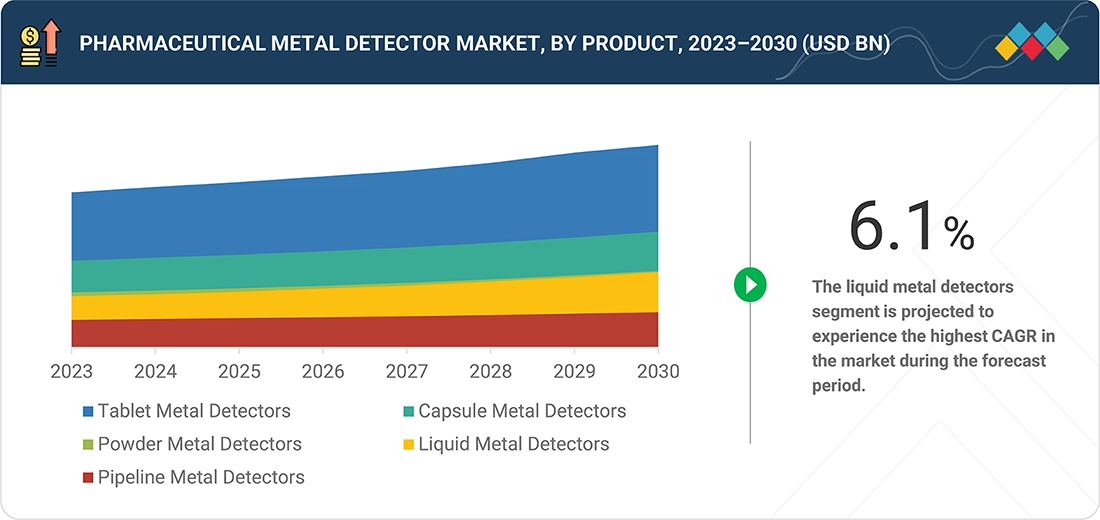
By ProductsThe tablet metal detectors segment has accounted for the largest share in the market in 2024. This segment holds a large market share due to its integration with tablet compression machines and increasing regulatory inspections for common dosage forms.
-
By technologyThe magnetic field detectors segment has accounted for the largest market share in 2024, largely due to the compatibility of magnetic field detectors with a broad range of products and packaging materials.
-
By applicationThe compliance segment is expected to witness the fastest CAGR during the forecast period, driven by stricter global regulatory requirements and more frequent inspections across pharmaceutical facilities. The push for harmonized safety standards has made metal detectors essential for ensuring audit readiness and continuous regulatory adherence.
-
By end usersThe pharmaceutical companies segment has accounted for the largest share in the market, due to the large number of pharmaceutical manufacturing facilities globally, which has created a consistent and high-volume demand for metal detectors in routine quality assurance processes.
-
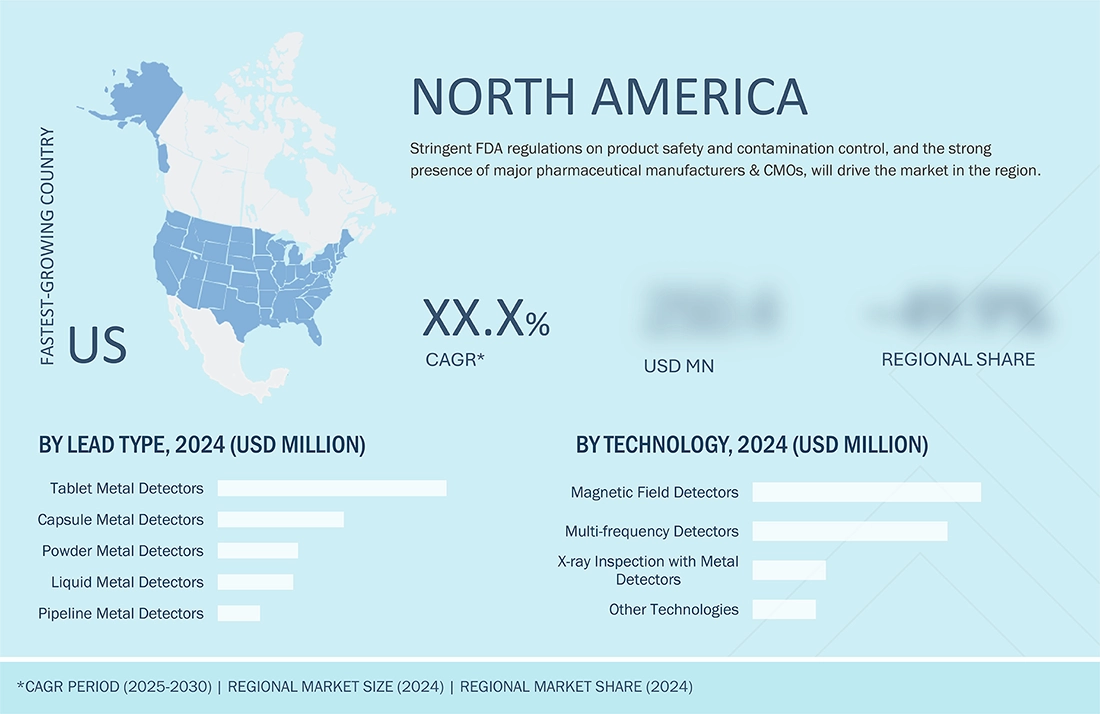
By regionNorth America is projected to grow with the highest growth rate during the forecast period in this market. The growth of the US in the North American pharmaceutical metal detectors market can be attributed to the strict enforcement of FDA regulations and an increasing number of product recalls caused by foreign particle contamination.
-
Competitive LandscapeThe pharmaceutical metal detectors market has seen major players focus on advancing detection sensitivity, GMP compliance, and digital integration, alongside product launches, partnerships, and facility expansions to meet rising demand for contamination-free production. Growing emphasis on automation, Industry 4.0, and collaborations with machinery providers has accelerated the adoption of smart detection systems in solid dosage manufacturing and packaging.
Pharmaceutical metal detectors play a critical role in ensuring product safety and compliance by detecting and removing contaminants, especially in tablet and capsule production. Market growth is driven by rising product recalls, stringent regulatory requirements, and the adoption of automated, inline quality control systems. However, high costs and technical challenges, such as detecting non-ferrous metals or contaminants in foil packaging, continue to limit broader adoption.
TRENDS & DISRUPTIONS IMPACTING CUSTOMERS' CUSTOMERS
The pharmaceutical metal detectors market is shaped by trends such as Industry 4.0 adoption, demand for compact, customizable systems, and growth in nutraceuticals. Stricter regulations are driving compliance-focused solutions, retrofitting, and consulting services. These changes push companies to adapt strategies and stay competitive in a dynamic environment.
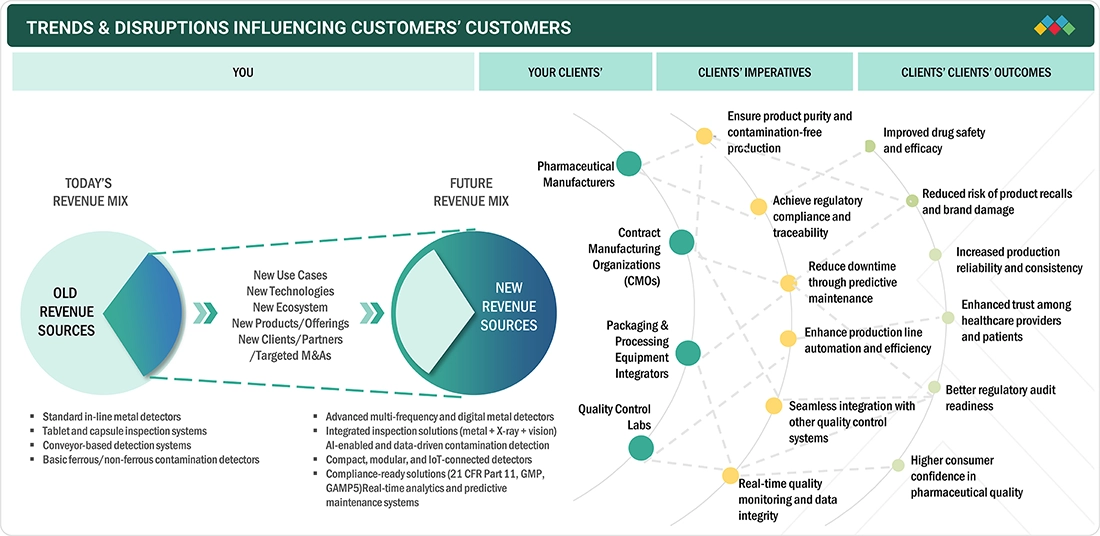
Source: Secondary Research, Interviews with Experts, MarketsandMarkets Analysis
MARKET DYNAMICS
Level
-
Growing number of product recalls due to metal contamination

-
Stringent regulatory compliance mandates

Level
-
High initial capital expenditure and recurring maintenance costs

-
Operational challenges in detecting non-ferrous and foil-based contaminants

Level
-
Focus on production optimization and high R&D investment

-
Expansion of pharmaceutical exports and contract manufacturing

Level
-
Integration complexity with existing production lines

Source: Secondary Research, Interviews with Experts, MarketsandMarkets Analysis
Driver: Growing number of product recalls due to metal contamination
The growing number of pharmaceutical recalls due to metal contamination has significantly increased the demand for advanced metal detectors. Incidents like Sun Pharma's 2023 recall in the US and Amneal's 2024 injectable recall highlight rising regulatory vigilance. Globally, contamination-led recalls surged 114% in 2022 from the previous year. Such events pose safety risks, damage reputations, and trigger regulatory scrutiny, pushing pharmaceutical manufacturers to invest in sensitive inline detection systems. Major suppliers such as Mettler Toledo and Thermo Fisher report growing adoption as companies seek to avoid financial and compliance setbacks, strengthening demand for robust metal detection solutions.
Restraint: High initial capital expenditure and recurring maintenance costs
Pharmaceutical metal detectors often come with high upfront costs, ranging from USD 3,000 for basic units to over USD 45,000 for advanced systems. Leading models like those from Mettler-Toledo or Foodman Optoelectronic also incur annual maintenance expenses of 10–15% of their price, alongside costs for calibration, validation, and potential downtimes. This makes adoption financially burdensome, especially for SMEs. Integration with existing lines adds further expense, leading many to delay upgrades. Even larger firms face budgetary constraints and prolonged approval cycles. Consequently, these financial barriers hinder widespread adoption, especially in price-sensitive or emerging markets.
Opportunity: Expansion of pharmaceutical exports and contract manufacturing
The rise in pharmaceutical exports and contract manufacturing is driving demand for metal detectors. India’s exports surged to USD 27.9 billion in FY 2023–24 and are projected to reach USD 31 billion in FY 2025, largely to markets such as the US. This growth is coupled with an expanding CDMO sector, supported by initiatives such as India’s PLI scheme. Export-oriented production must meet global safety and compliance standards, increasing the need for reliable inline metal detection. As CDMOs and manufacturers serve regulated markets, metal detectors become essential for quality assurance, creating a robust growth opportunity for detection system vendors.
Challenge: Integration complexity with existing production lines
Integrating metal detectors into existing pharmaceutical production lines is technically challenging due to space constraints, legacy equipment, and diverse software systems. Many lines comprise tightly packed, high-speed machines, making physical and electronic compatibility difficult. Older setups often lack standardized interfaces, requiring costly modifications and custom engineering. Moreover, detectors must align with control systems such as MES, PLC, or SCADA, and be calibrated for various dosage forms and packaging. This integration complexity can cause downtime, retraining needs, and operational delays. Consequently, these challenges deter adoption, especially among smaller manufacturers, and complicate deployment in large-scale operations.
Pharmaceutical Metal Detector Market: COMMERCIAL USE CASES ACROSS INDUSTRIES
| COMPANY | USE CASE DESCRIPTION | BENEFITS |
|---|---|---|
 |
High-sensitivity pharmaceutical metal detectors integrated into tablet and capsule production lines | Ensures precise detection of ferrous, non-ferrous, and stainless-steel contaminants, maintaining compliance with FDA and EU GMP standards while reducing product recalls |
 |
Metal detectors embedded in packaging and quality control systems for solid dosage pharmaceuticals | Improves patient safety by preventing contaminated batches, enhances process reliability, and supports regulatory audits with automated data logging |
 |
Advanced multi-frequency metal detectors tailored for high-speed pharmaceutical blister packs and sachets | Enables accurate detection of minute contaminants in fast-moving production lines, minimizing false rejects and maintaining high production efficiency |
 |
Precision metal detection systems integrated with weighing and inspection solutions for pharmaceuticals | Provides combined quality assurance by detecting contaminants and ensuring accurate dosage weight, thereby reducing waste and improving manufacturing yield |
 |
Compact and customizable metal detection systems for small-batch and contract pharmaceutical manufacturers | Offers flexible solutions for diverse production scales, ensuring contaminant-free products, cost efficiency, and adaptability to varied pharmaceutical formulations |
Logos and trademarks shown above are the property of their respective owners. Their use here is for informational and illustrative purposes only.
MARKET ECOSYSTEM
The pharmaceutical metal detector market brings together manufacturers, pharma companies, and regulators to ensure safe medicines. Leading suppliers like Mettler-Toledo, Thermo Fisher, and Eriez provide systems to detect contaminants, while companies such as Pfizer, Merck, Sanofi, and Novartis use them. Regulators such as the FDA and EMA enforce standards for safety and compliance.
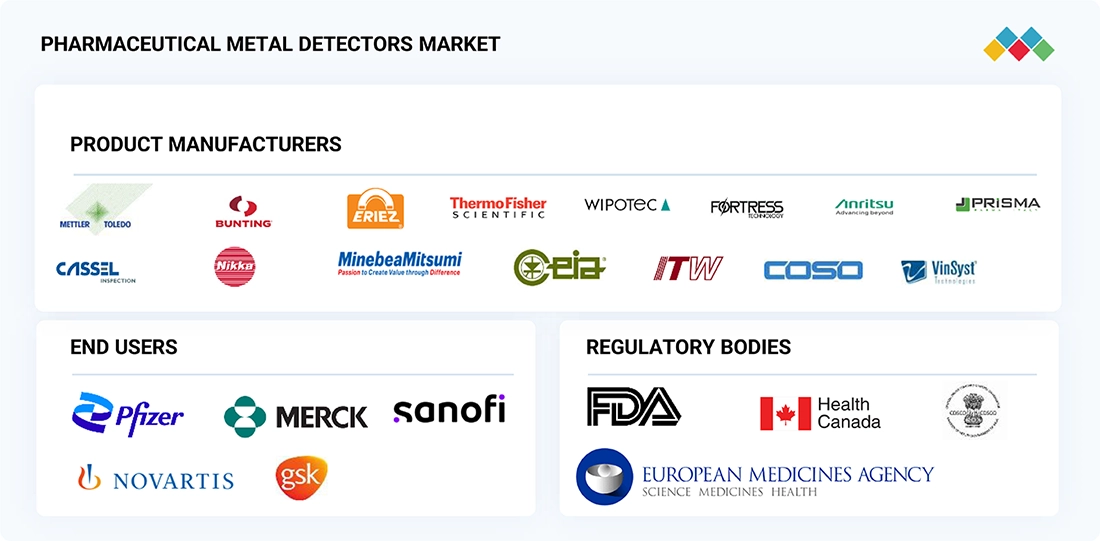
Logos and trademarks shown above are the property of their respective owners. Their use here is for informational and illustrative purposes only.
MARKET SEGMENTS
Source: Secondary Research, Interviews with Experts, MarketsandMarkets Analysis
Pharmaceutical Metal Detector Market, By Product
The tablet metal detectors segment held the largest share of the pharmaceutical metal detector market in 2024, driven by the high global production of tablets, which are the most common solid dosage form. Multiple manufacturing steps can introduce metal contaminants, making detection systems vital for safety and regulatory compliance with FDA, EMA, and WHO guidelines. Modern detectors with advanced sensors, auto-reject features, and 21 CFR Part 11 compliance support real-time monitoring, audit readiness, and seamless integration into automated, high-speed production lines.
REGION
North America dominated the market in 2024.
In 2024, North America held the largest share in the pharmaceutical metal detector market due to a combination of regulatory, industrial, and technological factors that drive early and widespread adoption of metal detection systems in pharmaceutical manufacturing. Strict regulatory requirements from agencies such as the US Food and Drug Administration (FDA) and Health Canada mandate stringent quality control and contamination prevention across all pharmaceutical processes. Compliance with standards such as cGMP (Current Good Manufacturing Practices) requires manufacturers to incorporate advanced inspection systems, including metal detectors, to ensure product integrity and safety. North America is home to some of the largest pharmaceutical companies and contract manufacturing organizations (CMOs) globally, which produce high volumes of tablets, capsules, and other dosage forms. These companies prioritize product safety and brand reputation, leading to higher investments in advanced metal detection technologies.
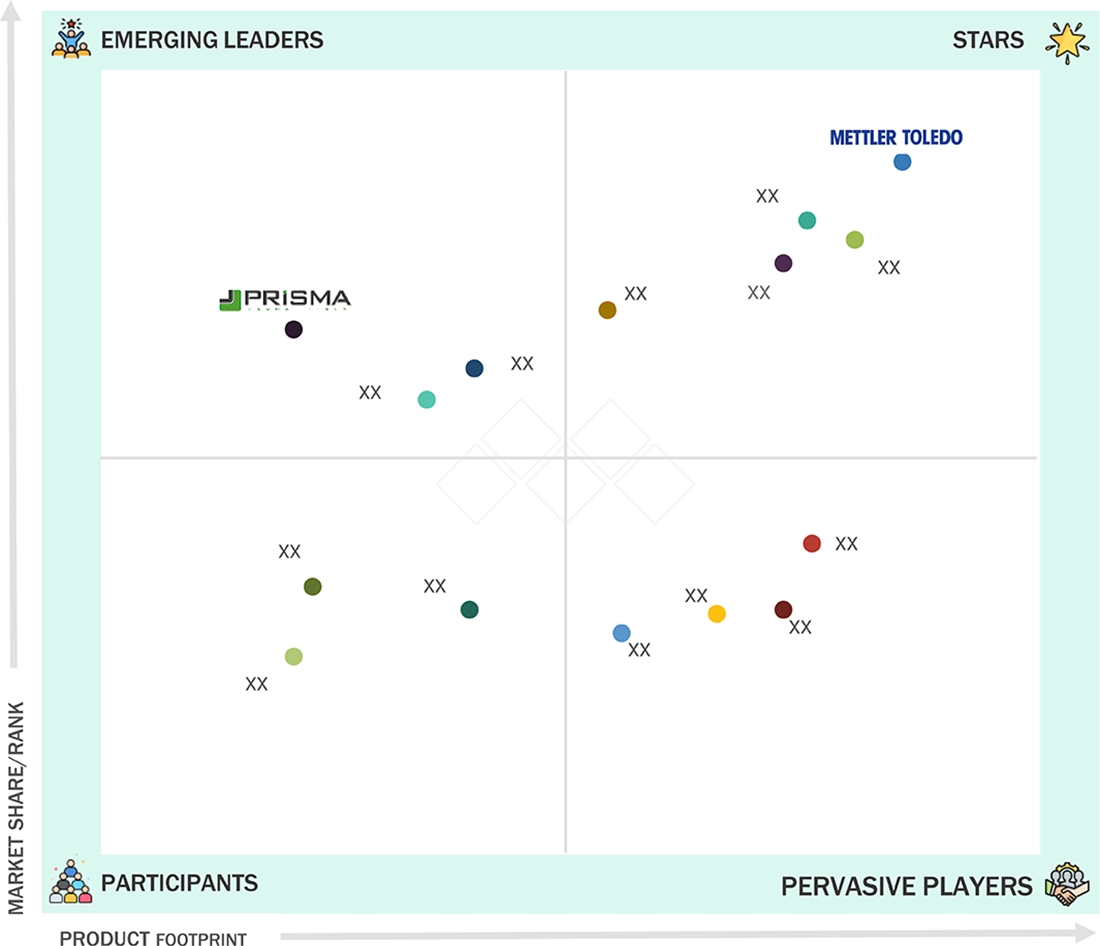
Pharmaceutical Metal Detector Market: COMPANY EVALUATION MATRIX
In the pharmaceutical metal detector market matrix, Mettler-Toledo International Inc. (US) is recognized as a leader in the pharmaceutical metal detectors market, offering advanced technologies, a wide product range, and a strong global presence supported by effective strategies like product launches and partnerships. PRISMA INDUSTRIALE S.r.l. (Italy) stands out as an emerging leader, focusing on product innovation and portfolio expansion, though it lacks the broad growth strategies and market reach of established players such as Mettler-Toledo.
Source: Secondary Research, Interviews with Experts, MarketsandMarkets Analysis
KEY MARKET PLAYERS
MARKET SCOPE
| REPORT METRIC | DETAILS |
|---|---|
| Market Size in 2024 (Value) | USD 151.7 MN |
| Market Size in 2030 (Value) | USD 197.7 MN |
| CAGR | 4.7% |
| Years Considered | 2023–2030 |
| Base Year | 2024 |
| Forecast Period | 2025–2030 |
| Units Considered | Value (USD MN), Volume (Hundred Units) |
| Report Coverage | Revenue forecast, company ranking, competitive landscape, growth factors, and trends |
| Segments Covered | • By Product: Tablet Metal Detectors, Capsule Metal Detector, Powder Metal Detectors, Liquid Metal Detectors, and Pipeline Metal Detectors |
| Regional Scope | North America, Europe, Asia Pacific, and Rest of the World |
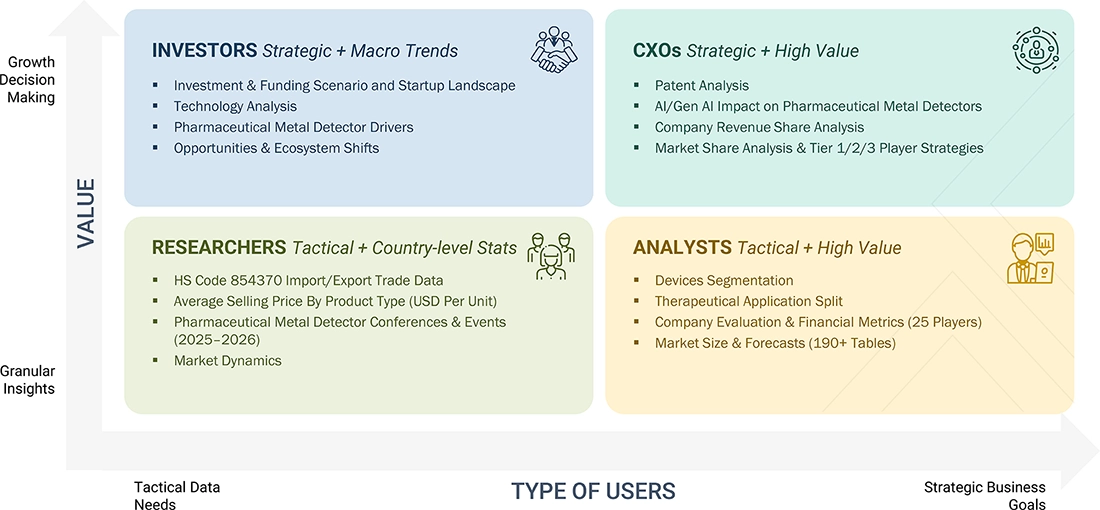
WHAT IS IN IT FOR YOU: Pharmaceutical Metal Detector Market REPORT CONTENT GUIDE
DELIVERED CUSTOMIZATIONS
We have successfully delivered the following deep-dive customizations:
| CLIENT REQUEST | CUSTOMIZATION DELIVERED | VALUE ADDS |
|---|---|---|
| Product Analysis | Comparison of top Pharmaceutical Metal Detectors: Tablet Metal Detectors, Powder Metal Detectors, Pipeline Metal Detectors, Capsule Metal Detectors, Liquid Metal Detectors | Helps clients identify the most suitable product type for different clinical and homecare applications, supporting informed procurement and investment decisions |
| Company Information | Key players: Mettler-Toledo International Inc. (US), Thermo Fisher Scientific Inc. (US), Anritsu Corporation (Japan), MinebeaMitsumi Inc. (Japan), Illinois Tool Works Inc. (US); Top 3-5 players market share analysis at the country-level.in the Asia Pacific and Europe | Provides clarity on competitive positioning and market dynamics, enabling benchmarking against leading players and evaluating partnership or expansion opportunities |
| Geographic Analysis | Further breakdown of the rest of Europe’s market into Austria, Finland, the Netherlands, and Switzerland, and the rest of Latin America’s market into Argentina, Colombia, and Chile | Delivers deeper regional insights, allowing clients to target niche markets and tailor regional strategies for higher market penetration |
RECENT DEVELOPMENTS
- April 2025 : Illinois Tool Works Inc. launched its advanced IQ4M Metal Detector. Designed to enhance food and pharmaceutical safety, this next-generation system offers high-precision contaminant detection while reducing costly false rejects, addressing critical quality control challenges in solid dosage manufacturing and packaging.
- September 2024 : Eriez Manufacturing Co. partnered with Cardiff University (UK) to open a new R&D hub in Wales. This partnership strengthens the company’s research capabilities and innovation pipeline, focusing on advancing metal detection technologies through joint academic and industrial research initiatives.
- January 2024 : CEIA S.p.A. expanded its international footprint by launching CEIA Pacific Pty Ltd in Sydney, Australia. This strategic move strengthened its service and support network across Australia, New Zealand, Papua New Guinea, Vietnam, Indonesia, and the Pacific Islands, targeting public and private sector clients.
- February 2024 : Eriez Manufacturing Co. secured a USD 165,000 grant from Innovate UK in February 2024. This funding accelerated the company's R&D activities, particularly in leveraging artificial intelligence to develop advanced metal detection systems tailored for future industrial applications.
Table of Contents
 Exclusive indicates content/data unique to MarketsandMarkets and not available with any competitors.
Methodology
This study extensively utilized both primary and secondary sources. The research process examined various factors affecting the industry to identify segmentation types, industry trends, key players, the competitive landscape, key market dynamics, and strategies employed by major players.
Secondary Research
This research study utilized a variety of comprehensive secondary sources, including directories and databases such as Bloomberg Business, Factiva, and Dun & Bradstreet. It also incorporated white papers, annual reports, company house documents, investor presentations, and SEC filings from companies. Secondary research was conducted to gather valuable information for an extensive, technical, market-oriented, and commercial analysis of the pharmaceutical metal detectors market. Additionally, this research helped obtain crucial insights about key players, market classification, and segmentation according to industry trends down to the most detailed level, as well as key developments related to both market and technological perspectives. A database of the key industry leaders was also created through secondary research.
Primary Research
During the primary research process for this report, various supply and demand sources were interviewed to gather both qualitative and quantitative information. On the supply side, primary sources included project, sales, marketing, business development managers, as well as executives such as presidents, CEOs, vice presidents, chairpersons, chief operating officers, chief strategy officers, directors, chief information officers, and chief medical information officers, all related to the pharmaceutical metal detectors market. On the demand side, the primary sources consisted of pharmaceutical companies, contract development and manufacturing organizations (CDMOs), and biopharmaceutical companies.
A breakdown of the primary respondents is provided below:

Note 1: C-level executives include CEOs, COOs, CTOs, and VPs.
Note 2: Others include sales, marketing, and product managers.
Note 3: Tiers are defined based on a company’s total revenue. As of 2024: Tier 1 = >USD 1 billion, Tier 2 = USD 500 million to USD 1 billion, and Tier 3 = < USD 500 million.
To know about the assumptions considered for the study, download the pdf brochure
Market Size Estimation
The overall size of the pharmaceutical metal detectors market was determined through data triangulation using three different approaches. After analyzing each approach, we calculated a weighted average based on the assumptions applied in each method.

Data Triangulation
After determining the total market size, we divided it into several segments and subsegments. Whenever applicable, we utilized data triangulation and market breakdown procedures to refine the overall market engineering process and obtain accurate statistics for each segment and subsegment.
Market Definition
The pharmaceutical metal detectors comprises systems and technologies designed to detect and eliminate metal contaminants during pharmaceutical manufacturing processes. These detectors play a crucial role in maintaining product purity, patient safety, and regulatory compliance. They are commonly integrated into production lines handling tablets, capsules, powders, and liquids. The market serves pharmaceutical companies, contract manufacturers, and packaging units aiming to prevent contamination-related risks and ensure high product standards.
Stakeholders
- Pharmaceutical Manufacturers
- Contract Development and Manufacturing Organizations (CDMOs)
- Biopharmaceutical Companies
- Contract Manufacturing Organizations (CMOs)
- Clinical Research Organizations (CROs)
- Packaging Line Managers
- Quality Assurance Managers
- Regulatory Compliance Officers
- Validation Engineers
- Equipment Procurement Managers
- Process Engineers
- Maintenance Managers
- R&D Scientists (Pharmaceutical)
- GMP Auditors
- Production Supervisors
- Instrumentation Engineers
- Regulatory Authorities (e.g., FDA, EMA)
- Metal Detector Manufacturers
- Cleanroom Equipment Suppliers
- Pharmaceutical Packaging Companies
- Industry Consultants and Auditors
Report Objectives
- To define, describe, and forecast the pharmaceutical metal detectors market by product, technology, application, end user, and region
- To provide detailed information about the key factors influencing market growth, such as drivers, restraints, opportunities, challenges, and industry trends
- To strategically analyze the technology analysis, regulatory scenario, value chain analysis, Porter’s five forces analysis, ecosystem analysis, trade analysis, pricing analysis, patent analysis, impact of AI on the pharmaceutical metal det ctors market, and trends/disruption impacting customers’ businesses in the market.
- To analyze the micromarkets with respect to individual growth trends, prospects, and contributions to the overall pharmaceutical metal detectors market
- To analyze market opportunities for stakeholders and provide details of the competitive landscape for key players
- To strategically profile the key players in this market and comprehensively analyze their market shares and core competencies
- To strategically analyze the pharmaceutical metal detectors market in four regions: North America, Europe, Asia Pacific, and the Rest of the World
- To track and analyze competitive developments such as product launches & approvals, acquisitions, partnerships, collaborations, and expansions in the pharmaceutical metal detectors market
Key Questions Addressed by the Report
What are the opportunities in the pharmaceutical metal detectors market?
Growing pharmaceutical exports and contract manufacturing create strong growth opportunities for players in the pharmaceutical metal detectors market.
Which segments have been included in this report?
This report includes the following main segments:
- By Product
- By Technology
- By Application
- By End User
- By Region
Who are the top players in the pharmaceutical metal detectors market?
The top players are Mettler-Toledo International Inc. (US), Thermo Fisher Scientific Inc. (US), Anritsu Corporation (Japan), MinebeaMitsumi Inc. (Japan), and Illinois Tool Works Inc. (US).
What are the factors expected to pose a challenge to the market growth?
Integration complexity with existing production lines is expected to pose a challenge to the growth of this market during the forecast period.
At what CAGR is the pharmaceutical metal detectors market expected to grow?
The pharmaceutical metal detectors market is expected to grow at a CAGR of 4.7% during the forecast period.
Need a Tailored Report?
Customize this report to your needs
Get 10% FREE Customization
Customize This ReportPersonalize This Research
- Triangulate with your Own Data
- Get Data as per your Format and Definition
- Gain a Deeper Dive on a Specific Application, Geography, Customer or Competitor
- Any level of Personalization
Let Us Help You
- What are the Known and Unknown Adjacencies Impacting the Pharmaceutical Metal Detector Market
- What will your New Revenue Sources be?
- Who will be your Top Customer; what will make them switch?
- Defend your Market Share or Win Competitors
- Get a Scorecard for Target Partners

Custom Market Research Services
We Will Customise The Research For You, In Case The Report Listed Above Does Not Meet With Your Requirements
Get 10% Free CustomisationTESTIMONIALS

JAYANT RAJPUROHIT
Director of Market Insights, Data and Analytics
SFI Health,
Leading Pharmaceutical Companywww.sfihealth.com/

We at SFI Health approached MarketsandMarkets for an Opportunity Assessment on "Incidence and Prevalence of Focus Indications" as we wanted to know the most attractive HCPs like Physician, Functional MD, Naturopath and Pharmacist. The project was critical for us to ensure our focus on the right target which would enable sustainable growth and profitability for SFI Health. The business insights provided exceeded our expectations and we were extremely impressed. The team at MarketsandMarkets is highly professional and detail oriented and very well understood our business needs. MarketsandMarkets offers a unique combination of expertise and dedicated engagement model. We identified 2 new products to be launched in coming months, based on the research findings provided by MarketsandMarkets. We are happy with the services and would strongly recommend MarketsandMarkets to my peers in the industry.

BEATRIZ DE LA CALLE
Head of Commercial Analytics
Qualicaps,
Leading Pharmaceutical Companywww.qualicaps.com/

We partnered with MarketsandMarkets for an assessment study on hard empty capsules. The team was extremely professional in understanding our business requirements and we received timely responses to all our queries. The market intelligence and the recommendations has met our business requirements. We were extremely impressed to see the final study results; it really exceeded our expectations. The market intelligence offered by MarketsandMarkets, and clarity on next steps will help us achieve our business objective for the Year 2021. We are happy with the services and would strongly recommend MarketsandMarkets to my peers in the industry.

Bob Williams,
Senior Director Business Development & Innovation
Bracco Diagnostics Inc.,
Italian Multinational in life sciences sector and a World Leader in imaging diagnosticsimaging.bracco.com/us-en
We were pleased with targeted insights that MarketsandMarkets identified from a custom study on the 'Radiation Dose Management Solutions Market'. Your team identified and characterized the market participants as well as underlying trends accurately. This study was useful to Bracco in formulating business strategies for our dose monitoring product lines and we thank MarketsandMarkets for the job well done.
Cody Coonradt,
Market Development and Strategy Manager
3M Health Information Systems,
Leader in Health care Coding, Payment & Analytics Solutions.www.3m.com/3M/en_US/health-information-systems-us
The value for our organization comes from three things: depth of research, specificity of segments and being easy to work with. As important as the first two are, the third can't be underestimated. MarketsandMarkets, maybe more than any other research vendor, wants to know what is top of mind for our team and what big questions we are grappling to answer.
Their customer first approach and high value engagement model, have given us great analysis and excellent value for money


Growth opportunities and latent adjacency in Pharmaceutical Metal Detector Market