Pipette Calibrators Market

Pipette Calibrators Market by Type (Devices, Software), Channel Type, Method (Gravimetry, Photometry), Application (Research (Drug Discovery), Clinical Diagnostics), End User (Pharmaceutical & Biotechnology), & Region - Global Forecast to 2029

Report Code: MD 8958 Feb, 2024, by marketsandmarkets.com

The global pipette calibrators market in terms of revenue was estimated to be worth $286 million in 2024 and is poised to reach $391 million by 2029, growing at a CAGR of 6.5% from 2024 to 2029. The new research study consists of an industry trend analysis of the market. The new research study consists of industry trends, pricing analysis, patent analysis, conference and webinar materials, key stakeholders, and buying behaviour in the market. The growth in this market is attributed to the increasing need for pipettes in research facilities, and growing use of portable handheld calibration devices, and adoption of cloud-based calibration management. However, presence of alternative simple methods or techniques could restrain the growth of this market.

Attractive Opportunities in the Pipette Calibrators Market

Pipette Calibrators Market

To know about the assumptions considered for the study, Request for Free Sample Report

Pipette Calibrators Market

Global Pipette Calibrators Market Dynamics

DRIVER: Expansion of pharmaceutical & biotechnology industries

Globally, the pharmaceutical & biotechnology industries are growing at a substantial rate. These industries are responsible for the research, development, production, and distribution of medications. According to World Pharma Today (2023), by 2023 it is anticipated that the pharmaceutical sector is expected to reach USD 1.5 trillion and has grown quickly in past years. Research and development and innovative treatments for patients will be the key driving factors.

In pharmaceutical & biotechnology industries pipettes are extensively used to perform numerous research activities, such as high-throughput screening, absorption, distribution, metabolism, and excretion (ADME) screening, sample distribution, and target validation due to which there will be time to time requirement for the calibration of pipettes. A growth in these industries will augment the growth of the market.

RESTRAINT: High pricing of pipette calibration systems

The capital investment is growing significantly due to the premium pricing of pipette calibration systems. For instance, liquid handling pipetting robots may cost USD 1,000 to USD 1,500. Moreover, budget availability and significant investment are required for pipette calibration systems as the prices of these systems vary between USD 20,000 and USD 150,000. For example, Automatic Device for Multichannel Pipette Calibration by RADWAG costs USD 52,130 and the SpeedCal (12 Channels) pipette calibration system by Sartorius costs USD 131,930. Due to budgetary limitations many hospitals and laboratories may not be able to afford these systems.

OPPORTUNITY: Growing genomics and proteomics research

Ranging from disease diagnosis to biomarker discovery, genomics and proteomics processes find applications in various areas. As the laboratories are considering liquid handling automation to make sequencing workflows more efficient and cost-effective, the rising focus on NGS has prompted its adoption in genomics research due to which many government agencies and companies are focusing on meeting end-user needs in the area.

CHALLENGE: Rise in pipette calibration services

Typically the pipette requires calibration service on an average of at least once a year and most biotech companies do semi-annual calibration. It is strongly recommended and, in many cases, required that each pipette be serviced by an ISO 17025:2005 accredited laboratory. As pipette manufacturers continued their pursuit of pipette sales revenues, they also offered calibration services, but again with lengthy turnaround times due to which there is a rise in independent traveling pipette service providers, offering the ultra-convenience of onsite measurement and maintenance services.

Pipette Calibrators Industry Ecosystem

Prominent companies in this market include well-established, financially stable manufacturers of pipette calibrators. These companies have been operating in the market for several years and possess diversified state-of-the-art technologies, product portfolios, and strong global sales and marketing networks. Prominent companies in this market include METTLER TOLEDO (US), Sartorius AG (Germany), Advanced Instruments (US), and A&D Company, Limited (Japan).

Pipette Calibrators Market Ecosystem

In 2022, devices segment to observe the highest growth rate of the pipette calibrators industry, by type.

Based on type, the pipette calibrators market is classified as devices and software. The devices segment dominated the market in 2022. This segment is also estimated to account for the highest CAGR during the forecast period. The large share of the segment can be attributed to the growing number of research facilities and advancements in technology.

In 2022, research segment to dominate the pipette calibrators industry, by application.

Based on the application, the pipette calibrators market is segmented into research and clinical diagnostics. The research segment dominated the market in 2022. This segment is also estimated to account for the highest CAGR during the forecast period. The large share of this segment can be primarily attributed to the growing drug discovery and development and rising investments for research activities.

In 2022, pharmaceutical & biotechnology industry segment to dominate the pipette calibrators industry, by end user.

Based on the end user, the pipette calibrators market is segmented into pharmaceutical & biotechnology industry, hospitals, and research & academic institutes. The pharmaceutical & biotechnology industry segment accounted for the largest share of the market in 2022. Growth in this segment is primarily attributed to the growing R&D investments for new manufacturing and research facilities.

In 2022, North America to dominate in pipette calibrators industry.

The global pipette calibrators market is segmented into North America, Europe, Asia Pacific, and Rest of the World. North America is expected to dominate during the forecast period, primarily due to the growing availability of government funding for life science research activities, the presence of major players in the US, and high R&D spends by the pharmaceutical and biopharmaceutical companies in the region.

Pipette Calibrators Market by Region

To know about the assumptions considered for the study, download the pdf brochure

The pipette calibrators industry is dominated by players such as METTLER TOLEDO (US), Sartorius AG (Germany), Advanced Instruments (US), and A&D Company, Limited (Japan).

Scope of the Pipette Calibrators Industry

Report Metric

Details

Market Revenue in 2024

$286 million

Projected Revenue by 2029

$391 million

Revenue Rate

Poised to Grow at a CAGR of 6.5%

Market Driver

Expansion of pharmaceutical & biotechnology industries

Market Opportunity

Growing genomics and proteomics research

This research report categorizes the pipette calibrators market to forecast revenue and analyze trends in each of the following submarkets:

By Region

  • North America
  • Europe
  • Asia Pacific
  • Rest of the World

By Type

  • Devices
  • Software

By Channel Type

  • Single Channel
  • Multi-channel

By Method

  • Gravimetric
  • Photometric
  • Other Methods

By Application

  • Research
  • Clinical Diagnostics

By End User

  • Pharmaceutical & Biotechnology Industry
  • Hospitals
  • Research & Academic Institutes

Recent Developments of Pipette Calibrators Industry:

  • In 2023, RADWAG Balances and Scales (Poland) launched the AP-12.1.5Y which is the first automatic device designed to calibrate single- and multi-channel micropipettes with one µg, in accordance with ISO 8655 requirements.
  • In 2022, Advanced Instruments (US) acquired Artel (US); Artel is an internationally recognized gold standard for performance management of workflows in which automated liquid handling systems and manual pipettes are used throughout the life science industry.
  • In 2021, METTLER TOLEDO (US) entered into an agreement with the US Department of Defense to increase domestic production capacity of pipette tips and enhance manufacturing automation and logistics.

Frequently Asked Questions (FAQ):

To speak to our analyst for a discussion on the above findings, click Speak to Analyst

TABLE OF CONTENTS
 
1 INTRODUCTION (Page No. - 33)
    1.1 STUDY OBJECTIVES 
    1.2 MARKET DEFINITION 
           1.2.1 INCLUSIONS & EXCLUSIONS OF STUDY
    1.3 MARKET SCOPE 
           1.3.1 MARKETS COVERED
                    FIGURE 1 PIPETTE CALIBRATORS MARKET SEGMENTATION
           1.3.2 REGIONS COVERED
           1.3.3 YEARS CONSIDERED
    1.4 CURRENCY 
    1.5 STAKEHOLDERS 
    1.6 LIMITATIONS 
    1.7 RECESSION IMPACT 
 
2 RESEARCH METHODOLOGY (Page No. - 37)
    2.1 RESEARCH DATA 
          FIGURE 2 RESEARCH DESIGN
           2.1.1 SECONDARY DATA
                    2.1.1.1 Secondary sources
           2.1.2 PRIMARY DATA
                    FIGURE 3 PRIMARY SOURCES
                    2.1.2.1 Key data from primary sources
                    2.1.2.2 Key industry insights
                    2.1.2.3 Breakdown of primary interviews
                                FIGURE 4 BREAKDOWN OF PRIMARY INTERVIEWS: BY COMPANY TYPE, DESIGNATION, AND REGION
                                FIGURE 5 BREAKDOWN OF PRIMARY INTERVIEWS: BY END USER, DESIGNATION, AND REGION
    2.2 MARKET SIZE ESTIMATION 
           2.2.1 APPROACH 1: COMPANY REVENUE ESTIMATION APPROACH
                    FIGURE 6 BOTTOM-UP APPROACH: COMPANY REVENUE ESTIMATION
           2.2.2 APPROACH 2: NUMBER OF PIPETTE CALIBRATORS
           2.2.3 APPROACH 3: PRESENTATIONS OF COMPANIES AND PRIMARY INTERVIEWS
           2.2.4 APPROACH 4: PRIMARY INTERVIEWS
           2.2.5 GROWTH FORECAST
                    FIGURE 7 CAGR PROJECTIONS: SUPPLY-SIDE ANALYSIS
                    FIGURE 8 TOP-DOWN APPROACH
    2.3 MARKET BREAKDOWN & DATA TRIANGULATION 
          FIGURE 9 DATA TRIANGULATION METHODOLOGY
    2.4 MARKET SHARE ANALYSIS 
    2.5 MARKET ASSUMPTIONS 
    2.6 RISK ASSESSMENT 
          TABLE 1 RISK ASSESSMENT
    2.7 RECESSION IMPACT ON PIPETTE CALIBRATORS INDUSTRY
 
3 EXECUTIVE SUMMARY (Page No. - 50)
    FIGURE 10 PIPETTE CALIBRATORS MARKET, BY TYPE, 2024 VS. 2029 (USD MILLION)
    FIGURE 11 PIPETTE CALIBRATORS INDUSTRY, BY CHANNEL TYPE, 2024 VS. 2029 (USD MILLION)
    FIGURE 12 MARKET, BY METHOD, 2024 VS. 2029 (USD MILLION)
    FIGURE 13 MARKET, BY APPLICATION, 2024 VS. 2029 (USD MILLION)
    FIGURE 14 MARKET, BY END USER, 2024 VS. 2029 (USD MILLION)
    FIGURE 15 GEOGRAPHICAL SNAPSHOT OF MARKET
 
4 PREMIUM INSIGHTS (Page No. - 55)
    4.1 PIPETTE CALIBRATORS MARKET OVERVIEW 
          FIGURE 16 GROWING R&D EXPENDITURE BY PHARMACEUTICAL AND BIOPHARMACEUTICAL COMPANIES TO DRIVE MARKET
    4.2 ASIA PACIFIC: PIPETTE CALIBRATORS INDUSTRY, BY TYPE AND COUNTRY (2022) 
          FIGURE 17 DEVICES SEGMENT ACCOUNTED FOR LARGEST SHARE OF ASIA PACIFIC MARKET IN 2022
    4.3 MARKET: GEOGRAPHIC GROWTH OPPORTUNITIES 
          FIGURE 18 CHINA TO REGISTER HIGHEST GROWTH RATE DURING FORECAST PERIOD
    4.4 MARKET: REGIONAL MIX 
          FIGURE 19 ASIA PACIFIC MARKET TO WITNESS FASTEST GROWTH DURING FORECAST PERIOD
 
5 MARKET OVERVIEW (Page No. - 58)
    5.1 MARKET DYNAMICS 
          FIGURE 20 PIPETTE CALIBRATORS MARKET: DRIVERS, RESTRAINTS, OPPORTUNITIES, CHALLENGES, AND TRENDS
           5.1.1 DRIVERS
                    5.1.1.1 Stringent quality standards and regulations
                    5.1.1.2 Increasing automation
                    5.1.1.3 Expansion of pharmaceutical & biotechnology industries
                    5.1.1.4 Growing R&D expenditure by pharmaceutical and biopharmaceutical companies
                                TABLE 2 R&D EXPENDITURE OF BIOPHARMACEUTICAL COMPANIES, 2022
                    5.1.1.5 Increasing focus on data precision and accuracy
           5.1.2 RESTRAINTS
                    5.1.2.1 High pricing of pipette calibration systems
                    5.1.2.2 Alternative technologies
                    5.1.2.3 Slow adoption of automation in small and mid-sized laboratories
                                TABLE 3 EQUIPMENT COSTS, BY TYPE
           5.1.3 OPPORTUNITIES
                    5.1.3.1 Changing market scenario in developing countries
                    5.1.3.2 Growing genomics and proteomics research
           5.1.4 CHALLENGES
                    5.1.4.1 Underdeveloped infrastructure and lack of talent management in developing countries
                    5.1.4.2 Rise in pipette calibration services
           5.1.5 TRENDS
                    5.1.5.1 Adoption of digital and electronic pipettes
                    5.1.5.2 Rise of cloud-based calibration management
                    5.1.5.3 Portable and handheld calibration devices
    5.2 VALUE CHAIN ANALYSIS 
          FIGURE 21 PIPETTE CALIBRATORS INDUSTRY: VALUE CHAIN ANALYSIS
    5.3 SUPPLY CHAIN ANALYSIS 
          FIGURE 22 MARKET: SUPPLY CHAIN ANALYSIS
    5.4 PORTER’S FIVE FORCES ANALYSIS 
          TABLE 4 MARKET: PORTER’S FIVE FORCES ANALYSIS
           5.4.1 THREAT OF NEW ENTRANTS
           5.4.2 INTENSITY OF COMPETITIVE RIVALRY
           5.4.3 BARGAINING POWER OF BUYERS
           5.4.4 BARGAINING POWER OF SUPPLIERS
           5.4.5 THREAT OF SUBSTITUTES
    5.5 REGULATORY ANALYSIS 
          TABLE 5 INDICATIVE LIST OF REGULATORY AUTHORITIES GOVERNING MARKET
    5.6 TRADE ANALYSIS 
           5.6.1 TRADE ANALYSIS FOR PIPETTE CALIBRATORS
                    TABLE 6 IMPORT DATA FOR HS CODE 903180, BY COUNTRY, 2018–2022 (USD MILLION)
                    TABLE 7 EXPORT DATA FOR HS CODE 903180, BY COUNTRY, 2018–2022 (USD MILLION)
    5.7 TECHNOLOGY ANALYSIS 
    5.8 ECOSYSTEM ANALYSIS 
          FIGURE 23 MARKET: ECOSYSTEM ANALYSIS
           5.8.1 ROLE IN ECOSYSTEM
                    FIGURE 24 KEY PLAYERS IN PIPETTE CALIBRATORS ECOSYSTEM
    5.9 PATENT ANALYSIS 
          FIGURE 25 PATENT ANALYSIS FOR PIPETTE CALIBRATION SYSTEMS, JANUARY 2014–DECEMBER 2023
    5.10 KEY CONFERENCES AND EVENTS IN 2024–2025 
           TABLE 8 LIST OF CONFERENCES AND EVENTS IN 2024–2025
    5.11 PRICING ANALYSIS 
           TABLE 9 AVERAGE SELLING PRICE TREND OF KEY PLAYERS, BY PRODUCT
           TABLE 10 AVERAGE SELLING PRICE TREND, BY REGION
    5.12 TRENDS/DISRUPTIONS IMPACTING CUSTOMER’S BUSINESS 
           5.12.1 REVENUE SHIFT & REVENUE POCKETS FOR PIPETTE CALIBRATOR MANUFACTURERS
                     FIGURE 26 REVENUE SHIFT FOR PIPETTE CALIBRATORS
    5.13 KEY STAKEHOLDERS AND BUYING CRITERIA 
           5.13.1 KEY STAKEHOLDERS IN BUYING PROCESS
                     FIGURE 27 INFLUENCE OF STAKEHOLDERS ON BUYING PROCESS FOR END USERS
                     TABLE 11 INFLUENCE OF STAKEHOLDERS ON BUYING PROCESS FOR END USERS
           5.13.2 BUYING CRITERIA
                     FIGURE 28 KEY BUYING CRITERIA FOR END USERS
                     TABLE 12 KEY BUYING CRITERIA, BY END USER
 
6 PIPETTE CALIBRATORS MARKET, BY TYPE (Page No. - 81)
    6.1 INTRODUCTION 
          TABLE 13 PIPETTE CALIBRATORS INDUSTRY, BY TYPE, 2021–2029 (USD MILLION)
    6.2 DEVICES 
           6.2.1 EXPANSION OF PHARMACEUTICAL AND BIOTECHNOLOGY MANUFACTURING COMPANIES TO DRIVE MARKET
                    TABLE 14 PIPETTE CALIBRATOR DEVICES MARKET, BY REGION, 2021–2029 (USD MILLION)
                    TABLE 15 NORTH AMERICA: PIPETTE CALIBRATOR DEVICES MARKET, BY COUNTRY, 2021–2029 (USD MILLION)
                    TABLE 16 EUROPE: PIPETTE CALIBRATOR DEVICES MARKET, BY COUNTRY, 2021–2029 (USD MILLION)
                    TABLE 17 ASIA PACIFIC: PIPETTE CALIBRATOR DEVICES MARKET, BY COUNTRY, 2021–2029 (USD MILLION)
                    TABLE 18 REST OF THE WORLD: PIPETTE CALIBRATOR DEVICES MARKET, BY REGION, 2021–2029 (USD MILLION)
    6.3 SOFTWARE 
           6.3.1 DESIGNED TO FACILITATE CALIBRATION AND MAINTENANCE OF PIPETTES USED IN LABORATORIES
                    TABLE 19 PIPETTE CALIBRATOR SOFTWARE MARKET, BY REGION, 2021–2029 (USD MILLION)
                    TABLE 20 NORTH AMERICA: PIPETTE CALIBRATOR SOFTWARE MARKET, BY COUNTRY, 2021–2029 (USD MILLION)
                    TABLE 21 EUROPE: PIPETTE CALIBRATOR SOFTWARE MARKET, BY COUNTRY, 2021–2029 (USD MILLION)
                    TABLE 22 ASIA PACIFIC: PIPETTE CALIBRATOR SOFTWARE MARKET, BY COUNTRY, 2021–2029 (USD MILLION)
                    TABLE 23 REST OF THE WORLD: PIPETTE CALIBRATOR SOFTWARE MARKET, BY REGION, 2021–2029 (USD MILLION)
 
7 PIPETTE CALIBRATORS MARKET, BY CHANNEL TYPE (Page No. - 88)
    7.1 INTRODUCTION 
          TABLE 24 PIPETTE CALIBRATORS INDUSTRY, BY CHANNEL TYPE, 2021–2029 (USD MILLION)
    7.2 SINGLE CHANNEL 
           7.2.1 INCREASING ADOPTION IN PHARMACEUTICAL & BIOTECHNOLOGY INDUSTRIES TO DRIVE MARKET
                    TABLE 25 MARKET, BY REGION, 2021–2029 (USD MILLION)
                    TABLE 26 NORTH AMERICA: MARKET, BY COUNTRY, 2021–2029 (USD MILLION)
                    TABLE 27 EUROPE: MARKET, BY COUNTRY, 2021–2029 (USD MILLION)
                    TABLE 28 ASIA PACIFIC: MARKET, BY COUNTRY, 2021–2029 (USD MILLION)
                    TABLE 29 REST OF THE WORLD: MARKET, BY REGION, 2021–2029 (USD MILLION)
    7.3 MULTICHANNEL 
           7.3.1 HIGH COST AND DIFFICULT TO MAINTAIN & CALIBRATE— KEY FACTORS RESTRAINING MARKET GROWTH
                    TABLE 30 MARKET, BY REGION, 2021–2029 (USD MILLION)
                    TABLE 31 NORTH AMERICA: MARKET, BY COUNTRY, 2021–2029 (USD MILLION)
                    TABLE 32 EUROPE: MARKET, BY COUNTRY, 2021–2029 (USD MILLION)
                    TABLE 33 ASIA PACIFIC: MARKET, BY COUNTRY, 2021–2029 (USD MILLION)
                    TABLE 34 REST OF THE WORLD: MARKET, BY REGION, 2021–2029 (USD MILLION)
 
8 PIPETTE CALIBRATORS MARKET, BY METHOD (Page No. - 95)
    8.1 INTRODUCTION 
          TABLE 35 PIPETTE CALIBRATORS INDUSTRY, BY METHOD, 2021–2029 (USD MILLION)
    8.2 GRAVIMETRIC 
           8.2.1 WIDESPREAD ACCEPTANCE AND ENDORSEMENT FROM BOTH NATIONAL AND INTERNATIONAL REGULATORY BODIES TO SUPPORT MARKET GROWTH
                    TABLE 36 MARKET, BY REGION, 2021–2029 (USD MILLION)
                    TABLE 37 NORTH AMERICA: MARKET, BY COUNTRY, 2021–2029 (USD MILLION)
                    TABLE 38 EUROPE: MARKET, BY COUNTRY, 2021–2029 (USD MILLION)
                    TABLE 39 ASIA PACIFIC: MARKET, BY COUNTRY, 2021–2029 (USD MILLION)
                    TABLE 40 REST OF THE WORLD: MARKET, BY REGION, 2021–2029 (USD MILLION)
    8.3 PHOTOMETRIC 
           8.3.1 SUITABLE FOR APPLICATIONS INVOLVING LOW-VOLUME MEASUREMENTS AND HIGH-THROUGHPUT SCREENING
                    TABLE 41 MARKET, BY REGION, 2021–2029 (USD MILLION)
                    TABLE 42 NORTH AMERICA: MARKET, BY COUNTRY, 2021–2029 (USD MILLION)
                    TABLE 43 EUROPE: MARKET, BY COUNTRY, 2021–2029 (USD MILLION)
                    TABLE 44 ASIA PACIFIC: MARKET, BY COUNTRY, 2021–2029 (USD MILLION)
                    TABLE 45 REST OF THE WORLD: MARKET, BY REGION, 2021–2029 (USD MILLION)
    8.4 OTHER METHODS 
          TABLE 46 MARKET FOR OTHER METHODS, BY REGION, 2021–2029 (USD MILLION)
          TABLE 47 NORTH AMERICA: MARKET FOR OTHER METHODS, BY COUNTRY, 2021–2029 (USD MILLION)
          TABLE 48 EUROPE: MARKET FOR OTHER METHODS, BY COUNTRY, 2021–2029 (USD MILLION)
          TABLE 49 ASIA PACIFIC: MARKET FOR OTHER METHODS, BY COUNTRY, 2021–2029 (USD MILLION)
          TABLE 50 REST OF THE WORLD: MARKET FOR OTHER METHODS, BY REGION, 2021–2029 (USD MILLION)
 
9 PIPETTE CALIBRATORS MARKET, BY APPLICATION (Page No. - 104)
    9.1 INTRODUCTION 
          TABLE 51 PIPETTE CALIBRATORS INDUSTRY, BY APPLICATION, 2021–2029 (USD MILLION)
    9.2 RESEARCH 
          TABLE 52 MARKET FOR RESEARCH APPLICATIONS, BY TYPE, 2021–2029 (USD MILLION)
          TABLE 53 MARKET FOR RESEARCH APPLICATIONS, BY REGION, 2021–2029 (USD MILLION)
          TABLE 54 NORTH AMERICA: MARKET FOR RESEARCH APPLICATIONS, BY COUNTRY, 2021–2029 (USD MILLION)
          TABLE 55 EUROPE: MARKET FOR RESEARCH APPLICATIONS, BY COUNTRY, 2021–2029 (USD MILLION)
          TABLE 56 ASIA PACIFIC: MARKET FOR RESEARCH APPLICATIONS, BY COUNTRY, 2021–2029 (USD MILLION)
          TABLE 57 REST OF THE WORLD: MARKET FOR RESEARCH APPLICATIONS, BY REGION, 2021–2029 (USD MILLION)
           9.2.1 DRUG DISCOVERY
                    9.2.1.1 Increasing incidence of chronic diseases to drive market
                                TABLE 58 MARKET FOR DRUG DISCOVERY, BY REGION, 2021–2029 (USD MILLION)
           9.2.2 GENOMICS
                    9.2.2.1 Increased need to understand human physiology and molecular basis of diseases to support market
                                TABLE 59 MARKET FOR GENOMICS, BY REGION, 2021–2029 (USD MILLION)
           9.2.3 PROTEOMICS
                    9.2.3.1 Growing government investments to support market
                                TABLE 60 MARKET FOR PROTEOMICS, BY REGION, 2021–2029 (USD MILLION)
           9.2.4 OTHER RESEARCH APPLICATIONS
                    TABLE 61 MARKET FOR OTHER RESEARCH APPLICATIONS, BY REGION, 2021–2029 (USD MILLION)
    9.3 CLINICAL DIAGNOSTICS 
           9.3.1 INCREASING NUMBER OF CLINICAL TESTS TO DRIVE MARKET
                    TABLE 62 MARKET FOR CLINICAL DIAGNOSTIC APPLICATIONS, BY REGION, 2021–2029 (USD MILLION)
                    TABLE 63 NORTH AMERICA: MARKET FOR CLINICAL DIAGNOSTIC APPLICATIONS, BY COUNTRY, 2021–2029 (USD MILLION)
                    TABLE 64 EUROPE: MARKET FOR CLINICAL DIAGNOSTIC APPLICATIONS, BY COUNTRY, 2021–2029 (USD MILLION)
                    TABLE 65 ASIA PACIFIC: MARKET FOR CLINICAL DIAGNOSTIC APPLICATIONS, BY COUNTRY, 2021–2029 (USD MILLION)
                    TABLE 66 REST OF THE WORLD: MARKET FOR CLINICAL DIAGNOSTIC APPLICATIONS, BY COUNTRY, 2021–2029 (USD MILLION)
 
10 PIPETTE CALIBRATORS MARKET, BY END USER (Page No. - 115)
     10.1 INTRODUCTION 
             TABLE 67 PIPETTE CALIBRATORS INDUSTRY, BY END USER, 2021–2029 (USD MILLION)
     10.2 PHARMACEUTICAL & BIOTECHNOLOGY INDUSTRIES 
             10.2.1 RISING FOCUS ON DRUG DISCOVERY TO DRIVE MARKET
                        TABLE 68 MARKET FOR PHARMACEUTICAL & BIOTECHNOLOGY INDUSTRIES, BY REGION, 2021–2029 (USD MILLION)
                        TABLE 69 NORTH AMERICA: MARKET FOR PHARMACEUTICAL & BIOTECHNOLOGY INDUSTRIES, BY COUNTRY, 2021–2029 (USD MILLION)
                        TABLE 70 EUROPE: MARKET FOR PHARMACEUTICAL & BIOTECHNOLOGY INDUSTRIES, BY COUNTRY, 2021–2029 (USD MILLION)
                        TABLE 71 ASIA PACIFIC: MARKET FOR PHARMACEUTICAL & BIOTECHNOLOGY INDUSTRIES, BY COUNTRY, 2021–2029 (USD MILLION)
                        TABLE 72 REST OF THE WORLD: MARKET FOR PHARMACEUTICAL & BIOTECHNOLOGY INDUSTRIES, BY REGION, 2021–2029 (USD MILLION)
     10.3 HOSPITALS 
             10.3.1 INCREASING NUMBER OF HOSPITALS TO SUPPORT MARKET GROWTH
                        TABLE 73 MARKET FOR HOSPITALS, BY REGION, 2021–2029 (USD MILLION)
                        TABLE 74 NORTH AMERICA: MARKET FOR HOSPITALS, BY COUNTRY, 2021–2029 (USD MILLION)
                        TABLE 75 EUROPE: MARKET FOR HOSPITALS, BY COUNTRY, 2021–2029 (USD MILLION)
                        TABLE 76 ASIA PACIFIC: MARKET FOR HOSPITALS, BY COUNTRY, 2021–2029 (USD MILLION)
                        TABLE 77 REST OF THE WORLD: MARKET FOR HOSPITALS, BY REGION, 2021–2029 (USD MILLION)
     10.4 ACADEMIC & RESEARCH INSTITUTES 
             10.4.1 INCREASED AVAILABILITY OF FUNDING TO DRIVE PURCHASE OF PIPETTE CALIBRATION SYSTEMS
                        TABLE 78 MARKET FOR ACADEMIC & RESEARCH INSTITUTES, BY REGION, 2021–2029 (USD MILLION)
                        TABLE 79 NORTH AMERICA: MARKET FOR ACADEMIC & RESEARCH INSTITUTES, BY COUNTRY, 2021–2029 (USD MILLION)
                        TABLE 80 EUROPE: MARKET FOR ACADEMIC & RESEARCH INSTITUTES, BY COUNTRY, 2021–2029 (USD MILLION)
                        TABLE 81 ASIA PACIFIC: MARKET FOR ACADEMIC & RESEARCH INSTITUTES, BY COUNTRY, 2021–2029 (USD MILLION)
                        TABLE 82 REST OF THE WORLD: MARKET FOR ACADEMIC & RESEARCH INSTITUTES, BY REGION, 2021–2029 (USD MILLION)
 
11 PIPETTE CALIBRATORS MARKET, BY REGION (Page No. - 125)
     11.1 INTRODUCTION 
             TABLE 83 PIPETTE CALIBRATORS INDUSTRY, BY REGION, 2021–2029 (USD MILLION)
     11.2 NORTH AMERICA 
             FIGURE 29 NORTH AMERICA: PIPETTE CALIBRATORS MARKET SNAPSHOT
             TABLE 84 NORTH AMERICA: MARKET, BY COUNTRY, 2021–2029 (USD MILLION)
             TABLE 85 NORTH AMERICA: MARKET, BY TYPE, 2021–2029 (USD MILLION)
             TABLE 86 NORTH AMERICA: MARKET, BY CHANNEL TYPE, 2021–2029 (USD MILLION)
             TABLE 87 NORTH AMERICA: MARKET, BY METHOD, 2021–2029 (USD MILLION)
             TABLE 88 NORTH AMERICA: MARKET, BY APPLICATION, 2021–2029 (USD MILLION)
             TABLE 89 NORTH AMERICA: MARKET FOR RESEARCH APPLICATIONS, BY TYPE, 2021–2029 (USD MILLION)
             TABLE 90 NORTH AMERICA: MARKET, BY END USER, 2021–2029 (USD MILLION)
             11.2.1 NORTH AMERICA: RECESSION IMPACT
             11.2.2 US
                        11.2.2.1 Growth in pharmaceutical & biotechnology industry to drive market
                                      TABLE 91 US: PIPETTE CALIBRATORS MARKET, BY TYPE, 2021–2029 (USD MILLION)
                                      TABLE 92 US: MARKET, BY CHANNEL TYPE, 2021–2029 (USD MILLION)
                                      TABLE 93 US: MARKET, BY METHOD, 2021–2029 (USD MILLION)
                                      TABLE 94 US: MARKET, BY APPLICATION, 2021–2029 (USD MILLION)
                                      TABLE 95 US: MARKET FOR RESEARCH APPLICATIONS, BY TYPE, 2021–2029 (USD MILLION)
                                      TABLE 96 US: MARKET, BY END USER, 2021–2029 (USD MILLION)
                                      TABLE 97 US: MARKET, BY END USER, 2021–2029 (UNITS)
             11.2.3 CANADA
                        11.2.3.1 Strong research base and government support to propel market
                                      TABLE 98 CANADA: PIPETTE CALIBRATORS MARKET, BY TYPE, 2021–2029 (USD MILLION)
                                      TABLE 99 CANADA: MARKET, BY CHANNEL TYPE, 2021–2029 (USD MILLION)
                                      TABLE 100 CANADA: MARKET, BY METHOD, 2021–2029 (USD MILLION)
                                      TABLE 101 CANADA: MARKET, BY APPLICATION, 2021–2029 (USD MILLION)
                                      TABLE 102 CANADA: MARKET FOR RESEARCH APPLICATIONS, BY TYPE, 2021–2029 (USD MILLION)
                                      TABLE 103 CANADA: MARKET, BY END USER, 2021–2029 (USD MILLION)
     11.3 EUROPE 
             TABLE 104 EUROPE: PIPETTE CALIBRATORS MARKET, BY COUNTRY, 2021–2029 (USD MILLION)
             TABLE 105 EUROPE: MARKET, BY TYPE, 2021–2029 (USD MILLION)
             TABLE 106 EUROPE: MARKET, BY CHANNEL TYPE, 2021–2029 (USD MILLION)
             TABLE 107 EUROPE: MARKET, BY METHOD, 2021–2029 (USD MILLION)
             TABLE 108 EUROPE: MARKET, BY APPLICATION, 2021–2029 (USD MILLION)
             TABLE 109 EUROPE: MARKET FOR RESEARCH APPLICATIONS, BY TYPE, 2021–2029 (USD MILLION)
             TABLE 110 EUROPE: MARKET, BY END USER, 2021–2029 (USD MILLION)
             11.3.1 EUROPE: RECESSION IMPACT
             11.3.2 GERMANY
                        11.3.2.1 Large number of ongoing drug research projects to drive market
                                      TABLE 111 GERMANY: PIPETTE CALIBRATORS MARKET, BY TYPE, 2021–2029 (USD MILLION)
                                      TABLE 112 GERMANY: MARKET, BY CHANNEL TYPE, 2021–2029 (USD MILLION)
                                      TABLE 113 GERMANY: MARKET, BY METHOD, 2021–2029 (USD MILLION)
                                      TABLE 114 GERMANY: MARKET, BY APPLICATION, 2021–2029 (USD MILLION)
                                      TABLE 115 GERMANY: MARKET FOR RESEARCH APPLICATIONS, BY TYPE, 2021–2029 (USD MILLION)
                                      TABLE 116 GERMANY: MARKET, BY END USER, 2021–2029 (USD MILLION)
                                      TABLE 117 GERMANY: MARKET, BY END USER, 2021–2029 (UNITS)
             11.3.3 UK
                        11.3.3.1 Rising number of academia-industry partnerships and research activities to drive growth
                                      TABLE 118 UK: PIPETTE CALIBRATORS MARKET, BY TYPE, 2021–2029 (USD MILLION)
                                      TABLE 119 UK: MARKET, BY CHANNEL TYPE, 2021–2029 (USD MILLION)
                                      TABLE 120 UK: MARKET, BY METHOD, 2021–2029 (USD MILLION)
                                      TABLE 121 UK: MARKET, BY APPLICATION, 2021–2029 (USD MILLION)
                                      TABLE 122 UK: MARKET FOR RESEARCH APPLICATIONS, BY TYPE, 2021–2029 (USD MILLION)
                                      TABLE 123 UK: MARKET, BY END USER, 2021–2029 (USD MILLION)
                                      TABLE 124 UK: MARKET, BY END USER, 2021–2029 (UNITS)
             11.3.4 FRANCE
                        11.3.4.1 Increasing investments in infrastructure development to drive market growth
                                      TABLE 125 FRANCE: PIPETTE CALIBRATORS MARKET, BY TYPE, 2021–2029 (USD MILLION)
                                      TABLE 126 FRANCE: MARKET, BY CHANNEL TYPE, 2021–2029 (USD MILLION)
                                      TABLE 127 FRANCE: MARKET, BY METHOD, 2021–2029 (USD MILLION)
                                      TABLE 128 FRANCE: MARKET, BY APPLICATION, 2021–2029 (USD MILLION)
                                      TABLE 129 FRANCE: MARKET FOR RESEARCH APPLICATIONS, BY TYPE, 2021–2029 (USD MILLION)
                                      TABLE 130 FRANCE: MARKET, BY END USER, 2021–2029 (USD MILLION)
                                      TABLE 131 FRANCE: MARKET, BY END USER, 2021–2029 (UNITS)
             11.3.5 ITALY
                        11.3.5.1 Growing number of biotechnology firms to support market growth
                                      TABLE 132 ITALY: PIPETTE CALIBRATORS MARKET, BY TYPE, 2021–2029 (USD MILLION)
                                      TABLE 133 ITALY: MARKET, BY CHANNEL TYPE, 2021–2029 (USD MILLION)
                                      TABLE 134 ITALY: MARKET, BY METHOD, 2021–2029 (USD MILLION)
                                      TABLE 135 ITALY: MARKET, BY APPLICATION, 2021–2029 (USD MILLION)
                                      TABLE 136 ITALY: MARKET FOR RESEARCH APPLICATIONS, BY TYPE, 2021–2029 (USD MILLION)
                                      TABLE 137 ITALY: MARKET, BY END USER, 2021–2029 (USD MILLION)
             11.3.6 SPAIN
                        11.3.6.1 Availability of research funds and grants to boost market growth
                                      TABLE 138 SPAIN: PIPETTE CALIBRATORS MARKET, BY TYPE, 2021–2029 (USD MILLION)
                                      TABLE 139 SPAIN: MARKET, BY CHANNEL TYPE, 2021–2029 (USD MILLION)
                                      TABLE 140 SPAIN: MARKET, BY METHOD, 2021–2029 (USD MILLION)
                                      TABLE 141 SPAIN: MARKET, BY APPLICATION, 2021–2029 (USD MILLION)
                                      TABLE 142 SPAIN: MARKET FOR RESEARCH APPLICATIONS, BY TYPE, 2021–2029 (USD MILLION)
                                      TABLE 143 SPAIN: MARKET, BY END USER, 2021–2029 (USD MILLION)
             11.3.7 REST OF EUROPE
                        TABLE 144 REST OF EUROPE: PIPETTE CALIBRATORS MARKET, BY TYPE, 2021–2029 (USD MILLION)
                        TABLE 145 REST OF EUROPE: MARKET, BY CHANNEL TYPE, 2021–2029 (USD MILLION)
                        TABLE 146 REST OF EUROPE: MARKET, BY METHOD, 2021–2029 (USD MILLION)
                        TABLE 147 REST OF EUROPE: MARKET, BY APPLICATION, 2021–2029 (USD MILLION)
                        TABLE 148 REST OF EUROPE: MARKET FOR RESEARCH APPLICATIONS, BY TYPE, 2021–2029 (USD MILLION)
                        TABLE 149 REST OF EUROPE: MARKET, BY END USER, 2021–2029 (USD MILLION)
     11.4 ASIA PACIFIC 
             FIGURE 30 ASIA PACIFIC: PIPETTE CALIBRATORS MARKET SNAPSHOT
             TABLE 150 ASIA PACIFIC: MARKET, BY COUNTRY, 2021–2029 (USD MILLION)
             TABLE 151 ASIA PACIFIC: MARKET, BY TYPE, 2021–2029 (USD MILLION)
             TABLE 152 ASIA PACIFIC: MARKET, BY CHANNEL TYPE, 2021–2029 (USD MILLION)
             TABLE 153 ASIA PACIFIC: MARKET, BY METHOD, 2021–2029 (USD MILLION)
             TABLE 154 ASIA PACIFIC: MARKET, BY APPLICATION, 2021–2029 (USD MILLION)
             TABLE 155 ASIA PACIFIC: MARKET FOR RESEARCH APPLICATIONS, BY TYPE, 2021–2029 (USD MILLION)
             TABLE 156 ASIA PACIFIC: MARKET, BY END USER, 2021–2029 (USD MILLION)
             11.4.1 ASIA PACIFIC: RECESSION IMPACT
             11.4.2 CHINA
                        11.4.2.1 Increasing investments by companies in innovative drugs to drive market
                                      TABLE 157 CHINA: PIPETTE CALIBRATORS MARKET, BY TYPE, 2021–2029 (USD MILLION)
                                      TABLE 158 CHINA: MARKET, BY CHANNEL TYPE, 2021–2029 (USD MILLION)
                                      TABLE 159 CHINA: MARKET, BY METHOD, 2021–2029 (USD MILLION)
                                      TABLE 160 CHINA: MARKET, BY APPLICATION, 2021–2029 (USD MILLION)
                                      TABLE 161 CHINA: MARKET FOR RESEARCH APPLICATIONS, BY TYPE, 2021–2029 (USD MILLION)
                                      TABLE 162 CHINA: MARKET, BY END USER, 2021–2029 (USD MILLION)
                                      TABLE 163 CHINA: MARKET, BY END USER, 2021–2029 (UNITS)
             11.4.3 JAPAN
                        11.4.3.1 Government initiatives to drive market
                                      TABLE 164 JAPAN: PIPETTE CALIBRATORS MARKET, BY TYPE, 2021–2029 (USD MILLION)
                                      TABLE 165 JAPAN: MARKET, BY CHANNEL TYPE, 2021–2029 (USD MILLION)
                                      TABLE 166 JAPAN: MARKET, BY METHOD, 2021–2029 (USD MILLION)
                                      TABLE 167 JAPAN: MARKET, BY APPLICATION, 2021–2029 (USD MILLION)
                                      TABLE 168 JAPAN: MARKET FOR RESEARCH APPLICATIONS, BY TYPE, 2021–2029 (USD MILLION)
                                      TABLE 169 JAPAN: MARKET, BY END USER, 2021–2029 (USD MILLION)
                                      TABLE 170 JAPAN: MARKET, BY END USER, 2021–2029 (UNITS)
             11.4.4 INDIA
                        11.4.4.1 Growing biotech sector and favorable government policies to drive market
                                      TABLE 171 INDIA: PIPETTE CALIBRATORS MARKET, BY TYPE, 2021–2029 (USD MILLION)
                                      TABLE 172 INDIA: MARKET, BY CHANNEL TYPE, 2021–2029 (USD MILLION)
                                      TABLE 173 INDIA: MARKET, BY METHOD, 2021–2029 (USD MILLION)
                                      TABLE 174 INDIA: MARKET, BY APPLICATION, 2021–2029 (USD MILLION)
                                      TABLE 175 INDIA: MARKET FOR RESEARCH APPLICATIONS, BY TYPE, 2021–2029 (USD MILLION)
                                      TABLE 176 INDIA: MARKET, BY END USER, 2021–2029 (USD MILLION)
                                      TABLE 177 INDIA: MARKET, BY END USER, 2021–2029 (UNITS)
             11.4.5 REST OF ASIA PACIFIC
                        TABLE 178 REST OF ASIA PACIFIC: PIPETTE CALIBRATORS MARKET, BY TYPE, 2021–2029 (USD MILLION)
                        TABLE 179 REST OF ASIA PACIFIC: MARKET, BY CHANNEL TYPE, 2021–2029 (USD MILLION)
                        TABLE 180 REST OF ASIA PACIFIC: MARKET, BY METHOD, 2021–2029 (USD MILLION)
                        TABLE 181 REST OF ASIA PACIFIC: MARKET, BY APPLICATION, 2021–2029 (USD MILLION)
                        TABLE 182 REST OF ASIA PACIFIC: MARKET FOR RESEARCH APPLICATIONS, BY TYPE, 2021–2029 (USD MILLION)
                        TABLE 183 REST OF ASIA PACIFIC: MARKET, BY END USER, 2021–2029 (USD MILLION)
     11.5 REST OF THE WORLD 
             TABLE 184 REST OF THE WORLD: PIPETTE CALIBRATORS MARKET, BY REGION, 2021–2029 (USD MILLION)
             TABLE 185 REST OF THE WORLD: MARKET, BY TYPE, 2021–2029 (USD MILLION)
             TABLE 186 REST OF THE WORLD: MARKET, BY CHANNEL TYPE, 2021–2029 (USD MILLION)
             TABLE 187 REST OF THE WORLD: MARKET, BY METHOD, 2021–2029 (USD MILLION)
             TABLE 188 REST OF THE WORLD: MARKET, BY APPLICATION, 2021–2029 (USD MILLION)
             TABLE 189 REST OF THE WORLD: MARKET FOR RESEARCH APPLICATIONS, BY TYPE, 2021–2029 (USD MILLION)
             TABLE 190 REST OF THE WORLD: MARKET, BY END USER, 2021–2029 (USD MILLION)
             11.5.1 REST OF THE WORLD: RECESSION IMPACT
             11.5.2 LATIN AMERICA
                        11.5.2.1 Growing biosimilar investments to drive market growth
                                      TABLE 191 LATIN AMERICA: PIPETTE CALIBRATORS MARKET, BY TYPE, 2021–2029 (USD MILLION)
                                      TABLE 192 LATIN AMERICA: MARKET, BY CHANNEL TYPE, 2021–2029 (USD MILLION)
                                      TABLE 193 LATIN AMERICA: MARKET, BY METHOD, 2021–2029 (USD MILLION)
                                      TABLE 194 LATIN AMERICA: MARKET, BY APPLICATION, 2021–2029 (USD MILLION)
                                      TABLE 195 LATIN AMERICA: MARKET FOR RESEARCH APPLICATIONS, BY TYPE, 2021–2029 (USD MILLION)
                                      TABLE 196 LATIN AMERICA: MARKET, BY END USER, 2021–2029 (USD MILLION)
             11.5.3 MIDDLE EAST & AFRICA
                        11.5.3.1 High prevalence of chronic conditions to aid market growth
                                      TABLE 197 MIDDLE EAST & AFRICA: PIPETTE CALIBRATORS MARKET, BY TYPE, 2021–2029 (USD MILLION)
                                      TABLE 198 MIDDLE EAST & AFRICA: MARKET, BY CHANNEL TYPE, 2021–2029 (USD MILLION)
                                      TABLE 199 MIDDLE EAST & AFRICA: MARKET, BY METHOD, 2021–2029 (USD MILLION)
                                      TABLE 200 MIDDLE EAST & AFRICA: MARKET, BY APPLICATION, 2021–2029 (USD MILLION)
                                      TABLE 201 MIDDLE EAST & AFRICA: MARKET FOR RESEARCH APPLICATIONS, BY TYPE, 2021–2029 (USD MILLION)
                                      TABLE 202 MIDDLE EAST & AFRICA: MARKET, BY END USER, 2021–2029 (USD MILLION)
             11.5.4 GCC COUNTRIES
                        11.5.4.1 Rising demand for biopharmaceuticals to propel market
                                      TABLE 203 GCC COUNTRIES: PIPETTE CALIBRATORS MARKET, BY TYPE, 2021–2029 (USD MILLION)
                                      TABLE 204 GCC COUNTRIES: MARKET, BY CHANNEL TYPE, 2021–2029 (USD MILLION)
                                      TABLE 205 GCC COUNTRIES: MARKET, BY METHOD, 2021–2029 (USD MILLION)
                                      TABLE 206 GCC COUNTRIES: MARKET, BY APPLICATION, 2021–2029 (USD MILLION)
                                      TABLE 207 GCC COUNTRIES: MARKET FOR RESEARCH APPLICATIONS, BY TYPE, 2021–2029 (USD MILLION)
                                      TABLE 208 GCC COUNTRIES: MARKET, BY END USER, 2021–2029 (USD MILLION)
 
12 COMPETITIVE LANDSCAPE (Page No. - 189)
     12.1 OVERVIEW 
     12.2 STRATEGIES ADOPTED BY KEY PLAYERS 
             TABLE 209 OVERVIEW OF STRATEGIES ADOPTED BY KEY PIPETTE CALIBRATOR COMPANIES
     12.3 REVENUE ANALYSIS 
             FIGURE 31 REVENUE ANALYSIS OF KEY COMPANIES IN PIPETTE CALIBRATORS MARKET, 2018–2022 (USD MILLION)
     12.4 MARKET SHARE ANALYSIS 
             FIGURE 32 PIPETTE CALIBRATORS INDUSTRY SHARE ANALYSIS, BY KEY PLAYER (2022)
             TABLE 210 PIPETTE CALIBRATORS INDUSTRY: DEGREE OF COMPETITION
     12.5 BRAND/PRODUCT COMPARISON 
             FIGURE 33 PIPETTE CALIBRATORS INDUSTRY: BRAND COMPARISON, BY KEY PLAYER
     12.6 COMPANY EVALUATION MATRIX: KEY PLAYERS 
             12.6.1 STARS
             12.6.2 EMERGING LEADERS
             12.6.3 PERVASIVE PLAYERS
             12.6.4 PARTICIPANTS
                        FIGURE 34 PIPETTE CALIBRATORS INDUSTRY: COMPANY EVALUATION MATRIX (KEY PLAYERS), 2022
             12.6.5 COMPANY FOOTPRINT
                        TABLE 211 PRODUCT FOOTPRINT (KEY PLAYERS)
                        TABLE 212 REGIONAL FOOTPRINT (KEY PLAYERS)
                        TABLE 213 COMPANY FOOTPRINT (KEY PLAYERS)
     12.7 COMPANY EVALUATION MATRIX: STARTUPS/SMES 
             12.7.1 PROGRESSIVE COMPANIES
             12.7.2 STARTING BLOCKS
             12.7.3 RESPONSIVE COMPANIES
             12.7.4 DYNAMIC COMPANIES
                        FIGURE 35 PIPETTE CALIBRATORS INDUSTRY: COMPANY EVALUATION MATRIX (STARTUPS/SMES), 2022
             12.7.5 COMPETITIVE BENCHMARKING
                        TABLE 214 PIPETTE CALIBRATORS INDUSTRY: DETAILED LIST OF KEY STARTUPS/SMES
                        TABLE 215 PRODUCT FOOTPRINT (STARTUPS/SMES)
                        TABLE 216 REGIONAL FOOTPRINT (STARTUPS/SMES)
                        TABLE 217 COMPANY FOOTPRINT (STARTUPS/SMES)
     12.8 COMPETITIVE SCENARIO 
             12.8.1 PRODUCT LAUNCHES
                        TABLE 218 PIPETTE CALIBRATORS INDUSTRY: PRODUCT LAUNCHES, JANUARY 2021–JANUARY 2024
             12.8.2 DEALS
                        TABLE 219 PIPETTE CALIBRATORS MARKET: DEALS, JANUARY 2020– JANUARY 2024
 
13 COMPANY PROFILES (Page No. - 202)
     13.1 KEY PLAYERS 
(Business Overview, Products/Services/Solutions Offered, MnM View, Key Strengths and Right to Win, Strategic Choices Made, Weaknesses and Competitive Threats, Recent Developments)*
             13.1.1 METTLER TOLEDO
                        TABLE 220 METTLER TOLEDO: BUSINESS OVERVIEW
                        FIGURE 36 METTLER TOLEDO: COMPANY SNAPSHOT (2022)
             13.1.2 SARTORIUS AG
                        TABLE 221 SARTORIUS AG: BUSINESS OVERVIEW
                        FIGURE 37 SARTORIUS AG: COMPANY SNAPSHOT (2022)
             13.1.3 A&D COMPANY, LIMITED
                        TABLE 222 A&D COMPANY, LIMITED: BUSINESS OVERVIEW
                        FIGURE 38 A&D COMPANY, LIMITED: COMPANY SNAPSHOT (2022)
             13.1.4 ADVANCED INSTRUMENTS
                        TABLE 223 ADVANCED INSTRUMENTS: BUSINESS OVERVIEW
             13.1.5 ACCURIS INSTRUMENTS
                        TABLE 224 ACCURIS INSTRUMENTS: BUSINESS OVERVIEW
             13.1.6 IKA WORKS GMBH & CO. KG
                        TABLE 225 IKA WORKS GMBH & CO. KG: BUSINESS OVERVIEW
             13.1.7 RADWAG BALANCES AND SCALES
                        TABLE 226 RADWAG BALANCES AND SCALES: BUSINESS OVERVIEW
             13.1.8 AVANTOR, INC.
                        TABLE 227 AVANTOR, INC.: BUSINESS OVERVIEW
                        FIGURE 39 AVANTOR, INC.: COMPANY SNAPSHOT (2022)
             13.1.9 BIOHIT OYJ
                        TABLE 228 BIOHIT OYJ: BUSINESS OVERVIEW
                        FIGURE 40 BIOHIT OYJ: COMPANY SNAPSHOT (2022)
             13.1.10 CALIBRATION LAB
                        TABLE 229 CALIBRATION LAB: BUSINESS OVERVIEW
             13.1.11 BRAND GMBH + CO KG
                        TABLE 230 BRAND GMBH + CO KG: BUSINESS OVERVIEW
*Business Overview, Products/Services/Solutions Offered, MnM View, Key Strengths and Right to Win, Strategic Choices Made, Weaknesses and Competitive Threats, Recent Developments might not be captured in case of unlisted companies.s
     13.2 OTHER PLAYERS 
             13.2.1 PRIME TECHNOLOGIES
                        TABLE 231 PRIME TECHNOLOGIES: COMPANY OVERVIEW
             13.2.2 BIOMEDICAL COMPUTING LTD.
                        TABLE 232 BIOMEDICAL COMPUTING LTD.: COMPANY OVERVIEW
             13.2.3 COLE-PARMER INSTRUMENT COMPANY, LLC
                        TABLE 233 COLE-PARMER INSTRUMENT COMPANY, LLC: COMPANY OVERVIEW
             13.2.4 HUMPAGE TECHNOLOGY LTD.
                        TABLE 234 HUMPAGE TECHNOLOGY LTD.: COMPANY OVERVIEW
             13.2.5 IBR INC.
                        TABLE 235 IBR INC.: COMPANY OVERVIEW
             13.2.6 SARTORIUS CROATIA
                        TABLE 236 SARTORIUS CROATIA: COMPANY OVERVIEW
             13.2.7 GILSON INCORPORATED
                        TABLE 237 GILSON INCORPORATED: COMPANY OVERVIEW
             13.2.8 LABTRONICS INC.
                        TABLE 238 LABTRONICS INC.: COMPANY OVERVIEW
             13.2.9 TECHVOLVER APS
                        TABLE 239 TECHVOLVER APS: COMPANY OVERVIEW
 
14 APPENDIX (Page No. - 227)
     14.1 DISCUSSION GUIDE 
     14.2 KNOWLEDGESTORE: MARKETSANDMARKETS’ SUBSCRIPTION PORTAL 
     14.3 CUSTOMIZATION OPTIONS 
     14.4 RELATED REPORTS 
     14.5 AUTHOR DETAILS 

The objective of the study is to analyze the key market dynamics, such as drivers, opportunities, challenges, restraints, and key player strategies. To track company developments such as acquisitions, product launches, expansions, collaborations, agreements, and partnerships of the leading players, the competitive landscape of the pipette calibrators market to analyze market players on various parameters within the broad categories of business and product strategy. Top-down and bottom-up approaches were used to estimate the market size. To estimate the market size of segments and subsegments, the market breakdown and data triangulation were used.

The four steps involved in estimating the market size are

Collecting Secondary Data:

The secondary research data collection process involves the usage of secondary sources, directories, databases (such as Bloomberg Businessweek, Factiva, and D&B), annual reports, investor presentations, and SEC filings of companies. Secondary research was used to identify and collect information useful for the extensive, technical, market-oriented, and commercial study of the pipette calibrators market. A database of the key industry leaders was also prepared using secondary research.

Collecting Primary Data:

The primary research data was conducted after acquiring knowledge about the pipette calibrators market scenario through secondary research. A significant number of primary interviews were conducted with stakeholders from both the demand side (such as pharmaceutical & biotechnology industries, hospitals, and research & academic institutes) and supply side (such as included various industry experts, such as Directors, Chief X Officers (CXOs), Vice Presidents (VPs) from business development, marketing, and product development teams, product manufacturers, wholesalers, channel partners, and distributors) across major countries of North America, Europe, Asia Pacific, the Middle East & Africa, and Latin America. Approximately 40% of the primary interviews were conducted with stakeholders from the demand side, while those from the supply side accounted for the remaining 60%. Primary data for this report was collected through questionnaires, emails, and telephonic interviews.

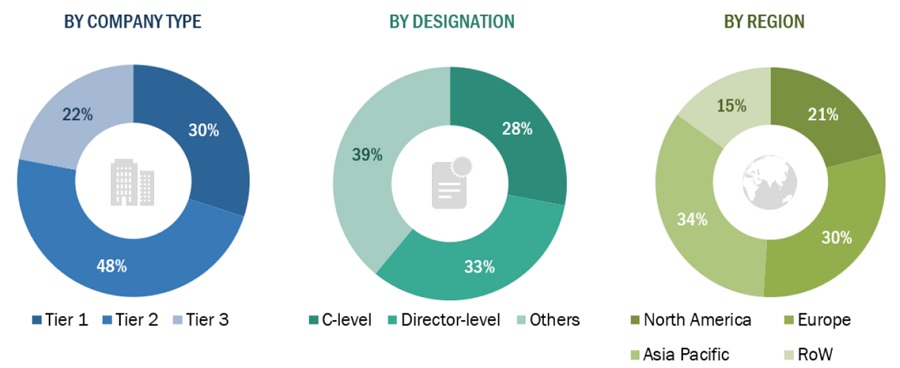
A breakdown of the primary respondents is provided below:

Breakdown of Primary Participants:
Pipette Calibrators Market Size, and Share

Note 1: *Others include sales managers, marketing managers, and product managers.

Note 2: Tiers are defined based on a company’s total revenue as of 2022: Tier 1=> USD 1 billion, Tier 2 = USD 500 million to USD 1 billion, and Tier 3=< USD 500 million.

To know about the assumptions considered for the study, download the pdf brochure

Market Size Estimation:

All major product manufacturers offering various pipette calibrators were identified at the global/regional level. Revenue mapping was done for the major players and was extrapolated to arrive at the global market value of each type of segment. The market value pipette calibrators market was also split into various segments and subsegments at the region and country level based on:

  • Product mapping of various manufacturers for each type of pipette calibrators market at the regional and country-level
  • Relative adoption pattern of each pipette calibrators market among key application segments at the regional and/or country-level
  • Detailed primary research to gather qualitative and quantitative information related to segments and subsegments at the regional and/or country level.
  • Detailed secondary research to gauge the prevailing market trends at the regional and/or country level

Global Pipette calibrators Market Size: Top Down Approach

Pipette Calibrators Market Size, and Share

To know about the assumptions considered for the study, Request for Free Sample Report

Global Pipette calibrators Market Size: Bottom-Up Approach
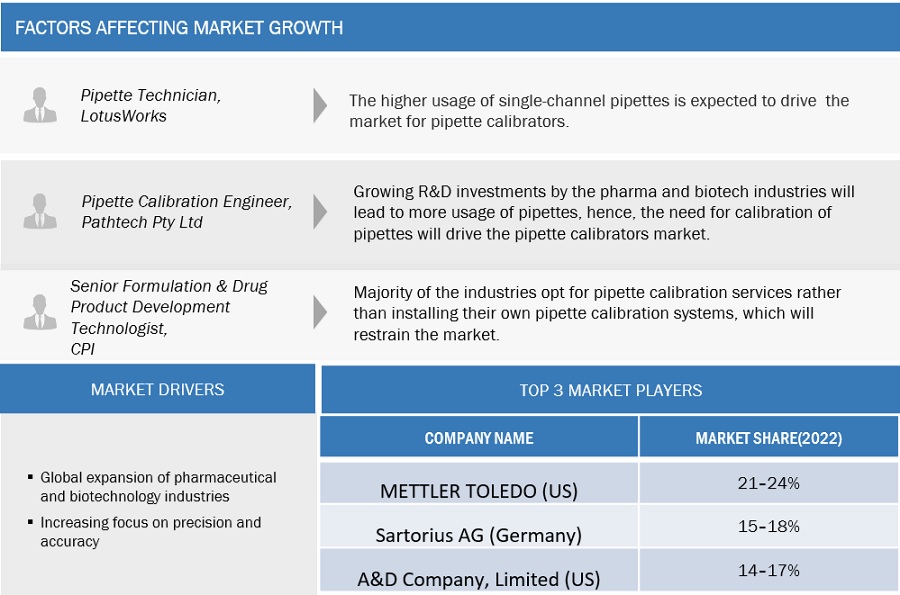
Pipette Calibrators Market Size, and Share

Data Triangulation:

After arriving at the overall market size—using the market size estimation processes—the market was split into several segments and subsegments. To complete the overall market engineering process and arrive at the exact statistics of each market segment and subsegment, data triangulation and market breakdown procedures were employed, wherever applicable. The data was triangulated by studying various factors and trends from both the demand and supply sides in the Pipette calibrators industry.

Market Definition:

Pipettes are essential tools for accurately measuring and transferring liquids in various scientific fields, including biology, chemistry, and medicine. The accuracy and precision of pipettes depends on various factors, such as the design of the pipette, the operator’s technique, and the calibration of the pipette. Pipette calibration is a process of verifying the accuracy of a pipette’s volume measurements. The calibration process involves comparing the actual volume dispensed by the pipette with the intended volume. Calibration can be done using either gravimetric or photometric methods.

Key Stakeholders:

  • Senior Management
  • Finance/Procurement Department
  • R&D Department
  • Scientists/Technicians

Report Objectives:

  • To provide detailed information about the factors influencing the market growth (such as drivers, restraints, opportunities, and challenges)
  • To define, describe, segment, and forecast the pipette calibrators market by market by type, channel type, method, application, end user, and region
  • To analyze market opportunities for stakeholders and provide details of the competitive landscape for key players
  • To analyze micro markets with respect to individual growth trends, prospects, and contributions to the overall pipette calibrators market
  • To forecast the size of the pipette calibrators market in five main regions along with their respective key countries, namely, North America, Europe, the Asia Pacific, Rest of the world.
  • To profile key players in the pipette calibrators market and comprehensively analyze their core competencies and market shares
  • To track and analyze competitive developments, such as acquisitions; product launches; expansions; collaborations, agreements, & partnerships; and R&D activities of the leading players in the pipette calibrators market.
  • To benchmark players within the pipette calibrators market using the Competitive Leadership Mapping framework, which analyzes market players on various parameters within the broad categories of business and product strategy

Available Customizations:

MarketsandMarkets offers the following customizations for this market report:

  • Additional country-level analysis of the Pipette calibrators market
  • Profiling of additional market players (up to 5)

Product Analysis:

  • Product matrix, which provides a detailed comparison of the product portfolio of each company in the Pipette calibrators Market
Custom Market Research Services

We will customize the research for you, in case the report listed above does not meet with your exact requirements. Our custom research will comprehensively cover the business information you require to help you arrive at strategic and profitable business decisions.

Request Customization
Report Code
MD 8958
Published ON
Feb, 2024
Choose License Type
BUY NOW
  • SHARE
X
Request Customization
Speak to Analyst
Speak to Analyst
OR FACE-TO-FACE MEETING
PERSONALIZE THIS RESEARCH
  • Triangulate with your Own Data
  • Get Data as per your Format and Definition
  • Gain a Deeper Dive on a Specific Application, Geography, Customer or Competitor
  • Any level of Personalization
REQUEST A FREE CUSTOMIZATION
LET US HELP YOU!
  • What are the Known and Unknown Adjacencies Impacting the Pipette Calibrators Market
  • What will your New Revenue Sources be?
  • Who will be your Top Customer; what will make them switch?
  • Defend your Market Share or Win Competitors
  • Get a Scorecard for Target Partners
CUSTOMIZED WORKSHOP REQUEST
+1-888-600-6441
  • Call Us
  • +1-888-600-6441 (Corporate office hours)
  • +1-888-600-6441 (US/Can toll free)
  • +44-800-368-9399 (UK office hours)
CONNECT WITH US
ABOUT TRUST ONLINE
©2024 MarketsandMarkets Research Private Ltd. All rights reserved
DMCA.com Protection Status Website Feedback