
Polyethylene Furanoate (PEF) Market

Polyethylene Furanoate (PEF) Market by Source (Plant Based, Bio Based), Grade, Application (Bottles, Films, Fibers), End-Use Industry (Packaging, Fiber & Textiles, Electronics & Electrical, Pharmaceuticals), And Region - Global Forecast to 2030
Updated on : December 16, 2025


POLYETHYLENE FURANOATE MARKET
Source: Secondary Research, Interviews with Experts, MarketsandMarkets Analysis
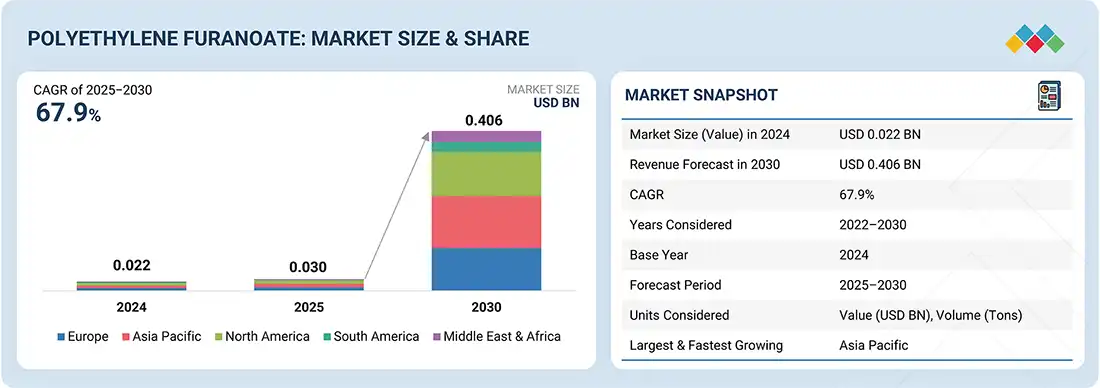
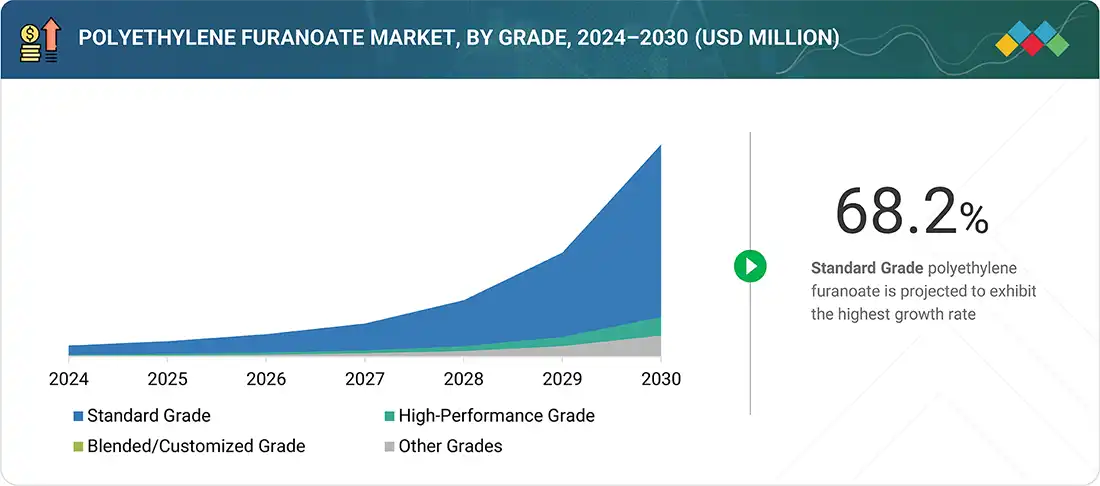
Polyethylene Furanoate Market was valued at USD 30.5 million in 2025 and is projected to reach USD 406.6 million by 2030, growing at 67.9% cagr from 2025 to 2030. Polyethylene furanoate (PEF), which is polymerized from 2,5-furandicarboxylic acid (FDCA) derived from plant sugars with ethylene glycol, is a bio-based polymer that can replace traditional PET plastics. PEF is emerging in packaging and fiber/textile applications due to its excellent mechanical properties and gas and moisture barrier performance, all of which support sustainability trends.
KEY TAKEAWAYS
-
BY SOURCEPolyethylene furanoate is sourced from plant-based and bio-based feedstocks such as corn, wheat, sugar beets, and lignocellulosic biomass through the conversion of sugars into 2,5-furandicarboxylic acid and bio-ethylene glycol
-
BY GRADESignificant trends in polyethylene furanoate grades are increasing standard grade adoption for food and beverage packaging, establishing demand for high-performance grades that have better barrier and strength properties, experimenting with blended or customized grades for niche applications, and looking to sustainable, innovative uses.
-
BY APPLICATIONThe market trends shaping applications for polyethylene furanoate include continued strong demand for sustainable packaging for bottles and sustainable films; growing demand for polyester fibers (in textiles); and increasing demand for molded and extruded components for sustainable industrial applications
-
BY END-USE INDUSTRYKey trends for polyethylene furanoate end-use industries include growth in sustainable packaging, fibers, electronics, automotive, pharmaceuticals, and other green applications.
-
BY REGIONEurope is expected to grow the fastest, with a CAGR of 63.8%, driven by stringent environmental regulations and strong adoption in the packaging and textile & fiber industries.
-
COMPETITIVE LANDSCAPEThe market is driven by strategic collaborations, capacity expansions, and technological innovations from leading players such as Avantium (Netherlands), Sulzer Ltd (Switzerland), AVA Biochem AG (Switzerland), and Origin Materials (US). These companies are advancing recycling technologies and broadening end-use adoption, reflecting the growing demand for sustainable and cost-effective alternatives to PET.
The polyethylene furanoate market is poised for strong growth, supported by advancements in recycling technologies and the rising demand for sustainable materials. With rising demand for sustainable and eco-friendly packaging solutions, the polyethylene furanoate market is expanding. The segments benefiting from the market growth are applications and end-use industries.
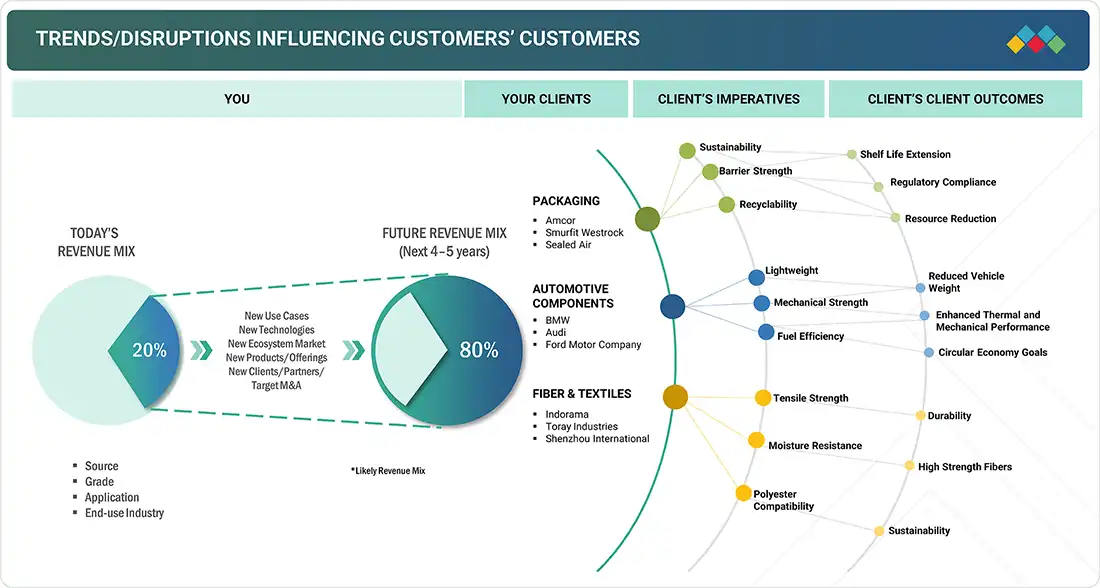
TRENDS & DISRUPTIONS IMPACTING CUSTOMERS' CUSTOMERS
Changes in customer trends or disruptions impact consumers’ businesses. These shifts impact the revenues of end users. Consequently, the revenue impact on end users is expected to affect the revenues of polyethylene furanoate suppliers, which in turn, impacts the revenues of polyethylene furanoate manufacturers.
Source: Secondary Research, Interviews with Experts, MarketsandMarkets Analysis
POLYETHYLENE FURANOATE MARKET DYNAMICS
Level
-
Increasing demand for sustainable and eco-friendly packaging solutions

-
Government policies and incentives promoting renewable materials

Level
-
Dominance of conventional plastics

-
Immature production infrastructure for PEF

Level
-
Diverse application potential

-
Growth of bio-based plastics

Level
-
High production costs

Source: Secondary Research, Interviews with Experts, MarketsandMarkets Analysis
Driver: Increasing demand for sustainable and eco-friendly packaging solutions
Polyethylene furanoate as a market will increase due to anticipated market expansion of sustainable, green packaging. PEF is a bio-based polyester derived from renewable plant sugar, which has recognized environmental advantage over petroleum-based products. Compared to PET, PEF offers superior barrier properties (particularly to oxygen and carbon dioxide), meaning PEF offers better shelf-stability of beverage and food, needs less material, and produces less waste. These benefits are increasingly attractive to consumers and policy makers as many stakeholders demand less plastic waste, pollution contamination, and transition to a circular economy.
Restraint: Dominance of conventional plastics
The continued dominance of conventional plastics continues to be a key limitation to the development of the polyethylene furanoate market. Traditional plastics like polyethylene (PE), polypropylene (PP), and polyethylene terephthalate (PET) have been widely packaged and consumed by buyers due to their accessibility, durability, and versatility. These factors can be attributed to the well-established infrastructure and recognizable supply chains that have been developed over the past century, supported by pricing structures set by investors. Traditionally, plastic offerings tend to dominate non-renewable materials in the marketplace due to their relative affordability, light weight, durability, and ability to competitively provide physical protection and barrier protection to food and beverages. The end availability of conventional plastic waste creates a high price point competitive barrier for most bio-based products like PEF, despite requiring modifications to its industrial generalization.
Opportunity: Diverse application potential
PEF is being actively deployed in packaging. Combining PEF's high air, moisture, and chemical barrier properties, as compared to other plastics, such as polyethylene terephthalate, allows PEF long-term storage for beverages, containers, and flexible films, achieving shelf life objectives and reduced spoilage. Other platforms for PEF development are in the technical textile area, where PEF fibers provide high tensile strength, high durability, and moisture-resilient properties used in sustainable apparel and home furnishings, and from an applied textile stand-point, engineered or technical textiles. The automotive and construction sectors continue to explore PEF fiber applications for lightweight and high-performance reinforcement materials to improve or change the physical properties of the entire engineered object being manufactured. Innovations in manufacturing technologies and regulatory shifts towards sustainable materials are positively impacting the marketplace for PEF across both established and emerging product categories.
Challenge: High production costs
The high production costs of polyethylene furanoate (PEF) present a significant challenge to the development of the PEF market. Unlike common plastics, PEF has a complex production step structure, which includes polymerization of biological feedstocks (such as 2,5-furandicarboxylic acid (FDCA) and ethylene glycol). For PEF, the primary biological monomer, 2,5-furandicarboxylic acid, is expensive to produce in large-scale quantities, primarily due to limited large-scale production capabilities. The high-cost intensive synthesis methods result in expensive raw materials and other production costs for manufacturers. Also, there is insufficient infrastructure for PEF manufacturing at this time, implying high capital costs and operational expenditures on manufacturing plants. Due to all of these factors, compared with the majority of petrochemical-based plastics, PEF is very expensive.
Polyethylene Furanoate Market: COMMERCIAL USE CASES ACROSS INDUSTRIES
| COMPANY | USE CASE DESCRIPTION | BENEFITS |
|---|---|---|
 |
Production of bio-based PEF for packaging, fibers, and bottles using proprietary YXY technology | High-performance, renewable, recyclable polymer with superior barrier and strength properties, enabling sustainable packaging and textile applications |
 |
Provides advanced polymerization and processing equipment for PEF manufacturing | Enables efficient, high-quality production of PEF with scalability and energy savings in polymer production processes |
 |
Conversion of renewable biomass into FDCA, the key monomer for PEF production | Cost-effective, sustainable raw material supply for large-scale bio-based polymer manufacture, reducing reliance on fossil fuels |
 |
Develops biotechnological routes to produce FDCA from sugars for PEF synthesis | Environmentally friendly, bio-based production pathway contributing to circular bioeconomy and reduced greenhouse gas emissions |
Logos and trademarks shown above are the property of their respective owners. Their use here is for informational and illustrative purposes only.
POLYETHYLENE FURANOATE MARKET ECOSYSTEM
The polyethylene furanoate ecosystem analysis involves identifying and analyzing interconnected relationships among various stakeholders, including raw material suppliers, manufacturers, distributors, and end users. The raw material suppliers provide 2,5-furandicarboxylic acid (FDCA) derived from plant sugars with ethylene glycol to polyethylene furanoate manufacturers. The distributors and suppliers establish contact between the manufacturing companies and end users to streamline the supply chain, increasing operational efficiency and profitability.
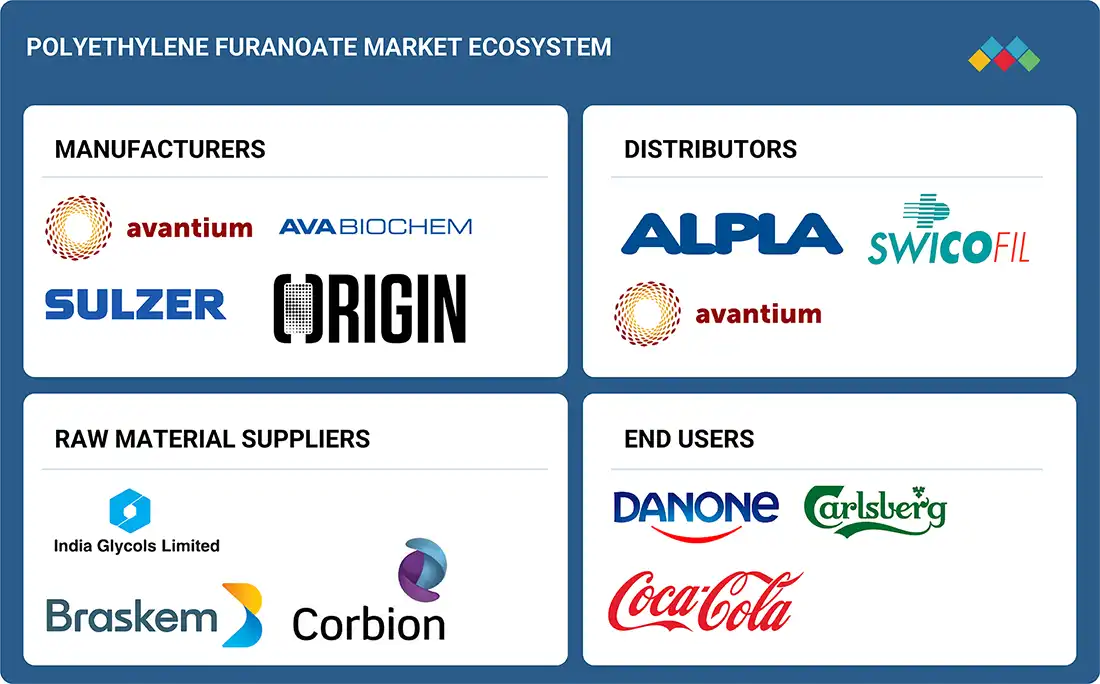
Logos and trademarks shown above are the property of their respective owners. Their use here is for informational and illustrative purposes only.
POLYETHYLENE FURANOATE MARKET SEGMENTS
Source: Secondary Research, Interviews with Experts, MarketsandMarkets Analysis
Polyethylene Furanoate Market, By Grade
The largest share of the polyethylene furanoate (PEF) market, by grade, is for standard grade PEF, as it is recognized as the most versatile and compatible grade of PEF in the marketplace, providing the best balance of mechanical strength, thermal resistance, and barrier qualities of PEF, making it the most ideal for mainstream packaging formats (bottles, containers, and films). In addition, it is compatible with the existing processing streams of PET, which helps manufacturers switch to bio-based intermediate with little to no changes in their production lines, meaning lower changeover costs. The high demand for sustainable packaging offerings by consumers, particularly those within the food & beverage industries will only continue to reinforce these dominant trends.
Polyethylene Furanoate Market, By Application
Bottles account for the largest portion of the polyethylene furanoate market by application. Growth in this category has been primarily driven by growing demand for sustainable beverage packaging across the world. PEF bottles have excellent oxygen and carbon dioxide barrier properties, extending the shelf life of carbonated and sensitive beverages, making them a superior option over traditional PET bottles. This is particularly beneficial particularly at a time when brands must respond to the growing regulatory requirements placed on them globally, as well as consumer demand for sustainable packaging. The result is that bottles, as a product category, have significant functional benefits, sustainability aspects and legislative driving force, cementing bottles as the leading PEF application segment and positioning the business case to grow globally.
Polyethylene Furanoate Market, By End-Use Industry
The largest share of the polyethylene furanoate market belongs to the packaging industry, due to PEF’s excellent gas barrier properties that enhance product shelf life, and its bio-based and recyclable attributes that satisfy sustainability and regulatory requirements. The compatibility of existing PET (polyethylene terephthalate) processing machinery and practices also helps facilitate the replacement of PEF for PET. These aspects create demand specifically in food & beverage packaging, which is the leading sector.
REGION
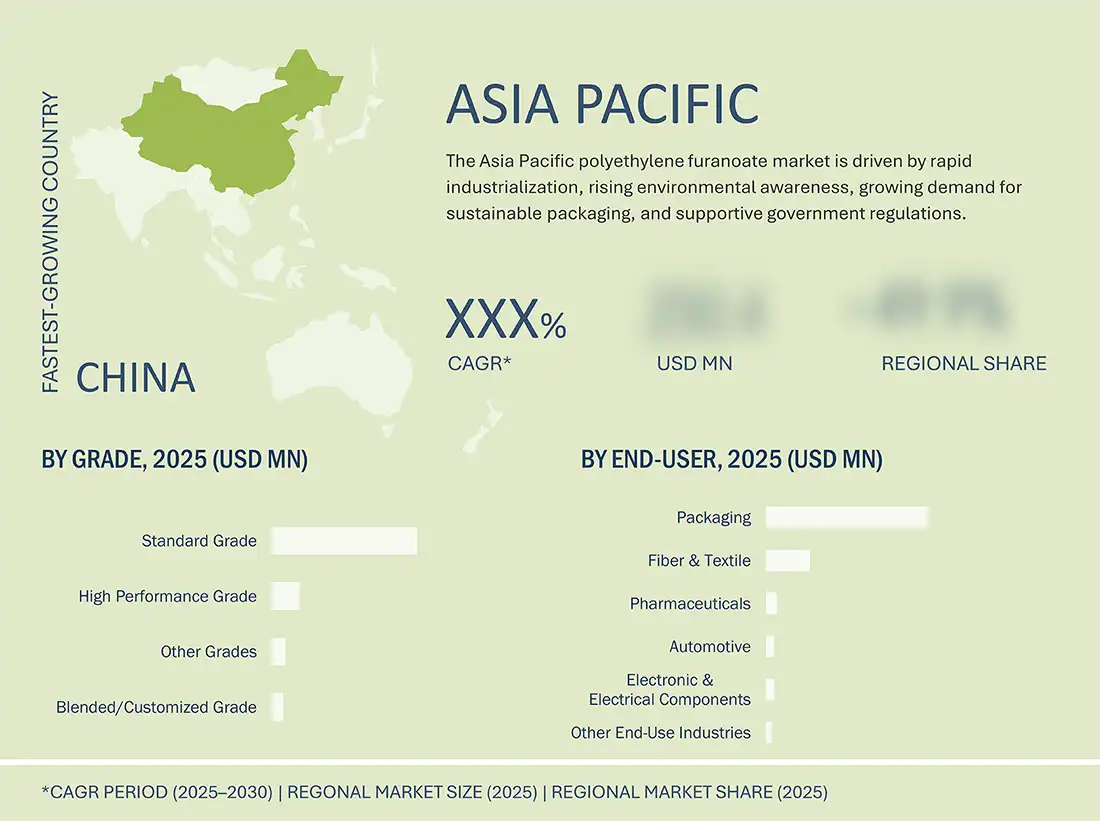
Asia Pacific to be fastest-growing region in global Polyethylene Furanoate market during forecast period
Asia Pacific is projected to be the fastest-growing PEF market during the forecast period due to fast-paced industrialization, rising environmental awareness, and increasing demand in key end-use industries such as packaging, food & beverage, automotive, and textiles. Countries such as China, India, and Japan are driving growth due to government regulations supporting sustainable and biodegradable products. The demand is further driven by a growing population, expansion in urbanization, and the growing middle class. Increased consumer demand for bio-based packaging will impact the market in this region.
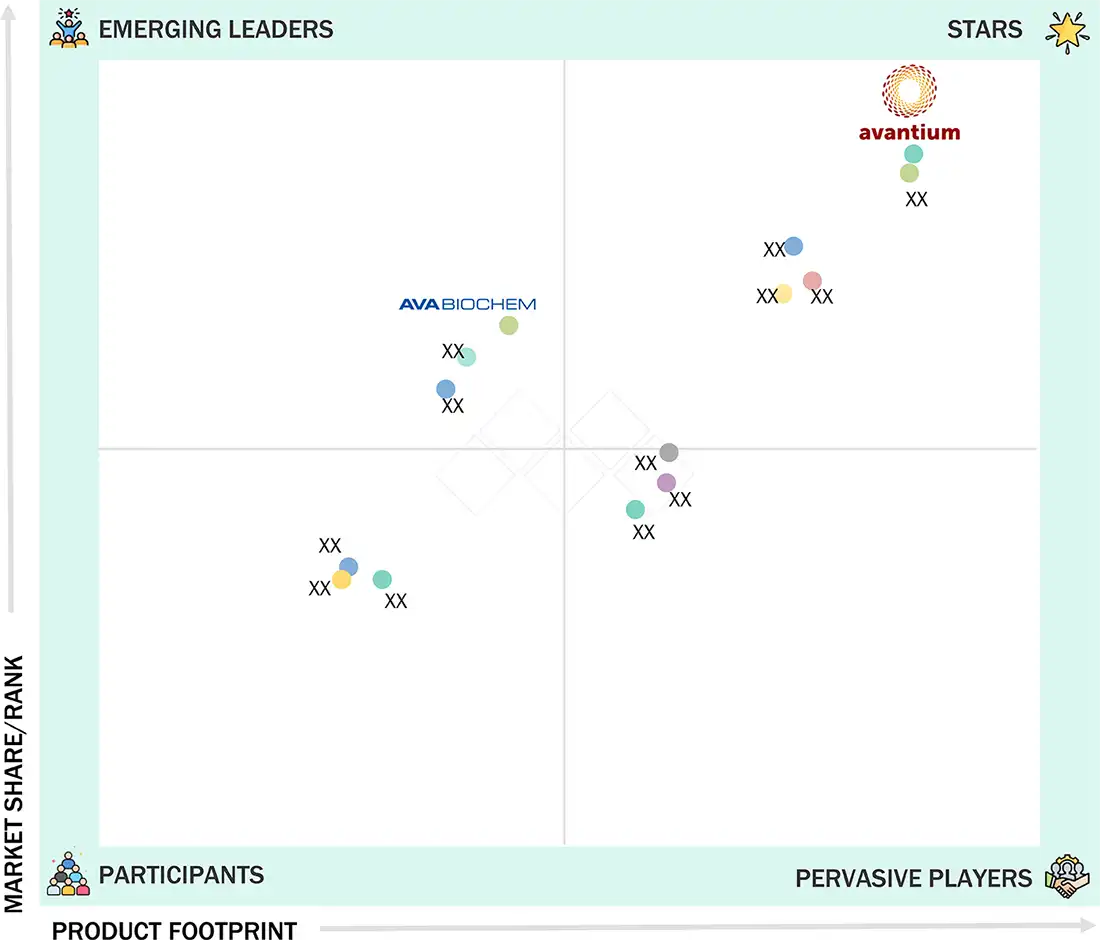
Polyethylene Furanoate Market: COMPANY EVALUATION MATRIX
In the polyethylene furanoate market matrix, Avantium (Star), a Netherlands company, leads the market through its high-quality polyethylene furanoate products, which find extensive applications in packaging applications. AVA Biochem AG (Emerging Leader) is gaining traction with its technological advancements in PEF.
Source: Secondary Research, Interviews with Experts, MarketsandMarkets Analysis
POLYETHYLENE FURANOATE MARKET PLAYERS
POLYETHYLENE FURANOATE MARKET SCOPE
| REPORT METRIC | DETAILS |
|---|---|
| Market Size in 2024 (Value) | USD 0.022 Billion |
| Market Forecast in 2030 (value) | USD 0.406 Billion |
| Growth Rate | CAGR of 67.9% (2025–2030) |
| Years Considered | 2022-2030 |
| Base Year | 2024 |
| Forecast Period | 2025-2030 |
| Units Considered | Value (USD Million/Billion), Volume (Tons) |
| Report Coverage | Revenue forecast, company ranking, competitive landscape, growth factors, and trends. |
| Segments Covered |
|
| Regions Covered | North America, Asia Pacific, Europe, South America, Middle East & Africa |
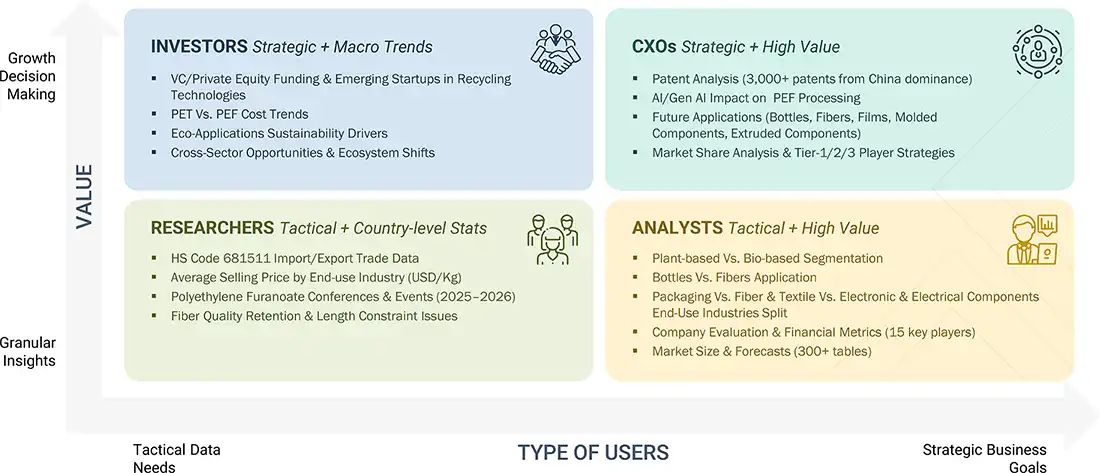
WHAT IS IN IT FOR YOU: Polyethylene Furanoate Market REPORT CONTENT GUIDE
DELIVERED CUSTOMIZATIONS
We have successfully delivered the following deep-dive customizations:
| CLIENT REQUEST | CUSTOMIZATION DELIVERED | VALUE ADDS |
|---|---|---|
| APAC-based Polyethylene Furanoate Manufacturers |
|
|
| Standard Grade PEF Manufacturer |
|
|
| FDCA Supplier |
|
|
| Automotive Components Polyethylene Furanoate Customer |
|
|
RECENT DEVELOPMENTS
- February 2025 : Avantium partnered with Amcor in a joint development agreement to explore the use of its 100% plant-based, recyclable polymer PEF in rigid packaging.
- August 2023 : Origin Materials formed a strategic partnership with Terphane, a global leader in specialty PET polyester films.
- August 2022 : Sulzer signed a MOU with BASF SE to advance technologies for renewable fuels and chemically recycled plastics that will further expand the partners’ portfolio of sustainable solutions.
- May 2021 : AVA Biochem announced a partnership with Sulzer to expand its technology portfolio for the production of renewable, bio-based, and recyclable materials.
- February 2021 : Avantium’s subsidiary, Avantium Renewable Polymers, signed a patent license agreement with Eastman Chemical Company for the right to operate under Eastman’s FDCA-related patent portfolio.
Table of Contents
 Exclusive indicates content/data unique to MarketsandMarkets and not available with any competitors.
Methodology
The study involved four major activities in estimating the market size of the polyethylene furanoate market. Exhaustive secondary research was done to collect information on the market, the peer market, and the parent market. The next step was to validate these findings, assumptions, and sizing with industry experts across the value chain through primary research. Both top-down and bottom-up approaches were employed to estimate the complete market size. Thereafter, the market breakdown and data triangulation procedures were used to estimate the market size of the segments and subsegments.
Secondary Research
In the secondary research process, various secondary sources were referred to for identifying and collecting information for this study. These secondary sources included annual reports, press releases, investor presentations of companies, white papers, certified publications, trade directories, articles from recognized authors, gold standard and silver standard websites, and databases. Secondary research has been used to obtain key information about the value chain of the industry, monetary chain of the market, the total pool of key players, market classification and segmentation according to industry trends to the bottom-most level, and regional markets. It was also used to obtain information about the key developments from a market-oriented perspective.
Primary Research
The polyethylene furanoate market comprises several stakeholders in the value chain, which include manufacturers and end users. Various primary sources from the supply and demand sides of the polyethylene furanoate market have been interviewed to obtain qualitative and quantitative information. The primary interviewees from the demand side included key opinion leaders in industrial sectors. The primary sources from the supply side included manufacturers, associations, and institutions involved in the polyethylene furanoate industry. Primary interviews were conducted to gather insights such as market statistics, revenue data collected from the products and services, market breakdowns, market size estimations, market forecasting, and data triangulation. Primary research also helped in understanding the various trends related to source, grade, application, end-use industry, and region. Stakeholders from the demand side, such as CIOs, CTOs, and CSOs, were interviewed to understand the buyer’s perspective on the suppliers, products, and their current usage of polyethylene furanoate and outlook of their business, which will affect the overall market.
The breakdown of profiles of the primary interviewees is illustrated in the figure below:
 Market Primary Research")
Note: Tier 1, Tier 2, and Tier 3 companies are classified based on their market revenue in 2024, which is available in the public domain, their product portfolios, and their geographical presence.
Other designations include consultants and sales, marketing, and procurement managers.
To know about the assumptions considered for the study, download the pdf brochure
Market Size Estimation
The top-down and bottom-up approaches have been used to estimate and validate the size of the polyethylene furanoate market.
- The key players in the industry have been identified through extensive secondary research.
- The supply chain of the industry has been determined through primary and secondary research.
- All percentage shares, splits, and breakdowns have been determined using secondary sources and verified through primary sources.
- All possible parameters that affect the markets covered in this research study have been accounted for, viewed in extensive detail, verified through primary research, and analyzed to obtain the final quantitative and qualitative data.
- The research includes the study of reports, reviews, and newsletters of the key market players, along with extensive interviews for opinions with leaders such as directors and marketing executives.
 Market Top Down and Bottom Up Approach")
Data Triangulation
After arriving at the total market size from the estimation process, the overall market has been split into several segments and sub-segments. To complete the overall market engineering process and arrive at the exact statistics for all the segments and sub-segments, the data triangulation and market breakdown procedures have been employed, wherever applicable. The data has been triangulated by studying various factors and trends from both the demand and supply sides. Along with this, the market size has been validated by using both the top-down and bottom-up approaches and primary interviews. Hence, for every data segment, there have been three sources: the top-down approach, the bottom-up approach, and interviews with experts. The data was assumed correct when the values arrived from the three sources matched.
Market Definition
Polyethylene furanoate (PEF) is a bio-based polyester sourced from renewable materials, such as plant sugars, and serves as an alternative to petroleum-based plastics like polyethylene terephthalate (PET). PEF has better properties than conventional plastics with improved barrier against oxygen and carbon dioxide, greater strength, better thermal stability, and is recyclable. These properties make PEF useful for packaging applications, including food & beverage, as it improves the shelf life of a product. In general, the market potential for PEF is due to growing awareness of environmental issues, government regulations that promote the use of bio-based materials, and an increased demand for sustainable packaging products worldwide.
Stakeholders
- Senior Management
- End Users
- Finance/Procurement Department
- R&D Department
- Manufacturers
- Raw Material Suppliers
Report Objectives
- To define, describe, and forecast the size of the polyethylene furanoate market, in terms of value and volume
- To provide detailed information regarding the major factors (drivers, opportunities, restraints, and challenges) influencing the growth of the market
- To estimate and forecast the market size based on grade, application, end-use industry, and region
- To forecast the size of the market with respect to major regions, namely, Europe, North America, Asia Pacific, Middle East & Africa, and South America, along with their key countries
- To strategically analyze micro-markets with respect to individual growth trends, prospects, and their contribution to the overall market
- To analyze opportunities in the market for stakeholders and provide a competitive landscape of market leaders
- To track and analyze recent developments such as expansions, product launches, partnerships & agreements, and acquisitions in the market
- To strategically profile key market players and comprehensively analyze their core competencies
Key Questions Addressed by the Report
Which are the major companies in the polyethylene furanoate market? What key strategies have market players adopted to strengthen their market presence?
Key players include Avantium (Netherlands), Sulzer Ltd (Switzerland), AVA Biochem AG (Switzerland), Origin Materials (US), Toyobo Co., Ltd (Japan), Zhejiang Sugar Energy Technology Co., Ltd (China), Swicofil AG (Switzerland), ALPLA (Austria), Danone (France), and Eastman Chemical Company (US). Strategies adopted include product launches, acquisitions, and expansions.
What are the drivers and opportunities for the polyethylene furanoate market?
Drivers include increasing demand for sustainable and eco-friendly packaging solutions, along with supportive government policies and incentives for renewable materials.
Which region is expected to hold the largest market share?
Europe is expected to hold the largest share due to stringent environmental regulations, strong circular economy initiatives, and rising demand for bio-based packaging.
What is the projected growth rate of the polyethylene furanoate market over the next five years?
The market is projected to register a CAGR of 67.9% during the forecast period.
How is the polyethylene furanoate market aligned for future growth?
The market is well-positioned for future growth, supported by advancements in bio-based feedstocks, sustainable packaging trends, favorable legislation, and expanding use in textiles, automotive, and high-performance recyclable plastic alternatives.
Need a Tailored Report?
Customize this report to your needs
Get 10% FREE Customization
Customize This ReportPersonalize This Research
- Triangulate with your Own Data
- Get Data as per your Format and Definition
- Gain a Deeper Dive on a Specific Application, Geography, Customer or Competitor
- Any level of Personalization
Let Us Help You
- What are the Known and Unknown Adjacencies Impacting the Polyethylene Furanoate (PEF) Market
- What will your New Revenue Sources be?
- Who will be your Top Customer; what will make them switch?
- Defend your Market Share or Win Competitors
- Get a Scorecard for Target Partners

Custom Market Research Services
We Will Customise The Research For You, In Case The Report Listed Above Does Not Meet With Your Requirements
Get 10% Free CustomisationTESTIMONIALS

We at Nissan Chemicals Corporation have been clients of MarketsandMarkets for more than a year now. We recently consulted MarketsandMarkets for a study, the team at MarketsandMarkets was extremely professional and organized. The business insights were very detailed and aligned well with our expectations that really helped us formulate the Business Plans and device new strategies for development themes. MarketsandMarkets offers a unique combination of expertise and dedicated engagement model. Their research findings have helped us in designing our Pricing Strategy which will make it easier for us to predict the future sales and profits for the next ten years. We look forward to working with MarketsandMarkets in the future.
VP of Strategy & New Business Development
Leading Specialty Chemical Company
The MarketsandMarkets Engagement Model, composed of both the Knowledge Store and advisory custom research, has greatly helped us in understanding our markets and making strategic decisions. The Knowledge Store is a fast way to allow everyone in our organization to understand more about most any market they are interested in. The ability to then get custom research done and get answers to specific strategic questions and market insight has been spectacular. The Markets and Markets team feel more like colleagues than vendors and their services have helped us change our culture where statements of things like growth opportunities and competitive position are always backed by industry research.

Rich Gibson,
Director, Corporate Strategy
Milliken & Company,
Leading Industrial Manufacturer of specialty chemical, floor covering, performance and protective textile materials, and healthcaremilliken.com
MarketsandMarkets is a trusted resource that helps us to better understand markets that are near-adjacencies-whether its technology, value chain or geography. Their Knowledge Store platform provides a dashboard of markets and their characteristics which is easy to use and saves us time.
Adam Shaw,
Market Development and Strategy Manager
AdvanSix Inc. USA,
An American Leader in Chemicalswww.advansix.com
The Knowledge Store from MarketsandMarkets is a valuable tool which has helped my team acquire greater insight in to the end markets that our business serves. This has enabled us to help our company build stronger strategies throughout our planning process.
TOSHIO KINOSHITA
Senior Chif Consultion Research & Consulting Division
Mitsubishi Chemical Research Corporation,
Leading Manufacturer of Chemical Productswww.mitsubishichem-res.co.jp/en/

We recently engaged with MarketsandMarkets for a study, the team not only clearly understood our business objectives but was also extremely professional in the way they handled the entire project. The study was efficiently conducted in a phase-wise manner, and the engagement model furnished us with high-quality business insights that far exceeded our expectations at each phase. We were especially happy that MarketsandMarkets could provide us with both, an English as well as a Japanese version of the study. A special thanks to the Analyst Team and Client Services Team, whose fluency in Japanese enhanced our comfort level, as we could converse with them in our preferred language.
Independent entrepreneurs
Arrow Precision
We approached MarketsandMarkets for study on Proppants Market, and their work exceeded our expectations. The study conducted was comprehensive and enabled us to view the market through the various dimensions. In addition, the team was extraordinarily responsive throughout the process and resolved our queries on time. I strongly recommend MarketsandMarkets and will certainly consider them for additional market assessments we will need in the future.
Global engineering company, Japan
Deputy Manager,
Strategic Planning OfficeThe high-quality insights shared by the MarketsandMarkets team helped us understand the pharmaceutical plant designers in a specific geography. It also captured the risks that we may likely face in communicating with our potential partners. The study would enable us identify partners, which would impact our future growth.


Growth opportunities and latent adjacency in Polyethylene Furanoate (PEF) Market