
Polypropylene Compounds Market

Polypropylene Compounds Market by Product Type (Mineral-filled Polypropylene Compounds, Glass Fiber Reinforced, Polypropylene-based TPO, Polypropylene-based TPV, Additive Concentrates), Polymer Type (Homopolymer, Impact Copolymer, Random Copolymer), End-use Industry (Automotive & Transportation, Construction, Electrical & Electronics, Packaging, Medical, Textile, Others), Processing Method (Injection Molding, Blow Molding), and Region - Global Forecast to 2030


POLYPROPYLENE COMPOUNDS MARKET OVERVIEW
Source: Secondary Research, Interviews with Experts, MarketsandMarkets Analysis
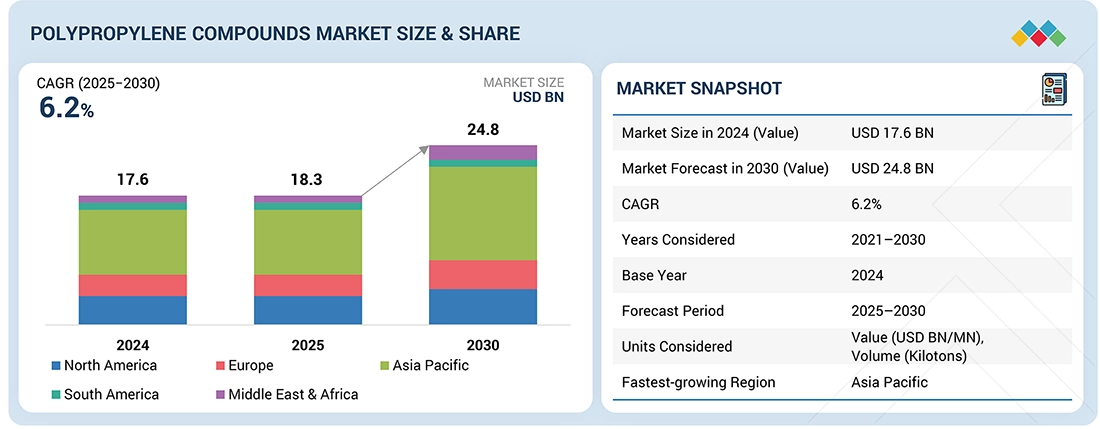
The global polypropylene compounds market is projected to grow from USD 17.6 billion in 2024 to USD 24.8 billion by 2030, at a CAGR of 6.2% during the forecast period. The PP compounds market is mainly driven by the growing demand from the primary end-use industries such as automotive, packaging, construction, and electronics. The automotive market has recently seen a significant shift toward lightweighting in vehicles to support electric vehicle advancements and improve fuel efficiency, which supports the growth of PP compounds.
KEY TAKEAWAYS
-
BY PRODUCT TYPEThe polypropylene compounds market is categorized into mineral-filled PP compounds, glass fiber reinforced grades, PP-based TPO, PP-based TPV, and additive concentrates. Among these, mineral-filled PP compounds account for the largest market share. These compounds, blended with minerals such as talc, calcium carbonate, and mica, significantly enhance stiffness, dimensional stability, and heat resistance compared to base PP.
-
BY POLYMER TYPEThe polypropylene compounds market is divided into homopolymer, impact copolymer, and random copolymer. In 2024, homopolymer held the largest market share by value. Homopolymer polypropylene (PP) compounds, produced from a single type of propylene monomer, are characterized by high tensile strength, rigidity, and cost efficiency. Their superior stiffness and structural integrity make them highly suitable for applications requiring durability and strength.
-
By PROCESSING METHODThe polypropylene compounds market is categorized into injection molding and blow molding. Injection molding holds the largest market share in PP compounds because it enables mass production of complex, lightweight, and cost-effective components with excellent dimensional accuracy. Its versatility makes it widely used across automotive, packaging, consumer goods, and electronics, where high-volume manufacturing is essential.
-
BY END-USE INDUSTRYThe polypropylene compounds market is segmented into automotive & transportation, construction, electrical & electronics, packaging, medical, textile, and other industries. Automotive & transportation dominated the market by value. This sector leads due to its emphasis on lightweighting, fuel efficiency, and cost optimization. PP compounds offer an excellent strength-to-weight ratio, low density, and strong resistance to heat and chemicals, making them highly suitable for vehicle components.
-
BY REGIONThe polypropylene compounds market covers Europe, North America, Asia Pacific, South America, the Middle East, and Africa. Asia Pacific is expected to dominate and grow fastest in the polypropylene compounds market, driven by the presence of large automotive hubs in China, India, Japan, and South Korea, alongside a robust packaging and consumer goods sector.
-
COMPETITIVE LANDSCAPEMajor market players have adopted both organic and inorganic strategies, including partnerships and product launches. For instance, LOTTE Chemical has introduced a groundbreaking translucent polypropylene (PP) compound designed to revolutionize automotive design.
The polypropylene compounds market is primarily influenced by a rising demand for PP compounds across key end-use sectors such as automotive, packaging, construction, and electronics. In electronics, flame-retardant and impact-resistant PP grades are widely used in housings and components. Additionally, growing emphasis on sustainability and bio-based materials, along with regulatory support and corporate environmental goals, is creating further opportunities for market expansion. New deals and developments, including strategic partnerships, investments in bio-based technologies, and innovations in more sustainable compounds, are reshaping the industry landscape.
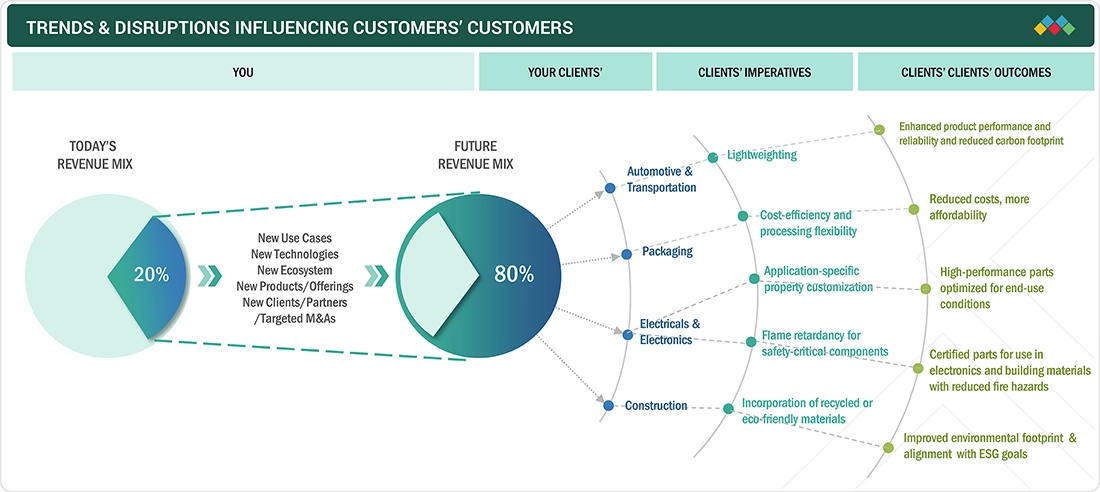
TRENDS & DISRUPTIONS IMPACTING CUSTOMERS' CUSTOMERS
The impact on consumers’ business emerges from evolving trends and disruptions across the automotive, construction, and electronics industries. Key hotbeds are OEMs and component manufacturers that rely on PP compounds for lightweighting, durability, and cost efficiency. Shifts in end-user demand, such as the adoption of electric vehicles, sustainable packaging, or energy-efficient construction, directly influence the revenue streams of these industries. These demand fluctuations cascade back to PP compound suppliers, where market dynamics in sustainability, regulations, and raw material availability further amplify the effect on revenues.
Source: Secondary Research, Interviews with Experts, MarketsandMarkets Analysis
MARKET DYNAMICS
Level
-
Growing adoption of lightweight materials in automotive applications

-
Low cost and versatility make polypropylene PP compounds a preferred material across industries

Level
-
Strict environmental regulations and raw material price volatility

Level
-
Growing focus on sustainable and recyclable PP compounds due to their environmental benefits

-
Surging demand for PP compounds in developing nations presents a significant expansion opportunity

Level
-
High reliance on petroleum feedstocks and complex recycling needs pose key sustainability and waste management challenges

Source: Secondary Research, Interviews with Experts, MarketsandMarkets Analysis
Driver: Growing adoption of lightweight materials in automotive applications
One of the key drivers propelling the polypropylene (PP) compounds market is the growing adoption of lightweight materials in automotive applications. Automakers across the globe are under increasing pressure to meet stringent emission norms, improve fuel efficiency, and align with circular economy goals. As a result, there is a clear industry-wide shift toward lightweight yet high-performance materials such as PP compounds, which offer a compelling balance of mechanical strength, design flexibility, and reduced weight.
Restraint: Strict environmental regulations and raw material price volatility
A significant restraint impacting the growth of the polypropylene (PP) compounds market is the combination of strict environmental regulations and raw material price volatility. These two factors pose major restraints for manufacturers in terms of cost management, compliance, and long-term planning. Strict environmental regulations, especially in regions like the European Union, North America, and parts of Asia, are increasingly targeting single-use plastics, carbon emissions, and non-recyclable materials.
Opportunity: Growing focus on sustainable and recyclable PP compounds due to their environmental benefits
One of the most promising opportunities in the polypropylene (PP) compounds market is the growing focus on sustainable and recyclable PP compounds, driven by rising environmental awareness, stricter regulations, and the global push toward a circular economy. As industries and consumers alike become more conscious of plastic pollution and carbon emissions, there is increasing demand for materials that not only perform well but also align with sustainability goals. Recyclable and sustainable PP compounds are gaining traction across sectors such as automotive, packaging, electronics, and consumer goods.
Challenge: High reliance on petroleum feedstocks and complex recycling needs pose key sustainability and waste management challenges
A major challenge facing the polypropylene (PP) compounds market is its heavy dependence on petroleum-based feedstocks, which poses serious sustainability and environmental concerns. As global awareness about climate change and resource conservation intensifies, industries reliant on non-renewable resources are under increasing pressure to adopt greener practices. In addition to production-related concerns, end-of-life disposal and recycling of PP compounds present further complications. PP compounds are not pure polymers; they often include a mix of additives, fillers, stabilizers, and reinforcing materials, which complicate the recycling process.
Polypropylene Compounds Market: COMMERCIAL USE CASES ACROSS INDUSTRIES
| COMPANY | USE CASE DESCRIPTION | BENEFITS |
|---|---|---|
 |
PP compounds used in dashboards, trims, and bumpers | Lightweighting improves energy efficiency and EV range |
 |
PP compounds used in interior panels and under-the-hood parts | Enhances durability while reducing manufacturing costs |
 |
PP compounds used in device casings and electronic housings | Provides insulation, heat resistance, and design flexibility |
 |
PP compounds integrated in rigid containers and flexible packaging | Offers extended product shelf life |
 |
Used in e-scooter body panels and battery housings | PP compounds improve durability, reduce weight, and support cost efficiency |
Logos and trademarks shown above are the property of their respective owners. Their use here is for informational and illustrative purposes only.
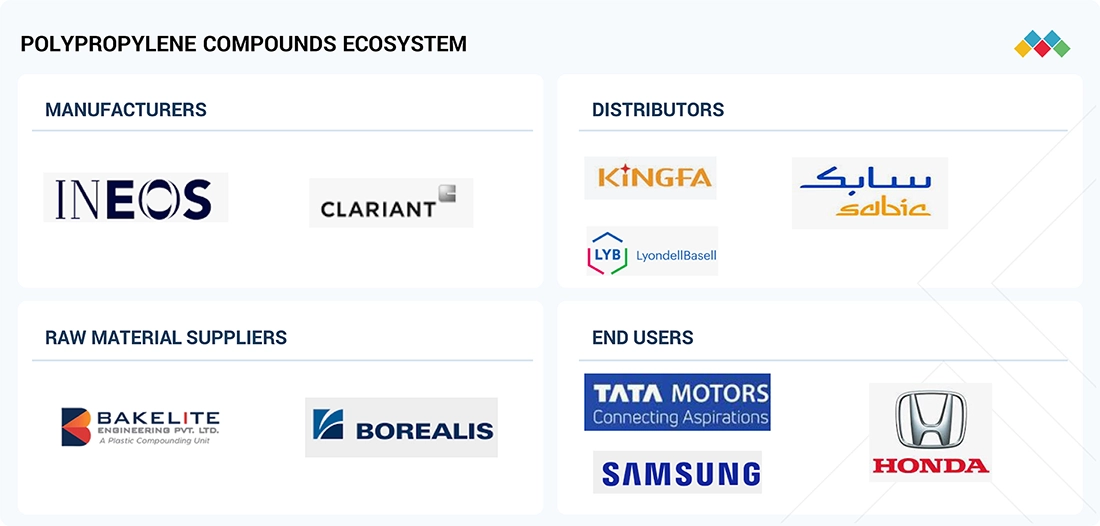
MARKET ECOSYSTEM
The PP compounds market ecosystem comprises raw material suppliers (INEOS, SABIC), compound manufacturers (LyondellBasell Industries Holding B.V., TotalEnergies), distributors (TotalEnergies, SABIC), and end users (Tata Motors, Hyundai). PP resin, a key raw material, is supplied and then processed by manufacturers who add additives to create compounds. These compounds are transformed into lightweight, high-performance materials for various industries. End users fuel demand for fuel efficiency and sustainability, while manufacturers provide tailored PP compounds. Collaboration across the value chain is essential for innovation and market growth.
Logos and trademarks shown above are the property of their respective owners. Their use here is for informational and illustrative purposes only.
MARKET SEGMENTS
Source: Secondary Research, Interviews with Experts, MarketsandMarkets Analysis
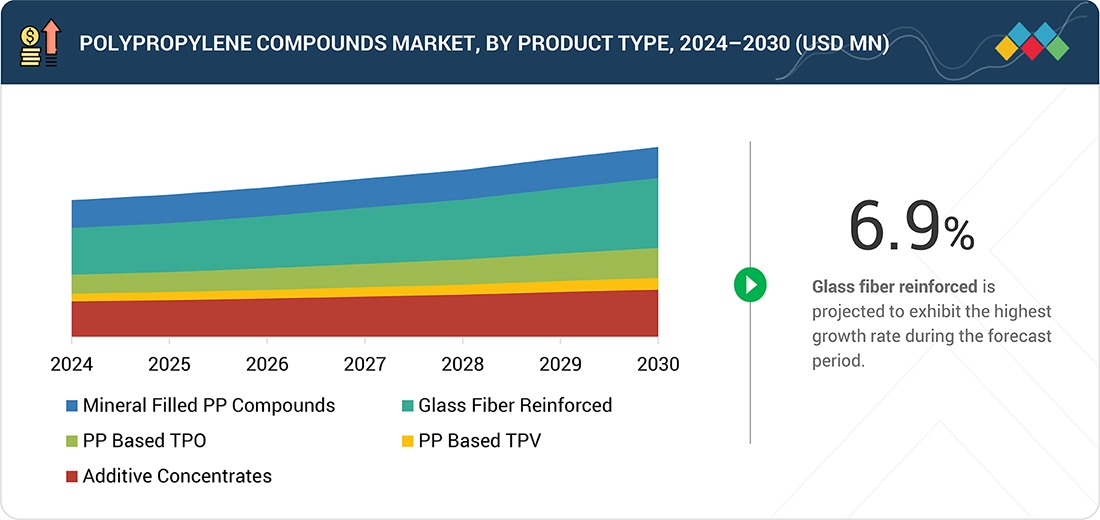
Polypropylene Compounds Market, By Product Type
As of 2024, mineral-filled PP compounds held the largest share of the market and will continue leading the market through 2025 due to their broad connection, cost-effectiveness, and enhanced mechanical properties. By incorporating minerals such as talc, calcium carbonate, or mica, these composites exhibit better stiffness, dimensional stability, and thermal resistance, making them largely suitable for demanding operations.
Polypropylene Compounds Market, By Polymer Type
In 2024, homopolymers held the number one position in the market of PP compounds because of their better mechanical properties and industrial applicability. One source of monomer-basing, propylene, gives homopolymers of PP really high tensile strength, stiffness, and excellent chemical resistance. Injection molding and extrusion are processes that many other industries use to manufacture various underground automotive parts, household items, industrial containers, and textiles.
Polypropylene Compounds Market, By End-use Industry
Automotive & transportation held the largest market share, in terms of value, in the global market in 2024. The automotive & transportation industry accounts for the largest market share of polypropylene (PP) compounds due to its focus on lightweighting, fuel efficiency, and cost. PP compounds provide an ideal mechanical strength-to-weight ratio while providing low-density resistance to both heat and chemicals, which makes them suitable in vehicle production for a wide variety of components that include bumpers, dashboards, door panels, battery housings, and under-the-hood components.
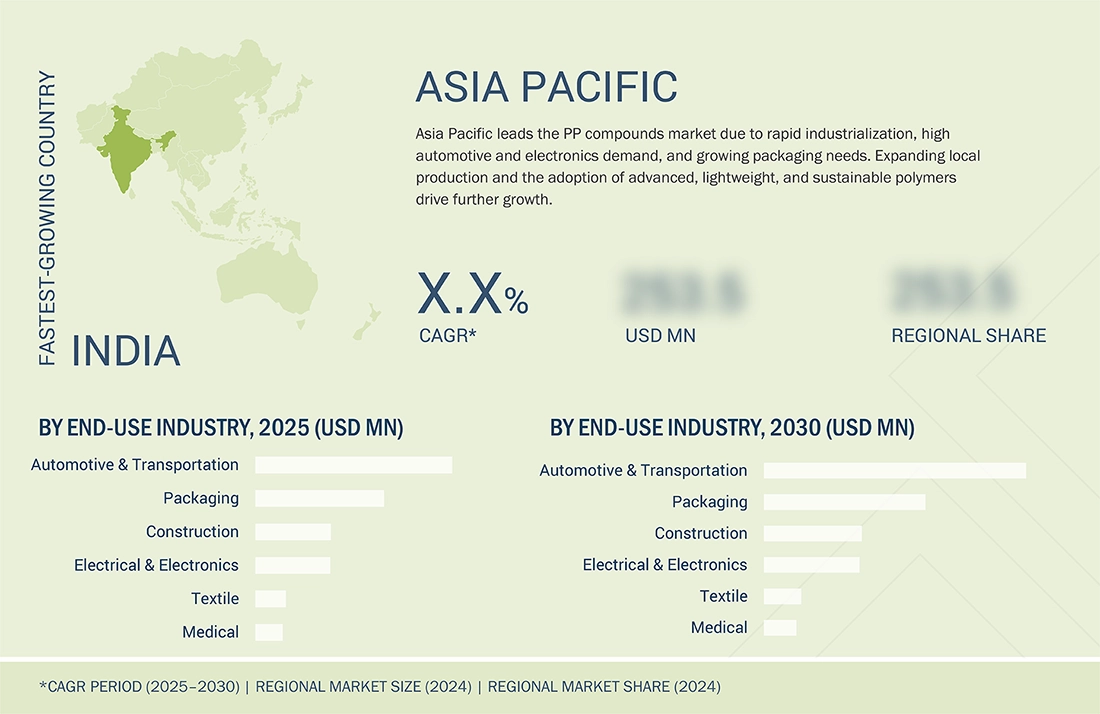
REGION
Asia Pacific to be the fastest-growing region in the global polypropylene compounds market during the forecast period
The Asia Pacific polypropylene compounds market is expected to register the highest CAGR during the forecast period, driven by various factors. The region hosts major automotive, packaging, and electrical & electronics manufacturing hubs, driving high demand for versatile and lightweight polymer solutions. Rapid industrialization, urbanization, and rising disposable incomes in countries like China, India, and Southeast Asia are boosting consumption across end-use industries. The automotive sector, in particular, is adopting PP compounds for lightweight components to enhance fuel efficiency and meet emission regulations.
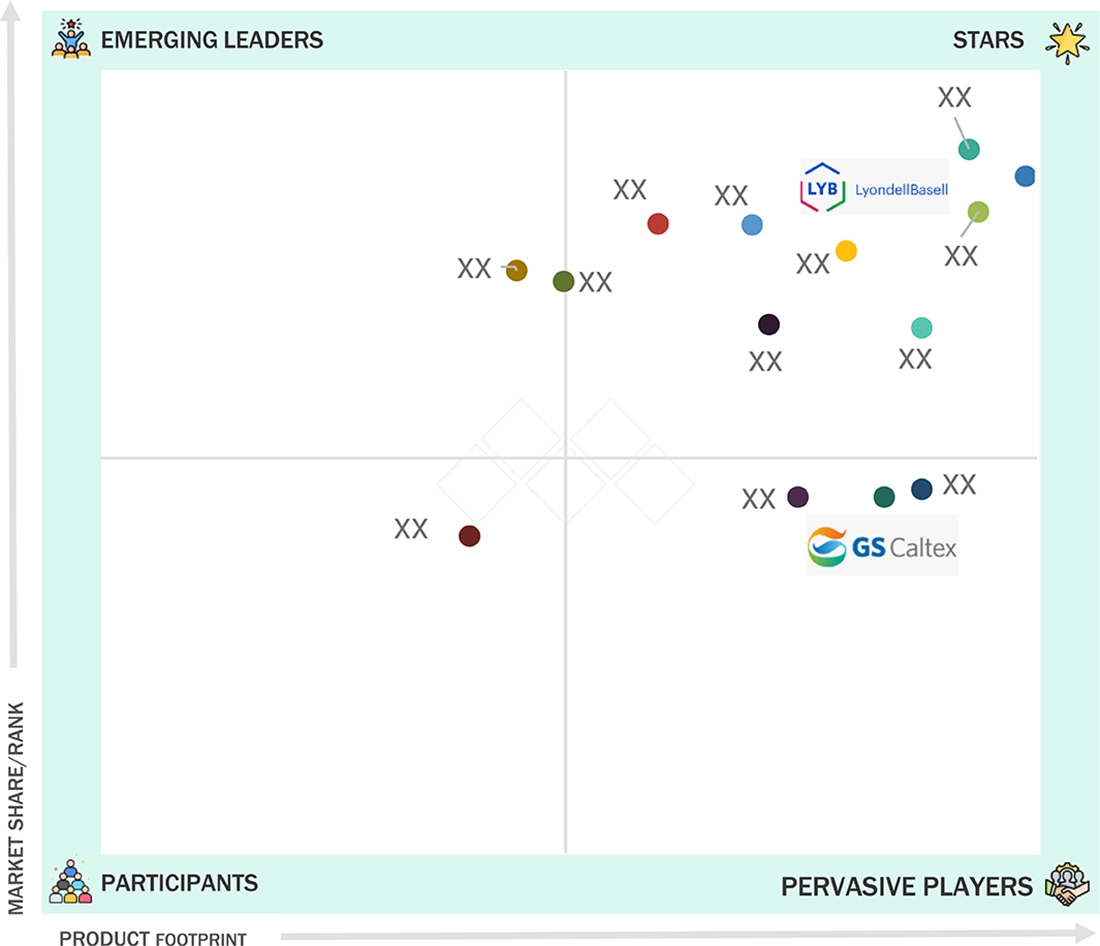
Polypropylene Compounds Market: COMPANY EVALUATION MATRIX
In the polypropylene compounds market matrix, LyondellBasell Industries Holdings B.V. (Star) leads with a strong market share and extensive product footprint, driven by its huge production capacities and global footprint. GS Caltex Corporation (Pervasive Player) has a comparatively smaller PP compounding capacity and a more regionally concentrated presence, limiting its scale compared to other global leaders. However, it can grow by expanding capacity and forming strategic partnerships to enhance its global footprint in PP compounds.
Source: Secondary Research, Interviews with Experts, MarketsandMarkets Analysis
KEY MARKET PLAYERS
MARKET SCOPE
| REPORT METRIC | DETAILS |
|---|---|
| Market Size in 2024 (Value) | USD 17.6 BN |
| Market Forecast in 2030 (Value) | USD 24.8 BN |
| Growth Rate | CAGR of 6.2% from 2025 to 2030 |
| Years Considered | 2021–2030 |
| Base Year | 2024 |
| Forecast Period | 2025–2030 |
| Units Considered | Value (USD MN/BN), Volume (Kiloton) |
| Report Coverage | Revenue forecast, company ranking, competitive landscape, growth factors, and trends |
| Segments Covered |
|
| Regions Covered | North America, Asia Pacific, Europe, South America, Middle East & Africa |
WHAT IS IN IT FOR YOU: Polypropylene Compounds Market REPORT CONTENT GUIDE
DELIVERED CUSTOMIZATIONS
We have successfully delivered the following deep-dive customizations:
| CLIENT REQUEST | CUSTOMIZATION DELIVERED | VALUE ADDS |
|---|---|---|
| US-based PP Compounds Manufacturer |
|
|
| Polypropylene Compounds Supplier |
|
|
RECENT DEVELOPMENTS
- March 2025 : Rialti, part of the Borealis Group, has introduced new polypropylene (PP) compound grades that incorporate a blend of post-consumer recycled (PCR) and post-industrial recycled (PIR) content. These grades are specifically designed for structural applications across industries such as mobility, appliances, construction, and home & gardening, offering a more sustainable and cost-efficient alternative to virgin PP materials.
- April 2024 : Washington Penn Plastic has commenced construction on its new USD 104 million manufacturing facility in Winchester. Spanning nearly 250,000 square feet and situated on a 70-acre site, the plant will support the production of polypropylene and polyethylene compounds in pellet form, which will be distributed to customers globally.
- March 2024 : LOTTE Chemical has introduced a groundbreaking translucent polypropylene (PP) compound designed to revolutionize automotive design. This advanced material offers high light transmittance and low haze, performance levels previously unattainable with conventional PP compounds. The innovation is poised to enable smart, integrated design solutions for the evolving automotive industry, particularly in the context of electric vehicles (EVs) and autonomous driving, where aesthetic integration and functional lighting components are increasingly essential.
Table of Contents
 Exclusive indicates content/data unique to MarketsandMarkets and not available with any competitors.
Methodology
The study involved four major activities in estimating the market size of the polypropylene compounds market. Exhaustive secondary research was done to collect information on the market, the peer market, and the parent market. The next step was to validate these findings, assumptions, and sizing with industry experts across the value chain through primary research. Both top-down and bottom-up approaches were employed to estimate the complete market size. Thereafter, the market breakdown and data triangulation procedures were used to estimate the market size of the segments and subsegments.
Secondary Research
In the secondary research process, various secondary sources have been referred to for identifying and collecting information for this study. These secondary sources include annual reports, press releases, investor presentations of companies, white papers, certified publications, trade directories, certified publications, articles from recognized authors, gold standard and silver standard websites, and databases.
Secondary research has been used to obtain key information about the value chain of the industry, monetary chain of the market, the total pool of key polypropylene compounds, market classification and segmentation according to industry trends to the bottom-most level, and regional markets. It was also used to obtain information about the key developments from a market-oriented perspective.
Primary Research
The polypropylene compounds market comprises several stakeholders in the value chain, which include raw material suppliers, manufacturers, distributors, suppliers, and end users. Various primary sources from the supply and demand sides of the polypropylene compounds market have been interviewed to obtain qualitative and quantitative information. The primary interviewees from the demand side include key opinion leaders in end-use sectors. The primary sources from the supply side include manufacturers, associations, manufacturers, and institutions involved in the Polypropylene compounds industry.
Interviews were conducted with industry experts to gather insights, such as market statistics, data of revenue collected from the products and services, market breakdowns, market size estimations, market forecasting, and data triangulation. Primary research also helped in understanding the various trends related to chemistry, form, end-use industry, product, and region. Stakeholders from the demand side, such as CIOs, CTOs, and CSOs were interviewed to understand the buyer’s perspective on the suppliers, products, component providers, and their current usage of polypropylene compounds and future outlook of their business which will affect the overall market.
The breakdown of profiles of the interviews with experts is illustrated in the figure below:

Note: Tier 1, Tier 2, and Tier 3 companies are classified based on their market revenue in 2024 available in the public domain, product portfolios, and geographical presence.
Other designations include sales representatives, production heads, and technicians.
To know about the assumptions considered for the study, download the pdf brochure
Market Size Estimation
The top-down approach was used to estimate and validate the size of various submarkets for polypropylene compounds for each region. The research methodology used to estimate the market size included the following steps:
- The key players in the industry have been identified through extensive secondary research.
- The supply chain of the industry has been determined through primary and secondary research.
- The global market was then segmented into five major regions and validated by industry experts.
- All percentage shares, splits, and breakdowns based on product type, polymer type, processing method, end-use industry, and regions were determined using secondary sources and verified through primary sources.
- All possible parameters that affect the markets covered in this research study were accounted for, viewed in extensive detail, verified through primary research, and analyzed to get the final quantitative and qualitative data. This data was consolidated and added with detailed inputs and analysis and presented in this report.

Data Triangulation
After arriving at the total market size from the estimation process polypropylene compounds above, the overall market has been split into several segments and subsegments. To complete the overall market engineering process and arrive at the exact statistics for all the segments and subsegments, the data triangulation and market breakdown procedures have been employed, wherever applicable. The data has been triangulated by studying various factors and trends from both the demand and supply sides. Along with this, the market size has been validated by using both the top-down and bottom-up approaches and interviews with experts. Hence, for every data segment, there have been three sources—top-down approach, bottom-up approach, and interviews with experts. The data was assumed correct when the values arrived from the three sources matched.
Market Definition
Polypropylene (PP) compounds are thermoplastic materials made by mixing base polypropylene resins with different fillers, reinforcements, impact modifiers, colorants, and additives. This blending aims to achieve specific mechanical, thermal, or chemical properties. These compounds improve performance attributes like strength, stiffness, heat resistance, impact resistance, and flame retardancy, based on the intended use. Polypropylene compounds are commonly used in various industries, such as automotive & transportation, electrical & electronics, construction, packaging, textiles, and consumer goods. The polypropylene compounds market includes a variety of types, polypropylene filled with minerals, glass fiber-reinforced polypropylene, polypropylene-based thermoplastic olefins, polypropylene -based thermoplastic vulcanizates, and additive concentrates. The demand for lightweight automotive components, environmental objectives, expanding infrastructure, and growing consumer and industrial applications are the main factors propelling the market. Polypropylene compounds are becoming increasingly relevant worldwide as companies search for high-performance plastic solutions.
Stakeholders
- Polypropylene Compound Manufacturers
- Raw Material Suppliers
- End-use Industries
- Polypropylene Compound Traders, Distributors, and Suppliers
- Research Organizations
- Industry Associations
- Government Research Organizations
Report Objectives
- To define, describe, and forecast the size of the polypropylene compounds market, in terms of value and volume
- To provide detailed information regarding the major factors (drivers, opportunities, restraints, and challenges) influencing the growth of the market
- To estimate and forecast the market size based on product type, polymer type, processing method, end-use industry, and region
- To forecast the size of the market with respect to major regions, namely, Europe, North America, Asia Pacific, Middle East & Africa, and South America, along with their key countries
- To strategically analyze micromarkets with respect to individual growth trends, prospects, and their contribution to the overall market
- To analyze opportunities in the market for stakeholders and provide a competitive landscape of market leaders
- To track and analyze recent developments, such as product launches, partnerships, acquisitions, and expansions in the market
- To strategically profile key market players and comprehensively analyze their core competencies
Key Questions Addressed by the Report
What are the factors influencing the growth of the polypropylene compounds market?
Growth is driven by increased adoption of lightweight materials in automotive applications, and rising demand from packaging and electronics industries.
Define the polypropylene compounds market.
The market involves the production and supply of modified polypropylene materials blended with additives or fillers to enhance their properties for various end-use applications.
Which region is expected to account for the largest market share in the polypropylene compounds market?
Asia Pacific is expected to hold the largest share during the forecast period, owing to its robust manufacturing base and growing industrial demand.
Which are the major market players covered in the report?
Key players include LyondellBasell Industries (US), Kingfa Sci.&Tech. (China), LG Chem (South Korea), Mitsui Chemicals (Japan), Washington Penn (US), Mitsubishi Chemical Group (Japan), SABIC (Saudi Arabia), and others.
How large is the global polypropylene compounds market?
The market is projected to grow from USD 17.6 billion in 2024 to USD 24.8 billion by 2030, at a CAGR of 6.2% during the forecast period.
Need a Tailored Report?
Customize this report to your needs
Get 10% FREE Customization
Customize This ReportPersonalize This Research
- Triangulate with your Own Data
- Get Data as per your Format and Definition
- Gain a Deeper Dive on a Specific Application, Geography, Customer or Competitor
- Any level of Personalization
Let Us Help You
- What are the Known and Unknown Adjacencies Impacting the Polypropylene Compounds Market
- What will your New Revenue Sources be?
- Who will be your Top Customer; what will make them switch?
- Defend your Market Share or Win Competitors
- Get a Scorecard for Target Partners

Custom Market Research Services
We Will Customise The Research For You, In Case The Report Listed Above Does Not Meet With Your Requirements
Get 10% Free CustomisationTESTIMONIALS

We at Nissan Chemicals Corporation have been clients of MarketsandMarkets for more than a year now. We recently consulted MarketsandMarkets for a study, the team at MarketsandMarkets was extremely professional and organized. The business insights were very detailed and aligned well with our expectations that really helped us formulate the Business Plans and device new strategies for development themes. MarketsandMarkets offers a unique combination of expertise and dedicated engagement model. Their research findings have helped us in designing our Pricing Strategy which will make it easier for us to predict the future sales and profits for the next ten years. We look forward to working with MarketsandMarkets in the future.
VP of Strategy & New Business Development
Leading Specialty Chemical Company
The MarketsandMarkets Engagement Model, composed of both the Knowledge Store and advisory custom research, has greatly helped us in understanding our markets and making strategic decisions. The Knowledge Store is a fast way to allow everyone in our organization to understand more about most any market they are interested in. The ability to then get custom research done and get answers to specific strategic questions and market insight has been spectacular. The Markets and Markets team feel more like colleagues than vendors and their services have helped us change our culture where statements of things like growth opportunities and competitive position are always backed by industry research.

Rich Gibson,
Director, Corporate Strategy
Milliken & Company,
Leading Industrial Manufacturer of specialty chemical, floor covering, performance and protective textile materials, and healthcaremilliken.com
MarketsandMarkets is a trusted resource that helps us to better understand markets that are near-adjacencies-whether its technology, value chain or geography. Their Knowledge Store platform provides a dashboard of markets and their characteristics which is easy to use and saves us time.
Adam Shaw,
Market Development and Strategy Manager
AdvanSix Inc. USA,
An American Leader in Chemicalswww.advansix.com
The Knowledge Store from MarketsandMarkets is a valuable tool which has helped my team acquire greater insight in to the end markets that our business serves. This has enabled us to help our company build stronger strategies throughout our planning process.
TOSHIO KINOSHITA
Senior Chif Consultion Research & Consulting Division
Mitsubishi Chemical Research Corporation,
Leading Manufacturer of Chemical Productswww.mitsubishichem-res.co.jp/en/

We recently engaged with MarketsandMarkets for a study, the team not only clearly understood our business objectives but was also extremely professional in the way they handled the entire project. The study was efficiently conducted in a phase-wise manner, and the engagement model furnished us with high-quality business insights that far exceeded our expectations at each phase. We were especially happy that MarketsandMarkets could provide us with both, an English as well as a Japanese version of the study. A special thanks to the Analyst Team and Client Services Team, whose fluency in Japanese enhanced our comfort level, as we could converse with them in our preferred language.
Independent entrepreneurs
Arrow Precision
We approached MarketsandMarkets for study on Proppants Market, and their work exceeded our expectations. The study conducted was comprehensive and enabled us to view the market through the various dimensions. In addition, the team was extraordinarily responsive throughout the process and resolved our queries on time. I strongly recommend MarketsandMarkets and will certainly consider them for additional market assessments we will need in the future.
Global engineering company, Japan
Deputy Manager,
Strategic Planning OfficeThe high-quality insights shared by the MarketsandMarkets team helped us understand the pharmaceutical plant designers in a specific geography. It also captured the risks that we may likely face in communicating with our potential partners. The study would enable us identify partners, which would impact our future growth.


Growth opportunities and latent adjacency in Polypropylene Compounds Market