
Potassium Fluoride Market

Potassium Fluoride Market by Form (Solid, Liquid), Purity (95�99%, > 99%), Application (Fluorination & Analytical Reagent, Glass Etching, Flux, Metal Surface Treatment, Catalyst, Electrolyte additive, Agrochemical Formulations), End-use Industry (Agrochemical, Chemical, Glass & Metal, Pharmaceutical, and Electronics & Semiconductor)- Global Forecast to 2032
Updated on : November 27, 2025


POTASSIUM FLUORIDE MARKET OVERVIEW
Source: Secondary Research, Interviews with Experts, MarketsandMarkets Analysis
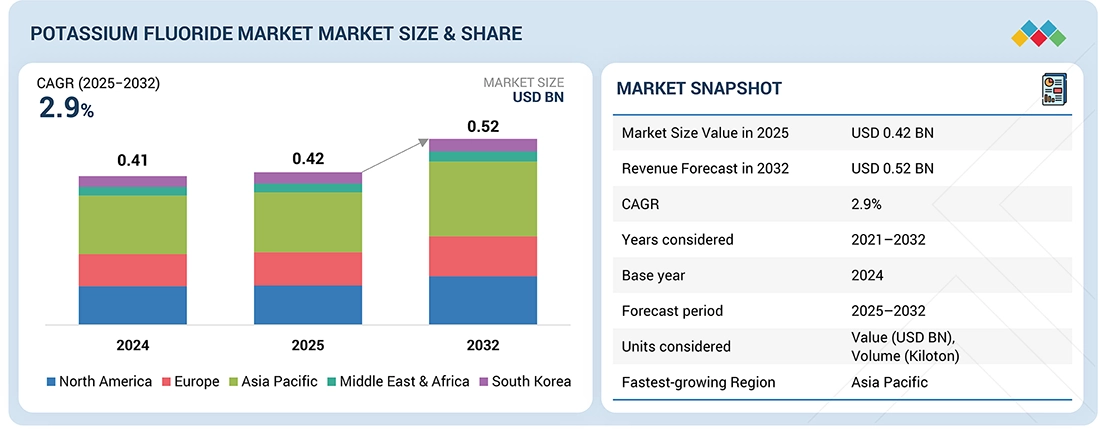
The potassium fluoride market is projected to grow from USD 0.42 billion in 2025 to USD 0.52 billion by 2032, registering a CAGR of 2.9% during the forecast period. Potassium fluoride is an inorganic compound with the chemical formula KF, consisting of potassium and fluorine, and is widely recognized for its role as a versatile fluorinating agent in chemical synthesis. It serves as a crucial input in producing fluorine-based intermediates, catalysts, and specialty compounds, making it a vital material in advanced industrial processes. The market growth for potassium fluoride is being fueled by rising demand in sectors such as pharmaceuticals, agrochemicals, electronics, and glass & metal, where high-purity chemical agents are essential.
KEY TAKEAWAYS
-
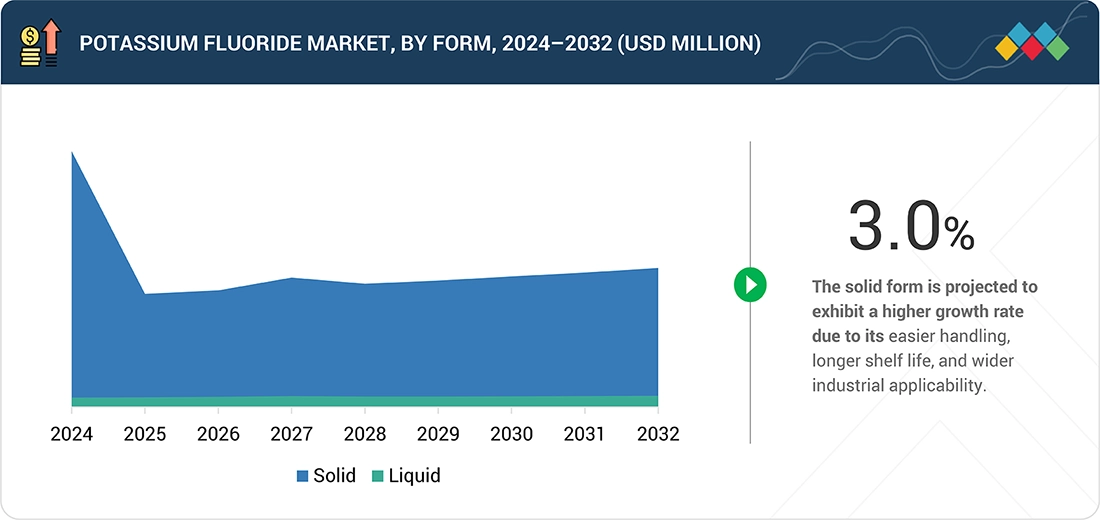
BY FORMThe potassium fluoride market is segmented into solid and liquid forms. Solid potassium fluoride holds the largest share due to its ease of handling, storage, and widespread use in industrial applications, whereas liquid potassium fluoride is employed in specialized processes requiring solution-based reactions.
-
BY PURITYThe market is classified by purity levels into 95–99% and greater than 99%. The 95–99% purity grade dominates the market, striking a balance between cost efficiency and effectiveness in standard industrial and chemical applications. Ultra-high-purity (>99%) potassium fluoride is used in sensitive analytical or specialty processes.
-
BY APPLICATIONFluorination and analytical reagents and agrochemical formulations constitute the primary applications of potassium fluoride. Other applications include glass etching, flux, metal surface treatment, catalyst, and electrolyte additive. The compound’s strong reactivity and chemical versatility make it essential for multiple processes across industries.
-
BY END-USE INDUSTRYThe chemical sector drives the demand for potassium fluoride, primarily due to its extensive use in the chemical manufacturing and processing industries. It is followed by the agrochemical, glass & metal, pharmaceutical, and electronics & semiconductor industries. Growth in these industries, along with increasing industrial production and rising demand for high-performance materials, contributes to the steady consumption of potassium fluoride across these sectors.
-
COMPETITIVE LANDSCAPEThe potassium fluoride market is shaped by announcements and capacity expansion among global leaders. Key players includeAarti Industries Ltd. (India), Gujarat Fluorochemicals Limited (India), MORITA CHEMICAL INDUSTRIES CO., LTD. (Japan), Navin Fluorine International Limited (India), Honeywell International Inc. (US), NACALAI TESQUE, INC. (Japan), Tanfac Industries Ltd. (India), FUJIFILM Wako Pure Chemical Corporation (Japan), Solvay (Belgium), and DERIVADOS DEL FLUOR (Spain).
The Potassium Fluoride market is expected to witness steady growth over the coming years, driven by increasing demand across key end-use industries such as pharmaceuticals, agrochemicals, and electronics & semiconductors. Potassium fluoride is valued for its high purity and effectiveness as a fluorinating agent, making it essential in organic synthesis, specialty chemical production, and semiconductor manufacturing. Expansion of chemical and pharmaceutical production globally, coupled with rising applications in agrochemical formulations, further supports market growth.
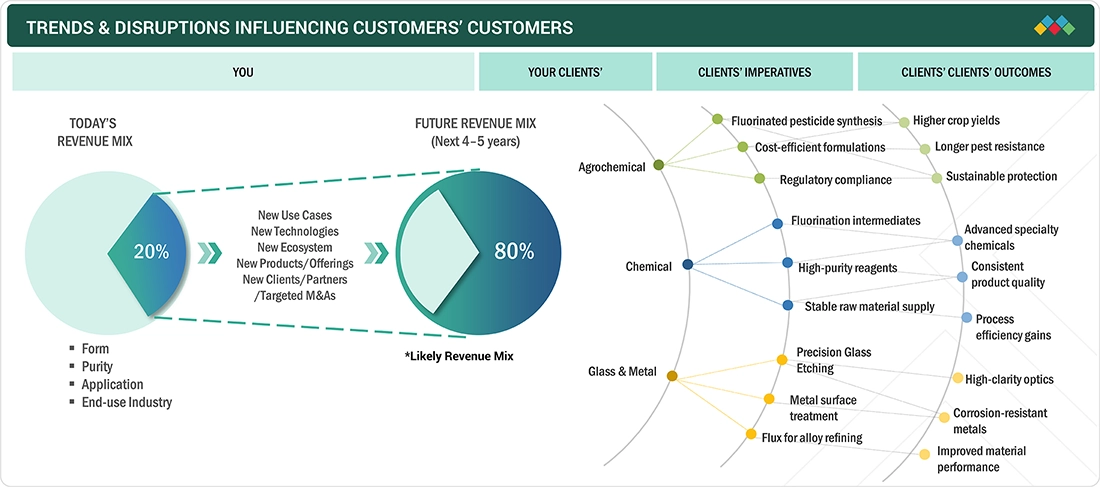
TRENDS & DISRUPTIONS IMPACTING CUSTOMERS' CUSTOMERS
The potassium fluoride market is witnessing key disruptions driven by technological, regulatory, and demand-side shifts. In the agrochemical sector, the rising demand for efficient fluorinated pesticides and stricter environmental standards is prompting companies to adopt high-quality KF to enhance yields and sustainability. In the chemical industry, the trend toward advanced fluorination intermediates, high-purity reagents, and stable raw material supply is reshaping production efficiency and specialty chemical development. Meanwhile, the glass & metal industry is experiencing disruption through growing use of KF in precision glass etching, corrosion-resistant coatings, and alloy refining, responding to rising demand from electronics, optics, and industrial applications. These factors underscore how KF serves as a crucial enabler of performance, compliance, and innovation across various industries.
Source: Secondary Research, Interviews with Experts, MarketsandMarkets Analysis
POTASSIUM FLUORIDE MARKET DYNAMICS
Level
-
Increased agrochemical industry activities drive higher industrial use of potassium fluoride

-
Enhanced fluorination capabilities and versatile industrial applications boost demand

Level
-
Strict regulations on handling, transporting, and disposing fluoride compounds increase operational and compliance costs

-
Availability of substitute fluoride compounds limiting adoption

Level
-
Expanding semiconductor fabrication worldwide widens opportunities for high-purity potassium fluoride

-
Implementing vertical integration to strengthen supply and boost profitability

Level
-
§Integration of capture systems with utilization and mineralization technologies

-
Limited production facilities outside Asia-Pacific increase dependency on imports for global markets

Source: Secondary Research, Interviews with Experts, MarketsandMarkets Analysis
Driver: Increased agrochemical industry activities drive higher industrial use of potassium fluoride
The growth of the agrochemical industry is a key driver for the increasing demand for potassium fluoride. As the global population rises and agricultural productivity becomes more critical, the use of advanced agrochemicals, including pesticides, herbicides, and fertilizers, has expanded significantly. Potassium fluoride plays an essential role in the production of several fluorinated agrochemical compounds due to its efficiency as a fluorinating agent. These compounds often exhibit enhanced stability, effectiveness, and controlled release properties, which are critical for modern farming practices aimed at maximizing crop yield. Moreover, regulatory standards in agriculture are pushing manufacturers to adopt more efficient and precise chemical formulations, further boosting the need for high-purity potassium fluoride. The expansion of large-scale farming operations, particularly in regions such as Asia-Pacific and North America, is also contributing to higher consumption, as agrochemical manufacturers require consistent and reliable sources of raw materials.
Restraint: Strict regulations on handling, transporting, and disposing fluoride compounds increase operational and compliance costs
Strict regulations on the handling, transportation, and disposal of fluoride compounds are a significant factor restraining the growth of the potassium fluoride market. Fluoride compounds, including potassium fluoride, are classified as hazardous due to their corrosive nature and potential environmental and health impacts, which necessitates strict compliance with safety standards and environmental regulations. Companies producing, storing, or transporting potassium fluoride must invest in specialized infrastructure, protective equipment, and rigorous safety protocols, which significantly increase operational costs. Moreover, regulatory frameworks vary across regions, requiring manufacturers and distributors to navigate complex and costly licensing, reporting, and compliance procedures. These factors can deter smaller players from entering the market and limit production scalability for existing companies
Opportunity: Expanding semiconductor fabrication worldwide widens opportunities for high-purity potassium fluoride
The rapid expansion of semiconductor fabrication facilities worldwide presents a significant growth opportunity for the potassium fluoride market. High-purity potassium fluoride is a critical material in semiconductor manufacturing, especially in processes such as etching, cleaning, and fluorination, where precision and chemical stability are essential. As global demand for electronics including smartphones, computers, memory devices, and advanced sensors continue to rise, semiconductor manufacturers are investing heavily in new fabrication plants and upgrading existing facilities to produce smaller, more efficient, and higher-performance chips. These developments require a consistent supply of ultra-high-purity potassium fluoride to meet strict industry standards, creating a stable and growing market for suppliers. Regions such as Asia-Pacific, North America, and Europe are witnessing substantial investments in semiconductor infrastructure, driven by both government initiatives and private sector expansion. The trend toward smaller and more advanced chips also increases the volume and frequency of potassium fluoride use, strengthening market demand.
Challenge: Limited production facilities outside Asia-Pacific increase dependency on imports for global markets Constraints
The limited number of potassium fluoride production facilities outside the Asia-Pacific region poses a significant challenge for the global market. Asia-Pacific dominates the production of potassium fluoride due to its abundant raw material availability, established chemical manufacturing infrastructure, and lower production costs. As a result, markets in North America, Europe, and other regions heavily rely on imports to meet their industrial demand. This dependency on imports creates vulnerability to supply chain disruptions, geopolitical tensions, trade restrictions, and fluctuations in shipping costs, which can lead to delays, increased procurement expenses, and uncertainty for end users. Industries such as pharmaceuticals, agrochemicals, and electronics, which require a consistent and high-quality supply of potassium fluoride, are particularly affected by these uncertainties. Additionally, reliance on imported potassium fluoride limits the flexibility of local manufacturers to respond quickly to sudden demand spikes or changes in production requirements. The high transportation costs associated with long-distance shipping further increase the overall cost of the chemical, making it less competitive for certain applications. Moreover, regulatory differences across regions can complicate import compliance and increase administrative burdens for companies.
Potassium Fluoride Market: COMMERCIAL USE CASES ACROSS INDUSTRIES
| COMPANY | USE CASE DESCRIPTION | BENEFITS |
|---|---|---|
 |
Honeywell supplies HF-derived potassium fluoride and specialty fluoride intermediates at scale, supporting industrial fluorination, agrochemical and specialty-chemical synthesis, as well as fluxes and etchants for glass and metal processing. Its global supply chain ensures large-scale and secure delivery for diversified industries. | The main benefit of Honeywell’s offering lies in its integrated HF-to-KF feedstock reliability, which reduces dependence on third-party suppliers. The company ensures scalable bulk supply to meet the needs of large manufacturers, while maintaining industrial-grade purity levels. |
 |
Navin Fluorine manufactures KF-based intermediates and reagent grades tailored for agrochemical and pharmaceutical industries. It supports both pilot-scale and commercial-scale production, particularly for fluorination steps in active ingredient manufacturing, and provides technical expertise to clients for product development. | Navin Fluorine delivers strong benefits through its localized and cost-competitive supply across India and regional markets, reducing reliance on imports. Its KF offerings are widely used in agrochemical synthesis, supported by application-specific technical expertis. |
 |
Morita specializes in high-purity and reagent-grade potassium fluoride, catering primarily to laboratory, electronics, catalyst, and niche pharmaceutical applications. The company also offers custom KF grades with batch certification and packaging flexibility to serve sensitive and precision-driven industries. | The benefits of Morita’s KF products come from their ultra-high purity, which is crucial for electronics, optical, and R&D applications where contamination must be minimized. The company provides packaging options such as bottles and drums with traceability features, enhancing reliability for clients. |
 |
Supplies potassium fluoride for use in fluorination processes, agrochemical formulations, and specialty chemical synthesis. | Enables efficient fluorination, ensures consistent purity, and supports large-scale specialty chemical production. |
Logos and trademarks shown above are the property of their respective owners. Their use here is for informational and illustrative purposes only.
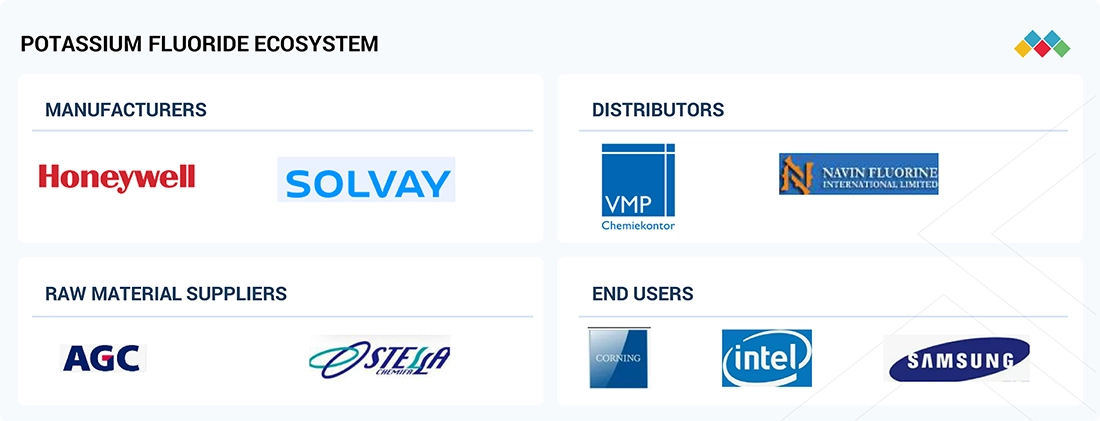
POTASSIUM FLUORIDE MARKET ECOSYSTEM
The potassium fluoride ecosystem involves identifying and analyzing the interconnected relationships among various stakeholders, including raw material suppliers, manufacturers, distributors, and end-users. The raw material suppliers provide essential chemicals such as potassium carbonate and hydrofluoric acid to potassium fluoride manufacturers. Manufacturers use production methods such as direct fluorination to produce potassium fluoride with high purity and specific grades. Distributors and suppliers act as intermediaries between manufacturers and end users, ensuring a steady and timely supply of potassium fluoride. By managing the supply chain efficiently, distributors help reduce lead times, optimize inventory management, and enhance overall operational efficiency. End users rely on consistent quality and availability of potassium fluoride to maintain their production processes and meet regulatory standards. The integration of these stakeholders, from raw material sourcing to delivery to end users, strengthens the market ecosystem, supports demand growth, and ensures that manufacturers can respond effectively to industry trends and fluctuations in global demand.
Logos and trademarks shown above are the property of their respective owners. Their use here is for informational and illustrative purposes only.
POTASSIUM FLUORIDE MARKET SEGMENTS
Source: Secondary Research, Interviews with Experts, MarketsandMarkets Analysis
Potassium Fluoride Market Ecosystem, By Form
Solid potassium fluoride holds the largest share in the market due to its stability, reliability, and ease of handling. In solid form, potassium fluoride resists moisture and chemical degradation, which ensures consistent quality during storage and transport. Its structure allows for precise measurement and controlled use, making it easier for manufacturers and distributors to manage quantities accurately and reduce losses. Solid potassium fluoride can be stored for long periods without special conditions, providing flexibility in inventory management and supply planning. The compact nature of solid potassium fluoride allows higher concentration to be transported and stored efficiently, reducing costs and improving operational convenience. Additionally, solid potassium fluoride is adaptable to different packaging methods such as pellets, granules, or powder, which enhances flexibility for distribution and logistics. Its durability under various environmental conditions makes it a reliable choice for suppliers and end users who require consistent quality. The combination of chemical stability, ease of storage and handling, precise dosing capability, and flexibility in packaging has contributed to solid potassium fluoride maintaining the largest market share.
Potassium Fluoride Market Ecosystem, By Purity
The 95–99% percent purity segment accounts for the largest share in the potassium fluoride market due to its wide industrial acceptance and practical manufacturing advantages. This purity range ensures consistent chemical performance in various processes while being easier to produce and handle on a large scale. Manufacturing potassium fluoride at 95–99% percent purity involves controlled processes that optimize yield and maintain quality, making it economically efficient for producers. The stability of potassium fluoride within this purity range allows for long-term storage and transportation without significant degradation, ensuring reliability for industrial supply chains. It also offers predictable performance in reactions, supporting operational consistency and reducing the risk of variability in production processes. The widespread availability of potassium fluoride at 95–99% percent purity further enhances its market share, as suppliers can maintain steady production volumes to meet global demand. Its balance of performance, stability, and manufacturing efficiency makes this purity range the preferred choice in the market.
Potassium Fluoride Market Ecosystem, By Application
The agrochemical formulation segment accounts for the largest share in the potassium fluoride market due to its essential role as a key fluorinating agent in the production of crop protection chemicals. Potassium fluoride is widely used in the synthesis of various agrochemicals, including herbicides, fungicides, and insecticides, where it helps improve chemical stability, solubility, and bioavailability of active ingredients. Its ability to enhance the effectiveness and durability of these formulations makes it a critical raw material for agrochemical manufacturers. With the global agricultural sector striving to increase crop yields and quality amid limited arable land and changing climatic conditions, demand for efficient and high-performance agrochemicals continues to rise. This trend, in turn, supports the increasing consumption of potassium fluoride. Furthermore, ongoing research and product development in fluorine-based agrochemicals are creating new application opportunities, particularly in developing regions where modern farming practices are being adopted. Overall, the compound’s versatility, chemical efficiency, and growing importance in crop protection formulations underpin its leading position in the potassium fluoride market.
Potassium Fluoride Market Ecosystem, By End-use Industry
The chemical industry accounts for the largest share in the potassium fluoride market due to the compound’s essential role in a wide range of chemical processes and reactions. Potassium fluoride is valued for its ability to provide a consistent source of fluoride ions, which are critical in numerous synthetic and transformation reactions. Its stability, purity, and reliability make it a preferred choice for large-scale chemical production, allowing manufacturers to maintain consistent quality and performance across different batches. The established production techniques for potassium fluoride ensure that the chemical industry has steady access to the material in sufficient quantities, supporting continuous operations and minimizing disruptions. Furthermore, potassium fluoride’s versatility in facilitating various reactions, including fluorination and other specialized chemical transformations, enhances its significance within the chemical sector. Its robust physical and chemical properties allow for safe handling, storage, and transportation, which is essential for high-volume industrial applications. The combination of predictable performance, wide applicability in multiple chemical reactions, and operational convenience has contributed to the dominance of the chemical industry as the primary end-use segment for potassium fluoride.
REGION
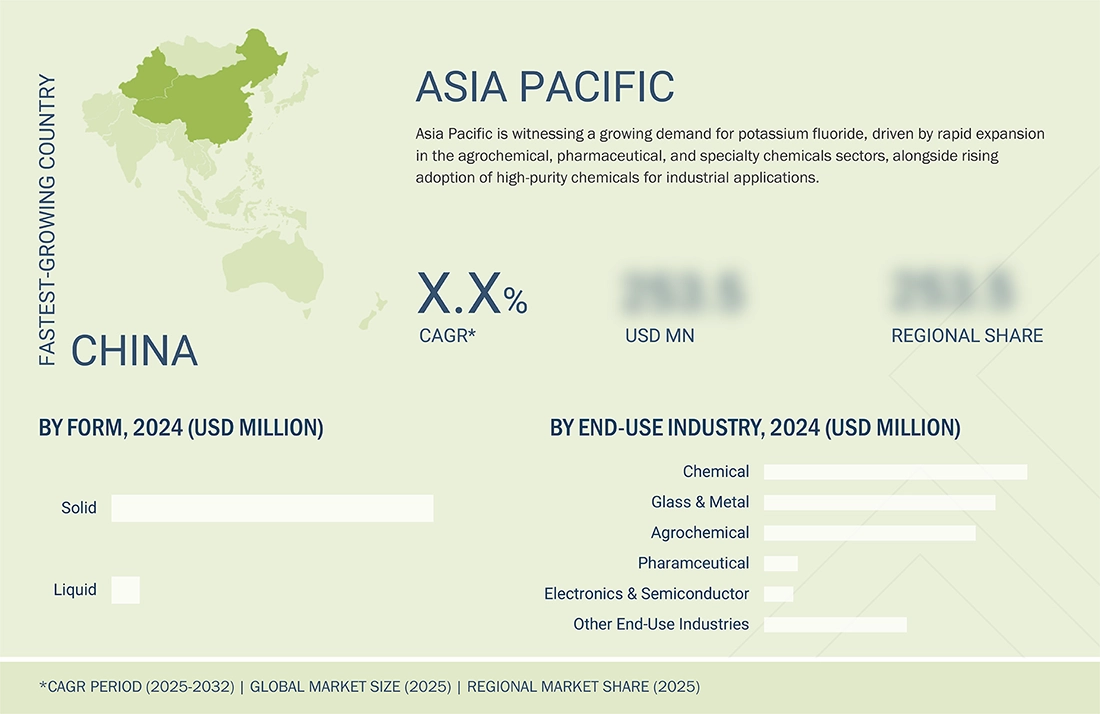
Asia Pacific to be largest and fastest-growing region in global Potassium Fluoride market during forecast period
Asia Pacific accounts for the largest share of the potassium fluoride market, driven by a combination of strong production capabilities, abundant raw material availability, and rapidly growing industrial demand across the region. Countries such as China, India, and Japan have well-established chemical manufacturing infrastructures that support the large-scale production of potassium fluoride at competitive costs. The availability of key raw materials, along with advanced production technologies, enables manufacturers in the region to maintain consistent quality and meet both domestic and international demand. Rapid industrialization and expansion of sectors such as chemicals, pharmaceuticals, electronics, and agrochemicals further drive the consumption of potassium fluoride within the region. In addition, favorable government policies, investments in chemical production facilities, and strategic initiatives to strengthen manufacturing and export capabilities contribute to Asia Pacific’s dominant position. The region also benefits from efficient supply chain networks, established logistics infrastructure, and proximity to key end-use markets, which reduces transportation costs and enhances market accessibility.
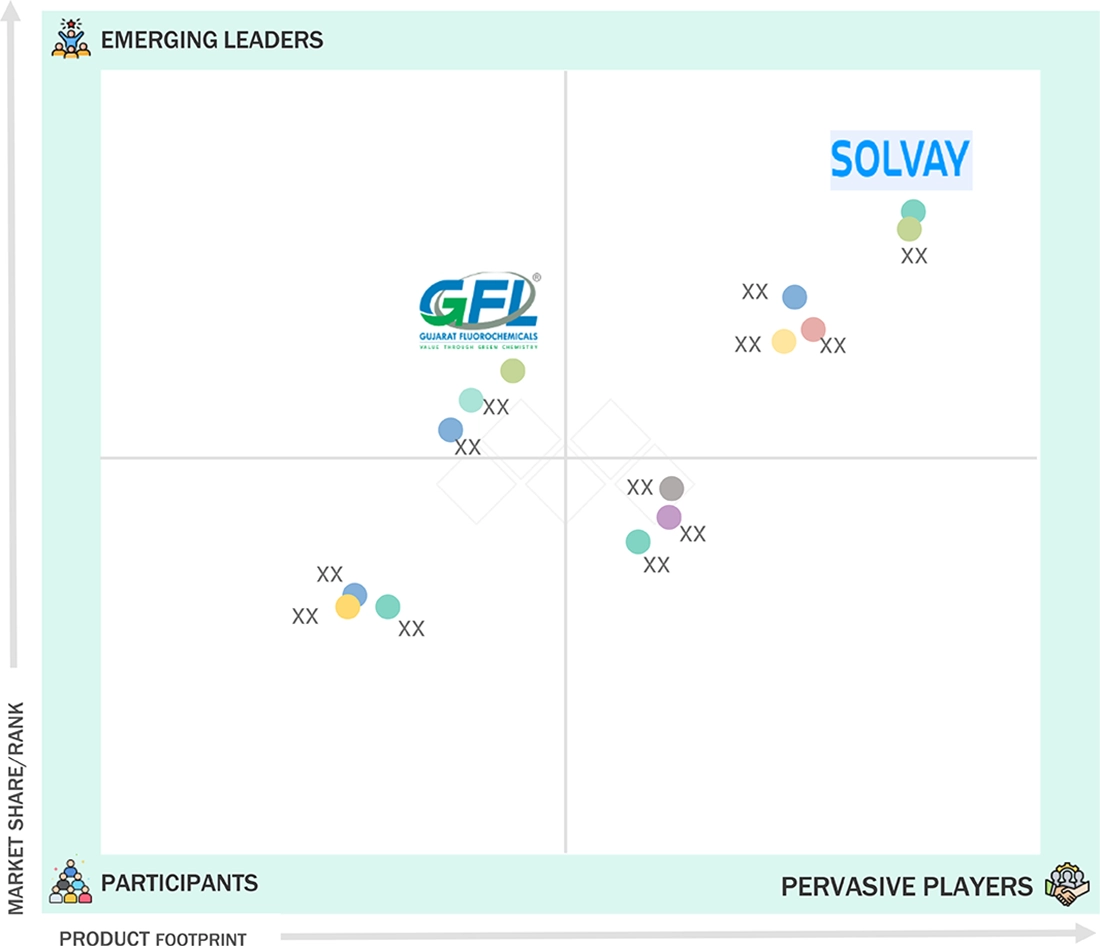
Potassium Fluoride Market: COMPANY EVALUATION MATRIX
The potassium fluoride market is characterized by a mix of emerging leaders, participants, pervasive players, and dominant stars. The chart highlights Solvay as a strong market leader in terms of both market share and product footprint, positioning it in the "Stars" quadrant. Gujarat Fluorochemicals Limited falls within the Emerging Leaders quadrant. Several smaller players cluster in the "Participants" and "Pervasive Players" zones, reflecting niche positioning or early-stage growth potential. Overall, market dynamics suggest strong competition, with global giants driving innovation while smaller companies strive for differentiation and market penetration.
Source: Secondary Research, Interviews with Experts, MarketsandMarkets Analysis
POTASSIUM FLUORIDE MARKET PLAYERS
- Aarti Industries Ltd. (India)
- Gujarat Fluorochemicals Limited (India)
- MORITA CHEMICAL INDUSTRIES CO., LTD. (Japan)
- Navin Fluorine International limited (India)
- Honeywell International Inc. (US)
- NACALAI TESQUE, INC. (Japan)
- Tanfac Industries Ltd. (India)
- FUJIFILM Wako Pure Chemical Corporation (Japan)
- Solvay (Belgium)
POTASSIUM FLUORIDE MARKET SCOPE
| REPORT METRIC | DETAILS |
|---|---|
| Market Size in 2024 (Value) | USD 0.41 Billion |
| Market Forecast in 2032 (value) | USD 0.52 Billion |
| Growth Rate | CAGR of 2.9% from 2025–2032 |
| Years Considered | 2021–2032 |
| Base Year | 2024 |
| Forecast Period | 2025–2032 |
| Units Considered | Value (USD Million), Volume (Kiloton) |
| Report Coverage | Revenue forecast, company ranking, competitive landscape, growth factors, and trends |
| Segments Covered | • Form: Solid and Liquid • Purity: 95– 99% and > 99% • Application: Fluorination & Analytical Reagent, Glass Etching, Flux, Metal Surface Treatment, Catalyst, Electrolyte additive, Agrochemical Formulations, and other applications • End-use Industry: Agrochemical, Chemical, Glass & Metal, Pharmaceutical, Electronics & Semiconductor, and Other end-use industries |
| Regions Covered | Asia Pacific,North America, Europe, Middle East & Africa, South America |
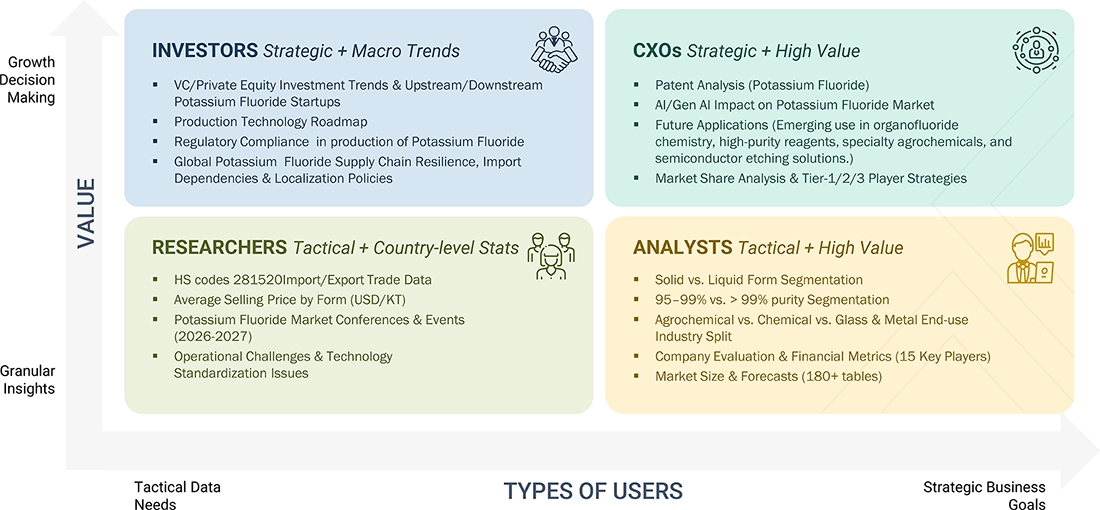
WHAT IS IN IT FOR YOU: Potassium Fluoride Market REPORT CONTENT GUIDE
DELIVERED CUSTOMIZATIONS
We have successfully delivered the following deep-dive customizations:
| CLIENT REQUEST | CUSTOMIZATION DELIVERED | VALUE ADDS |
|---|---|---|
| Country-Level Breakdown | Instead of just regional coverage, the report can provide country-specific market data (e.g., India, Brazil, Saudi Arabia, South Africa, Mexico). This includes demand drivers, production capacities, import/export trends, and regulatory outlooks. | Helps companies identify high-growth national markets and plan market entry strategies with greater accuracy. |
| Application-Specific Deep Dive | A customized focus on specific potassium fluoride applications such Fluorination & Analytical Reagent, Glass Etching, Flux, Metal Surface Treatment, Catalyst, and Electrolyte additive. Includes end-user adoption rates, OEM partnerships, and future demand projections for each application. | Supports clients targeting niche segments, enabling them to design product portfolios or allocate R&D spending more effectively. |
| Purity Customization | Comparative analysis of 95%-99% and above 99% purity levels. Covers performance benchmarks, technical advantages, pricing, and suitability for different industries. | Enables manufacturers and buyers to optimize purity selection, align pricing with performance |
| Competitive Benchmarking | Extended profiling of regional and niche players alongside global leaders (Solvay, Navin Fluorine International limited). Includes SWOT analysis, product differentiation, technology focus, and market positioning. | Provides a clear competitive landscape, helping clients identify potential partners, acquisition targets, or competitive threats. |
RECENT DEVELOPMENTS
- October 2024 : Honeywell announced its plan to spin off its Advanced Materials business into an independent, U.S. publicly traded company. This is targeted to be completed by the end of 2025 or early 2026
- March 2022 : Anupam Rasayan India Limited acquired a 24.96% equity stake in Tanfac Industries Ltd. This strategic inorganic move strengthens Tanfac’s financial base, enhances its production capabilities, and provides potential access to new markets, supporting growth in industrial and specialty potassium fluoride applications.
Table of Contents
 Exclusive indicates content/data unique to MarketsandMarkets and not available with any competitors.
Methodology
The study involved four major activities in estimating the market size of the Potassium Fluoride market. Exhaustive secondary research was conducted to gather information on the market, its peer market, and the parent market. The next step was to validate these findings, assumptions, and sizing with industry experts across the value chain through primary research. Both top-down and bottom-up approaches were employed to estimate the complete market size. Thereafter, the market breakdown and data triangulation procedures were used to estimate the market size of the segments and subsegments.
Secondary Research
During the secondary research process, various secondary sources were consulted to identify and collect information for this study. These secondary sources include annual reports, press releases, investor presentations from companies, white papers, certified publications, trade directories, articles from recognized authors, reputable websites, and databases.
Secondary research has been utilized to gather key information about the industry's value chain, the market's monetary chain, the total pool of key potassium fluoride, market classification and segmentation according to industry trends, and regional markets, all the way down to the most granular level. It was also used to obtain information about the key developments from a market-oriented perspective.
Primary Research
The potassium fluoride market comprises several stakeholders in the value chain, which include raw material suppliers, manufacturers, and end users. Various primary sources from the supply and demand sides of the potassium fluoride market have been interviewed to obtain qualitative and quantitative information. The primary interviewees from the demand side include key opinion leaders in end-use sectors. The primary sources from the supply side include manufacturers, associations, and institutions involved in the potassium fluoride industry.
Primary interviews were conducted to gather insights such as market statistics, data of revenue collected from the products and services, market breakdowns, market size estimations, market forecasting, and data triangulation. Primary research also helped in understanding the various trends related to form, purity, application, end-use industry, and region. Stakeholders from the demand side, such as CIOs, CTOs, and CSOs, were interviewed to understand the buyer's perspective on the suppliers, products, component providers, and their current usage of potassium fluoride and future outlook of their business, which will affect the overall market.
The breakdown of profiles of the primary interviewees is illustrated in the figure below:

Note: Tier 1, Tier 2, and Tier 3 companies are classified based on their market revenue in 2024, available in the public domain, product portfolios, and geographical presence.
Other designations include sales representatives, production heads, and technicians.
To know about the assumptions considered for the study, download the pdf brochure
Market Size Estimation
The top-down approach was used to estimate and validate the size of various submarkets for potassium fluoride for each region. The research methodology used to estimate the market size included the following steps:
- The key players in the industry have been identified through extensive secondary research.
- The supply chain of the industry has been determined through primary and secondary research.
- The global market was then segmented into five major regions and validated by industry experts.
- All percentage shares, splits, and breakdowns based on form, purity, application, end-use industry, and regions were determined using secondary sources and verified through primary sources.
- All possible parameters that affect the markets covered in this research study were accounted for, viewed in extensive detail, verified through primary research, and analyzed to get the final quantitative and qualitative data. This data was consolidated and added with detailed inputs and analysis, and presented in this report.

Data Triangulation
After arriving at the total market size from the estimation process potassium fluoride above, the overall market has been split into several segments and sub-segments. To complete the overall market engineering process and obtain the exact statistics for all segments and sub-segments, data triangulation and market breakdown procedures have been employed, where applicable. The data has been triangulated by studying various factors and trends from both the demand and supply sides. Additionally, the market size has been validated using both top-down and bottom-up approaches, as well as primary interviews. Hence, for every data segment, there have been three sources: the top-down approach, the bottom-up approach, and expert interviews. The data was assumed to be correct when the values from the three sources matched.
Market Definition
Potassium fluoride is an essential inorganic chemical widely used across multiple industries due to its unique reactivity and ability to provide fluoride ions. Its primary application is in chemical manufacturing, where it is employed in the production of catalysts, specialty chemicals, and fluorinated compounds. KF is also extensively used in glass etching, ceramics, metal surface treatment, and electronics, highlighting its versatility across industrial sectors. The demand for potassium fluoride is closely tied to the growth of these industries and the increasing need for high-purity chemicals. Key factors driving market growth include technological advancements in chemical production, rising industrialization, expanding infrastructure development, and the adoption of environmentally sustainable and energy-efficient processes. In addition, regulatory emphasis on safe handling and efficient use of fluoride compounds encourages innovation and broader application, reinforcing the long-term prospects and strategic importance of the potassium fluoride market globally.
Stakeholders
- Potassium Fluoride Manufacturers
- Potassium Fluoride Traders, Distributors, and Suppliers
- Raw Type Suppliers
- Government and Private Research Organizations
- Associations and Industrial Bodies
- R&D Institutions
- Environmental Support Agencies
Report Objectives
- To define, describe, and forecast the size of the Potassium Fluoride market, in terms of value and volume.
- To provide detailed information regarding the major factors (drivers, opportunities, restraints, and challenges) influencing the growth of the market.
- To estimate and forecast the market size based on form, purity, application, end-use industry, and region.
- To forecast the size of the market with respect to major regions, namely, Europe, North America, Asia Pacific, the Middle East & Africa, and South America, along with their key countries.
- To strategically analyze micromarkets with respect to individual growth trends, prospects, and their contribution to the overall market.
- To analyze opportunities in the market for stakeholders and provide a competitive landscape of market leaders.
- To track and analyze recent developments, such as announcements and expansions in the market.
- To strategically profile key market players and comprehensively analyze their core competencies.
Need a Tailored Report?
Customize this report to your needs
Get 10% FREE Customization
Customize This ReportPersonalize This Research
- Triangulate with your Own Data
- Get Data as per your Format and Definition
- Gain a Deeper Dive on a Specific Application, Geography, Customer or Competitor
- Any level of Personalization
Let Us Help You
- What are the Known and Unknown Adjacencies Impacting the Potassium Fluoride Market
- What will your New Revenue Sources be?
- Who will be your Top Customer; what will make them switch?
- Defend your Market Share or Win Competitors
- Get a Scorecard for Target Partners

Custom Market Research Services
We Will Customise The Research For You, In Case The Report Listed Above Does Not Meet With Your Requirements
Get 10% Free CustomisationTESTIMONIALS

We at Nissan Chemicals Corporation have been clients of MarketsandMarkets for more than a year now. We recently consulted MarketsandMarkets for a study, the team at MarketsandMarkets was extremely professional and organized. The business insights were very detailed and aligned well with our expectations that really helped us formulate the Business Plans and device new strategies for development themes. MarketsandMarkets offers a unique combination of expertise and dedicated engagement model. Their research findings have helped us in designing our Pricing Strategy which will make it easier for us to predict the future sales and profits for the next ten years. We look forward to working with MarketsandMarkets in the future.
VP of Strategy & New Business Development
Leading Specialty Chemical Company
The MarketsandMarkets Engagement Model, composed of both the Knowledge Store and advisory custom research, has greatly helped us in understanding our markets and making strategic decisions. The Knowledge Store is a fast way to allow everyone in our organization to understand more about most any market they are interested in. The ability to then get custom research done and get answers to specific strategic questions and market insight has been spectacular. The Markets and Markets team feel more like colleagues than vendors and their services have helped us change our culture where statements of things like growth opportunities and competitive position are always backed by industry research.

Rich Gibson,
Director, Corporate Strategy
Milliken & Company,
Leading Industrial Manufacturer of specialty chemical, floor covering, performance and protective textile materials, and healthcaremilliken.com
MarketsandMarkets is a trusted resource that helps us to better understand markets that are near-adjacencies-whether its technology, value chain or geography. Their Knowledge Store platform provides a dashboard of markets and their characteristics which is easy to use and saves us time.
Adam Shaw,
Market Development and Strategy Manager
AdvanSix Inc. USA,
An American Leader in Chemicalswww.advansix.com
The Knowledge Store from MarketsandMarkets is a valuable tool which has helped my team acquire greater insight in to the end markets that our business serves. This has enabled us to help our company build stronger strategies throughout our planning process.
TOSHIO KINOSHITA
Senior Chif Consultion Research & Consulting Division
Mitsubishi Chemical Research Corporation,
Leading Manufacturer of Chemical Productswww.mitsubishichem-res.co.jp/en/

We recently engaged with MarketsandMarkets for a study, the team not only clearly understood our business objectives but was also extremely professional in the way they handled the entire project. The study was efficiently conducted in a phase-wise manner, and the engagement model furnished us with high-quality business insights that far exceeded our expectations at each phase. We were especially happy that MarketsandMarkets could provide us with both, an English as well as a Japanese version of the study. A special thanks to the Analyst Team and Client Services Team, whose fluency in Japanese enhanced our comfort level, as we could converse with them in our preferred language.
Independent entrepreneurs
Arrow Precision
We approached MarketsandMarkets for study on Proppants Market, and their work exceeded our expectations. The study conducted was comprehensive and enabled us to view the market through the various dimensions. In addition, the team was extraordinarily responsive throughout the process and resolved our queries on time. I strongly recommend MarketsandMarkets and will certainly consider them for additional market assessments we will need in the future.
Global engineering company, Japan
Deputy Manager,
Strategic Planning OfficeThe high-quality insights shared by the MarketsandMarkets team helped us understand the pharmaceutical plant designers in a specific geography. It also captured the risks that we may likely face in communicating with our potential partners. The study would enable us identify partners, which would impact our future growth.


Growth opportunities and latent adjacency in Potassium Fluoride Market