Powder Coating Market by Resin Type (Thermoset and Thermoplastic), Coating Method (Electrostatic Spray, Fluidized Bed), End-use Industry (Appliances, Automotive, General Industrial, Architectural, Furniture) and Region - Global Forecast to 2026
Updated on : January 27, 2023
Powder Coating Market Size
The global powder coating market size was valued at USD 13.8 billion in 2021 and is projected to reach USD 16.8 billion by 2026, growing at a cagr 3.9% from 2021 to 2026. Strong growth can be witnessed in the market in the Asia Pacific region, especially in China, India, and South-East Asian countries. The demand for powder coatings has been increasing due to rising disposable income, leading to increased demand for consumer products, automobiles, and furniture.
To know about the assumptions considered for the study, Request for Free Sample Report
COVID-19 Impact on the Global Powder Coating Market
The outbreak of COVID-19 has disrupted the production of raw materials used in paints and coatings manufacturing. Asian countries such as India, China, Japan, Singapore, and Thailand are the hubs for paints and coatings manufacturing and are major suppliers of these raw materials. The outbreak of the novel coronavirus in Asia Pacific has affected the supply of these raw materials. For instance, China is one of the major suppliers of resins and exports a million tons of resins in the global market. The break in the supplies of raw materials has reduced the production of paints and coatings products.
In April 2020, all private buildings and construction sites, government constructions, and refinish automotive businesses were hit drastically. Retailers are also canceling already placed bulk orders of paint and coatings products due to the shutdown of the market. End-use consumers are not buying expensive coating technologies such as polyurea and polyurethanes from distributors and retailers due to COVID-19. Overall, the sales of paints and coatings products are hampered at the distributors’ level due to the suspension of construction and building activities.
Powder Coating Market Dynamics
Driver: Growth in various end-use industries
Powder coatings have a wide range of applications in automotive, appliances, furniture, architectural, general industrial, and other industries. There is growth in the demand for powder coatings with new applications being developed. The furniture and appliances industries will continue to grow steadily in the future. IT and telecom are also new markets, where applications of powder coatings are extensively explored. Door handles, bumpers, window handles, and other parts of automobiles, including radiator coil spring, shock absorbers, and breaking parts, are also powder coated. Steady economic growth is bringing more investments to the Asia Pacific region. Since the last decade, investments by steel companies have pushed the development of appliances, construction, automotive, and electronics sectors in the developing countries of Asia Pacific and the Middle East. The growth of these industries is driving the demand for powder coatings.
Restraint: Difficulty in obtaining thin films
Powder coatings produce a thick finish on metal products. It is difficult to produce thin finishes using these coatings. The thickening of the polymer can lead to the formation of an uneven texture. Uniform flow and leveling are prerequisites for thin films. Although any powder coating can be formulated for thin film applications, not all these chemistries are suitable for it. The thin film of powder coating becomes more and more orange peeled in texture due to the particle size and glass transition temperature of the powder. For optimum material handling and ease of application, powder coating should have a particle size in the range of 30 to 50 micrometers. A successful thin film application involves the correlation between color and opacity of pigmentation of powder coatings.
Opportunity: Increasing use of powder coating in automotive industry
2018 has been a year of many innovations and technological advancements in the automotive industry. Sustainability plays an important role in the future of self-driving cars, with the global autonomous market expected to be worth USD 60 billion in 2030. In 2022, market predictions remain cautiously optimistic along with light vehicle sales set to increase, though modestly. Investments in the automotive industry in China provide high growth opportunities to powder coating manufacturers, as it is one of the main applications of this coating.
Powder coating is used for coating automotive engines, chassis, wheels, filters, joysticks, mirrors, wipers, horns, and other parts of vehicles. Transparent powder coating is being developed as a varnish for car bodies. Powder coatings have been traditionally used in these areas and have gained confidence. They have proven to be exceptionally durable and corrosion-free, along with the capability to impart high-quality esthetics.
Powder Coating Market Challenge Environmental Challenges
The powder coating industry faces many environmental challenges with the increasing focus on meeting state and local regulations regarding wastewater discharge. Powder coating operations have metals, oil & grease, and suspended solids in their waste streams generated during cleaning and pre-treatment phases of their operations. It is difficult for powder coating manufacturers to meet many state and local environmental regulations. Metal finishing companies that use various electroplating processes have been facing the challenges of heavy metal contamination in wastewater.
Powder Coating Market Ecosystem
To know about the assumptions considered for the study, download the pdf brochure
Appliance segment accounted for the largest share of the powder coating market in 2020.
The appliances industry uses powder coatings on front and side panels of refrigerators, dryer drums, air-conditioner cabinets, washer tops and lids, water heaters, dishwasher racks, freezer cabinets, and cracks of microwave ovens. For some applications, pre-coated blank stock is coated and then post-formed in the desired shape. The global appliances market is increasing due to the technological advancements, growth in the housing sector, rapid urbanization, rise in per capita income, improved standard of living, change in consumer lifestyle, and the escalating number of smaller households. Consumers are inclined towards the use of eco-friendly and energy-efficient appliances. These factors will drive the market for powder coatings.
Thermoset segment is projected to witness the fastest growth during the forecast period.
Thermoset powder coatings are derived from different resins such as epoxies, polyesters, acrylics, and polyurethanes. They require lower curing temperature as compared to thermoplastic resins. It is important to subject the powder-coated substrate to heat to allow the thermoset to flow evenly on the surface. The most significant development in thermoset powder coatings is the capacity to engineer resin types with different properties for use in different applications. Polyesters and acrylics now find greater use in automotive and appliances industries though epoxy resin powder coating was traditionally used earlier. Most of the thermoset powder coats provide a high level of corrosion, impact, and temperature resistance. These two industries will drive the demand for thermoset powder coatings.
Asia Pacific is the largest powder coating market in the forecast period
Asia Pacific is currently the fastest-growing and the largest market for powder coatings. With economic contraction and saturation in European and North American markets, the demand is shifting to the Asia Pacific region. Powder coating manufacturers are targeting this region, as it has the strongest construction industry, accounting for approximately 40% of global construction spending. Countries such as India, China, and Indonesia are investing heavily in various end-use industries, which is likely to influence the growth of the powder coatings market in these countries. The demand is also growing in the region, with a rise in income levels. Many foreign players are investing in the market of these countries to cater to the demand for powder coatings.
The spread of the coronavirus started in China in early January 2020. Within a small period, the spread in other Asian countries such as Japan, South Korea, and Thailand resulted in the pandemic situation, with rapid positive cases and death. This situation led national governments across Asia Pacific to announce lockdowns, leading to a decrease in traffic, construction & mining activities, manufacturing industries, and so on. Since China is a manufacturing hub globally, the impact of COVID-19 is anticipated to be much higher in the country. Considering the above factors, the powder coatings market is expected to decline in Asia Pacific in 2020.
Powder Coating Market Players
The key players operating in the market are PPG Industries, Inc. (US), The Sherwin-Williams Company (US), Akzo Nobel N.V. (Netherlands), Axalta Coating Systems, LLC (US), and Jotun A/S (Norway).
Powder Coating Market Report Scope
Report Metric |
Details |
Market Size Value in 2021 |
USD 13.8 billion |
Revenue Forecast in 2026 |
USD 16.8 billion |
CAGR |
3.9% |
Years considered for the study |
2017-2026 |
Base year |
2020 |
Forecast Period |
2021–2026 |
Forecast Units |
Value (USD) and Volume (Kiloton) |
Segments Covered |
By Resin Type, By Coating Method, By End-use Industry,By Region |
Geographies Covered |
Asia Pacific, Europe, North America, South America, and Middle East & Africa |
Companies Covered |
The major market players are PPG INDUSTRIES, INC. (US), The Sherwin-Williams company (US), AkzoNobel (Netherlands), Axalta coating systems (US), Jotun, and Tiger Coatings (Austria) (Total 39 companies) |
This research report categorizes the powder coating market based on type, coating method, end-use industry, and region.
By Type:
- Thermoset
- Thermoplastic
By Coating method
- Electrostatic spray
- Fluidized bed
- Others (Electrostatic fluidized bed process and flame spraying)
By End-use Industry:
- Appliances
- Automotive
- General Industrial
- Architectural
- Furniture
- Other (Oil & gas, biopharma, wastewater, pipes, fittings, filters, flanges, valves, and tanks)
By Region:
- Asia Pacific
- Europe
- North America
- South America
- Middle East & Africa
Recent Developments
- In December 2021, PPG Industries, Inc invested USD 2.7 million to expand its powder coatings manufacturing capabilities in Sumaré, Brazil. The project will increase the plant’s production capacity for powder coatings by approximately 40%, beginning in the third quarter of 2022.
- In February 2021, AkzoNobel N.V. inaugurated a new R&D facility in Como, Italy which features an application lab, process lab, and analytical & testing lab. This lab is dedicated to delivering low cure powder coatings for use on heat-sensitive substrates.
Frequently Asked Questions (FAQ):
What is the current size of the global powder coatings market?
The global powder coatings market is estimated to be USD 10.8 billion in 2020 and is projected to reach USD 16.8 billion by 2026, at a CAGR of 3.9%.
Who are the major players of the powder coatings market?
Companies such as PPG Industries Inc. (US), The Sherwin-Williams Company (US), Akzo Nobel N.V. (Netherlands), Asian Paints Limited (India), Axalta Coating Systems (US), Jotun A/S (Norway), Kansai Paint Company Limited (Japan), Nippon Paints Holdings Co. Ltd. (Japan), and RPM International Inc. (US) are the major players in the market.
Where will all these developments take the industry in the mid-to-long term?
Continuous developments in the market, including new product launches, mergers & acquisitions, and investments & expansions are expected to help the market grow. Several products are being introduced, and investments are made on increasing the production capacity of powder coatings by manufacturers for different applications. The advancement in technology is expected to increase the penetration of powder coatings in various end-use industries.
Which segment has the potential to register the highest market share?
Appliances industry is the largest segment in powder coatings market. Several key factors, such as increase in per capita income and consumer spending, changing consumer preferences, and growing need for automation and technology advancements, are behind the rapid growth of the powder-coated appliances market. The developing economies of India, Brazil, and Russia are expected to be key consumers during the projected period because of the developing consumer goods market in these countries.
What are some of the technological advancements in the market?
Technological advancements in powder coating materials, their unique applications, and advanced curing methods have enhanced the use of powder coating in heat-sensitive substrates. Medium-density fiberboard (MDF), a combination panel bonding between particles of wood and synthetic resin, is one of the most important advancements in powder coatings used in heat-sensitive substrate applications. .
To speak to our analyst for a discussion on the above findings, click Speak to Analyst
TABLE OF CONTENTS
1 INTRODUCTION (Page No. - 46)
1.1 OBJECTIVES OF STUDY
1.2 MARKET DEFINITION
1.2.1 MARKET INCLUSIONS
1.2.2 MARKET EXCLUSIONS
1.3 MARKET SEGMENTATION
1.3.1 REGIONS COVERED
1.3.2 YEARS CONSIDERED FOR STUDY
1.4 CURRENCY
1.5 UNIT CONSIDERED
1.6 STAKEHOLDERS
1.7 SUMMARY OF CHANGES
2 RESEARCH METHODOLOGY (Page No. - 51)
2.1 RESEARCH DATA
FIGURE 1 POWDER COATINGS MARKET: RESEARCH DESIGN
2.1.1 SECONDARY DATA
2.1.1.1 Key data from secondary sources
2.1.2 PRIMARY DATA
2.1.2.1 Primary data sources
2.1.2.2 Key data from primary sources
2.1.2.3 Key industry insights
2.1.2.4 Breakdown of primary interviews
2.2 MARKET SIZE ESTIMATION
FIGURE 2 MARKET SIZE ESTIMATION: SUPPLY-SIDE
FIGURE 3 POWDER COATINGS MARKET ESTIMATION, BY REGION
2.2.1 BOTTOM-UP APPROACH
FIGURE 4 MARKET SIZE ESTIMATION: BOTTOM-UP APPROACH
2.2.2 TOP-DOWN APPROACH
FIGURE 5 MARKET SIZE ESTIMATION: TOP-DOWN APPROACH
2.3 DATA TRIANGULATION
FIGURE 6 POWDER COATINGS MARKET: DATA TRIANGULATION
2.4 ASSUMPTIONS
2.5 RISK ANALYSIS ASSESSMENT
2.6 LIMITATIONS
2.7 GROWTH RATE ASSUMPTIONS/GROWTH FORECAST
3 EXECUTIVE SUMMARY (Page No. - 61)
TABLE 1 POWDER COATINGS MARKET SNAPSHOT (2021 VS. 2026)
FIGURE 7 THERMOSET SEGMENT DOMINATED POWDER COATINGS MARKET IN 2020
FIGURE 8 APPLIANCES SEGMENT ACCOUNTED FOR HIGHEST SHARE OF OVERALL POWDER COATINGS MARKET (2020)
FIGURE 9 ASIA PACIFIC TO DOMINATE POWDER COATINGS MARKET BETWEEN 2021 AND 2026
4 PREMIUM INSIGHTS (Page No. - 65)
4.1 ATTRACTIVE OPPORTUNITIES IN POWDER COATINGS MARKET
FIGURE 10 EMERGING ECONOMIES TO OFFER LUCRATIVE GROWTH POTENTIAL FOR MARKET PLAYERS
4.2 MARKET SIZE, BY END-USE INDUSTRY
FIGURE 11 APPLIANCES SEGMENT TO WITNESS HIGHEST GROWTH IN OVERALL MARKET BETWEEN 2021 AND 2026
4.3 ASIA PACIFIC POWDER COATINGS MARKET, BY END-USE INDUSTRY AND COUNTRY
FIGURE 12 AUTOMOTIVE SEGMENT ACCOUNTED FOR LARGEST SHARE IN 2020
4.4 MARKET SIZE, DEVELOPED VS. DEVELOPING ECONOMIES
FIGURE 13 DEMAND FOR POWDER COATINGS TO GROW FASTER IN DEVELOPING ECONOMIES
4.5 MARKET: MAJOR COUNTRIES
FIGURE 14 INDIA TO WITNESS HIGHEST CAGR DURING FORECAST PERIOD
5 MARKET OVERVIEW (Page No. - 68)
5.1 INTRODUCTION
5.1.1 ADVANTAGES AND DISADVANTAGES OF POWDER COATINGS
5.1.2 BENEFITS OF POWDER COATINGS OVER LIQUID COATINGS
5.2 MARKET EVOLUTION
5.2.1 POWDER COATINGS ADOPTION IN DIFFERENT APPLICATIONS, 1950–2000
FIGURE 15 EVOLUTION OF POWDER COATINGS IN INDUSTRIES BETWEEN 1950 AND 2000
5.3 MARKET DYNAMICS
FIGURE 16 DRIVERS, RESTRAINTS, OPPORTUNITIES, AND CHALLENGES IN POWDER COATINGS MARKET
5.3.1 DRIVERS
5.3.1.1 Stringent government regulations pertaining to powder coatings
5.3.1.2 Growth in various end-use industries
5.3.1.3 Technological advancements
5.3.2 RESTRAINT
5.3.2.1 Difficulty in obtaining thin films
5.3.3 OPPORTUNITIES
5.3.3.1 Increasing use of powder coatings in automotive industry
5.3.3.2 Emerging applications in shipbuilding and pipeline industries
5.3.3.3 Growing demand for high-performance fluorine resin-based powder coating
5.3.3.4 Surging demand for powder coatings for coil coating applications
5.3.3.5 Emergence of new application methods
5.3.4 CHALLENGE
5.3.4.1 Environmental challenges
5.4 PORTER’S FIVE FORCES ANALYSIS
TABLE 2 PORTER’S FIVE FORCES ANALYSIS
FIGURE 17 PORTER’S FIVE FORCES ANALYSIS: POWDER COATINGS
5.4.1 THREAT OF SUBSTITUTES
5.4.2 BARGAINING POWER OF BUYERS
5.4.3 THREAT OF NEW ENTRANTS
5.4.4 BARGAINING POWER OF SUPPLIERS
5.4.5 INTENSITY OF COMPETITIVE RIVALRY
5.5 MACRO INDICATOR ANALYSIS
5.5.1 INTRODUCTION
5.5.2 TRENDS AND FORECAST OF GDP
TABLE 3 GDP PERCENTAGE CHANGE OF KEY COUNTRIES, 2019–2026
5.5.3 TRENDS AND FORECAST OF GLOBAL AUTOMOTIVE INDUSTRY
TABLE 4 AUTOMOTIVE INDUSTRY PRODUCTION (2019–2020)
5.5.4 TRENDS AND FORECAST OF GLOBAL APPLIANCE INDUSTRY
FIGURE 18 REVENUE IN GLOBAL HOUSEHOLD APPLIANCES INDUSTRY (2013–2026)
FIGURE 19 TRENDS AND FORECAST OF GLOBAL APPLIANCES DISTRIBUTION CHANNEL
5.5.5 TRENDS AND FORECAST OF GLOBAL FURNITURE INDUSTRY
FIGURE 20 VALUE OF GLOBAL FURNITURE INDUSTRY FROM 2020 TO 2027
5.5.6 TRENDS AND FORECAST OF GLOBAL CONSTRUCTION INDUSTRY
FIGURE 21 GLOBAL SPENDING IN CONSTRUCTION INDUSTRY, 2014–2035
5.6 COVID-19 IMPACT
5.6.1 COVID-19 ECONOMIC ASSESSMENT
FIGURE 22 WORLD ECONOMIC OUTLOOK GROWTH PROJECTIONS
5.6.2 COVID-19 ECONOMIC IMPACT – SCENARIO ASSESSMENT
FIGURE 23 FACTORS IMPACTING ECONOMIES OF SELECT G20 COUNTRIES IN 2020
5.7 IMPACT OF COVID-19 ON END-USE INDUSTRIES
FIGURE 24 PRE-COVID-19 IMPACT AND POST-COVID-19 IMPACT MARKET SCENARIOS: POWDER COATINGS MARKET
5.8 VALUE CHAIN OF PAINTS & COATINGS INDUSTRY
FIGURE 25 PAINTS & COATINGS VALUE CHAIN
FIGURE 26 IMPACT OF COVID-19 ON VALUE CHAIN NODES
FIGURE 27 IMPACT OF COVID-19 ON PAINTS & COATINGS MARKET
5.9 IMPACT ON VALUE CHAIN
5.9.1 RAW MATERIALS/SUPPLIERS
5.9.2 PAINTS & COATINGS FORMULATORS
5.9.3 APPLICATORS
5.9.4 DISTRIBUTORS
TABLE 5 DISTRIBUTORS: OFFERINGS AND SERVICES
5.9.5 END-USE INDUSTRIES
5.10 CUSTOMER ANALYSIS
5.10.1 SHIFT IN AUTOMOTIVE INDUSTRY
5.10.2 IMPACT ON CUSTOMERS’ OUTPUT & STRATEGIES TO RESUME/ IMPROVE PRODUCTION
5.10.2.1 Impact on customers’ revenues
5.10.2.2 Most impacted regions
5.10.2.2.1 Short-term strategies to manage cost structure and supply chains
5.10.2.3 New market opportunities/growth opportunities
5.10.2.4 Customers’ perspective on the growth outlook
5.11 SHIFT IN AEROSPACE INDUSTRY
5.11.1 DISRUPTION IN INDUSTRY
5.11.2 IMPACT ON CUSTOMERS’ OUTPUT & STRATEGIES TO RESUME/IMPROVE PRODUCTION
5.11.3 IMPACT ON CUSTOMERS’ REVENUES
5.11.3.1 Most impacted regions
5.11.3.2 Short-term strategies to manage cost structure and supply chains
5.11.4 NEW MARKET OPPORTUNITIES/GROWTH OPPORTUNITIES
5.11.4.1 Measures taken by customers
5.11.4.2 Customers’ perspective on growth outlook
5.12 SHIFT IN CONSTRUCTION INDUSTRY
5.12.1 DISRUPTION IN INDUSTRY
5.12.2 IMPACT ON CUSTOMERS’ OUTPUT & STRATEGIES TO RESUME/IMPROVE PRODUCTION
5.12.3 IMPACT ON CUSTOMERS’ REVENUES
5.12.3.1 Customers’ most impacted regions
5.12.3.2 Short-term strategies to manage cost structure and supply chains
5.12.4 NEW MARKET OPPORTUNITIES/GROWTH OPPORTUNITIES
5.12.4.1 Measures taken by customers
5.12.4.2 Customers’ perspective on growth outlook
5.13 VALUE CHAIN ANALYSIS
FIGURE 28 POWDER COATING: VALUE CHAIN ANALYSIS
5.14 PRICING ANALYSIS
FIGURE 29 AVERAGE PRICE COMPETITIVENESS IN POWDER COATINGS MARKET
5.15 PAINTS & COATINGS ECOSYSTEM AND INTERCONNECTED MARKETS
TABLE 6 POWDER COATINGS MARKET: SUPPLY CHAIN
FIGURE 30 PAINTS & COATINGS: ECOSYSTEM
5.16 REVENUE SHIFT AND NEW REVENUE POCKETS FOR POWDER COATING MANUFACTURERS
FIGURE 31 REVENUE SHIFT IN POWDER COATINGS MARKET
5.17 TRADE ANALYSIS
TABLE 7 COUNTRY-WISE EXPORT DATA, PAINTS, AND VARNISHES BASED ON SYNTHETIC OR CHEMICALLY MODIFIED POLYMERS DISPERSED AND DISSOLVED IN AQUEOUS MEDIUM, 2020
TABLE 8 COUNTRY-WISE EXPORT DATA, PAINTS, AND VARNISHES BASED ON SYNTHETIC OR CHEMICALLY MODIFIED POLYMERS DISPERSED AND DISSOLVED IN NON-AQUEOUS MEDIUM, 2020
TABLE 9 COUNTRY-WISE IMPORT DATA, PAINTS, AND VARNISHES BASED ON SYNTHETIC OR CHEMICALLY MODIFIED POLYMERS DISPERSED AND DISSOLVED IN AN AQUEOUS MEDIUM, 2020
TABLE 10 COUNTRY-WISE IMPORT DATA, PAINTS, AND VARNISHES BASED ON SYNTHETIC OR CHEMICALLY MODIFIED POLYMERS DISPERSED AND DISSOLVED IN NON-AQUEOUS MEDIUM, 2020
5.18 REGULATIONS
TABLE 11 INTERNATIONALLY RECOGNIZED TEST METHODS
TABLE 12 LIST OF RELEVANT STANDARDS
5.19 PATENT ANALYSIS
5.19.1 PUBLICATION TRENDS
FIGURE 32 NUMBER OF PATENTS PUBLISHED, 2015–2021
5.19.2 TOP APPLICANTS
FIGURE 33 PATENTS PUBLISHED BY MAJOR PLAYERS, 2015–2021
5.19.3 JURISDICTION
FIGURE 34 PATENTS PUBLISHED BY JURISDICTION, 2015–2021
TABLE 13 RECENT PATENTS BY COMPANIES
5.20 CASE STUDY ANALYSIS
5.21 TECHNOLOGY ANALYSIS
6 POWDER COATINGS MARKET, BY RESIN TYPE (Page No. - 127)
6.1 INTRODUCTION
FIGURE 35 THERMOSET POWDER COATINGS DOMINATED OVERALL MARKET IN 2020
TABLE 14 APPLICATION VS RESIN MAPPING
TABLE 15 POWDER COATINGS MARKET SIZE, BY RESIN TYPE, 2017–2020 (USD MILLION)
TABLE 16 MARKET SIZE, BY RESIN TYPE, 2021–2026 (USD MILLION)
TABLE 17 MARKET SIZE, BY RESIN TYPE, 2017–2020 (KILOTON)
TABLE 18 MARKET SIZE, BY RESIN TYPE, 2021–2026 (KILOTON)
6.2 COMPARISON BETWEEN THERMOSET AND THERMOPLASTIC POWDER COATINGS
6.3 THERMOSET
TABLE 19 THERMOSET POWDER COATINGS MARKET SIZE, BY REGION, 2017–2020 (USD MILLION)
TABLE 20 THERMOSET POWDER COATING MARKET SIZE, BY REGION, 2021–2026 (USD MILLION)
TABLE 21 THERMOSET POWDER COATINGS MARKET SIZE, BY REGION, 2017–2020 (KILOTON)
TABLE 22 THERMOSET POWDER COATING MARKET SIZE, BY REGION, 2021–2026 (KILOTON)
6.3.1 POLYESTER
6.3.2 EPOXY POLYESTER HYBRID
6.3.3 EPOXY
6.3.4 ACRYLIC
6.3.5 POLYURETHANE
6.3.6 OTHERS (FLUOROPOLYMER)
FIGURE 36 PERFORMANCE CHARACTERISTICS OF THERMOSETTING POWDER COATINGS
6.4 THERMOPLASTIC
TABLE 23 THERMOPLASTIC POWDER COATINGS MARKET SIZE, BY REGION, 2017–2020 (USD MILLION)
TABLE 24 THERMOPLASTIC POWDER COATING MARKET SIZE, BY REGION, 2021–2026 (USD MILLION)
TABLE 25 THERMOPLASTIC POWDER COATINGS MARKET SIZE, BY REGION, 2017–2020 (KILOTON)
TABLE 26 THERMOPLASTIC POWDER COATING MARKET SIZE, BY REGION, 2021–2026 (KILOTON)
6.4.1 POLYVINYL CHLORIDE (PVC)
6.4.2 POLYVINYL FLUORIDE (PVF)
7 POWDER COATINGS MARKET, BY COATING METHOD (Page No. - 138)
7.1 INTRODUCTION
7.2 ELECTROSTATIC SPRAY
7.2.1 DEMAND FOR ELECTROSTATIC SPRAY INCREASING AT AN IMPRESSIVE RATE
FIGURE 37 POWDER COATING GUN
7.3 FLUIDIZED BED
7.3.1 FLUIDIZED BED METHOD IS MOST WIDELY USED METHOD FOR THERMOPLASTIC SYSTEM
FIGURE 38 FLUIDIZED POWDER BED
7.4 OTHERS
7.4.1 ELECTROSTATIC FLUIDIZED BED
7.4.2 FLAME SPRAYING
8 POWDER COATINGS MARKET, BY END-USE INDUSTRY (Page No. - 142)
8.1 INTRODUCTION
TABLE 27 MARKET SIZE, BY END-USE INDUSTRY, 2017–2020 (USD MILLION)
TABLE 28 MARKET SIZE, BY END-USE INDUSTRY, 2021–2026 (USD MILLION)
TABLE 29 MARKET SIZE, BY END-USE INDUSTRY, 2017–2020 (KILOTON)
TABLE 30 MARKET SIZE, BY END-USE INDUSTRY, 2021–2026 (KILOTON)
8.2 APPLIANCES
FIGURE 39 APPLIANCES SEGMENT ACCOUNTED FOR HIGHEST SHARE OF OVERALL POWDER COATINGS MARKET IN 2020
8.2.1 APPLIANCES IS SECOND-LARGEST END-USER OF THERMOSETTING POWDERS
TABLE 31 POWDER COATINGS MARKET SIZE IN APPLIANCES, BY REGION, 2017–2020 (USD MILLION)
TABLE 32 MARKET SIZE IN APPLIANCES, BY REGION, 2021–2026 (USD MILLION)
TABLE 33 MARKET SIZE IN APPLIANCES, BY REGION, 2017–2020 (KILOTON)
TABLE 34 MARKET SIZE IN APPLIANCES, BY REGION, 2021–2026 (KILOTON)
8.2.2 LIST OF CUSTOMERS
8.2.3 OPERATIONAL DRIVERS OF INDUSTRY & FUTURE OPPORTUNITIES
FIGURE 40 GROWTH RATES OF GLOBAL ELECTRONICS INDUSTRY (2020–2022)
8.3 AUTOMOTIVE
8.3.1 INCREASING CONSUMER PREFERENCE SUPPORTING GROWTH OF AUTOMOTIVE POWDER COATINGS MARKET
TABLE 35 POWDER COATINGS MARKET SIZE IN AUTOMOTIVE, BY REGION, 2017–2020 (USD MILLION)
TABLE 36 MARKET SIZE IN AUTOMOTIVE, BY REGION, 2021–2026 (USD MILLION)
TABLE 37 MARKET SIZE IN AUTOMOTIVE, BY REGION, 2017–2020 (KILOTON)
TABLE 38 MARKET SIZE IN AUTOMOTIVE, BY REGION, 2021–2026 (KILOTON)
8.3.2 LIST OF CUSTOMERS
8.3.3 OPERATIONAL DRIVERS OF INDUSTRY & FUTURE OPPORTUNITIES
8.4 GENERAL INDUSTRIAL
8.4.1 POPULATION GROWTH, IMPROVED STANDARD OF LIVING, AND INFRASTRUCTURE GROWTH ARE DRIVING MARKET
TABLE 39 POWDER COATINGS MARKET SIZE IN GENERAL INDUSTRIAL, BY REGION, 2017–2020 (USD MILLION)
TABLE 40 MARKET SIZE IN GENERAL INDUSTRIAL, BY REGION, 2021–2026 (USD MILLION)
TABLE 41 MARKET SIZE IN GENERAL INDUSTRIAL, BY REGION, 2017–2020 (KILOTON)
TABLE 42 MARKET SIZE IN GENERAL INDUSTRIAL, BY REGION, 2021–2026 (KILOTON)
8.4.2 LIST OF CUSTOMERS
8.4.3 OPERATIONAL DRIVERS OF INDUSTRY & FUTURE OPPORTUNITIES
8.5 ARCHITECTURAL
8.5.1 EXCELLENT DURABILITY AND AVAILABILITY FUELING CONSUMPTION OF POWDER COATINGS
TABLE 43 POWDER COATINGS MARKET SIZE IN ARCHITECTURAL, BY REGION, 2017–2020 (USD MILLION)
TABLE 44 MARKET SIZE IN ARCHITECTURAL, BY REGION, 2021–2026 (USD MILLION)
TABLE 45 MARKET SIZE IN ARCHITECTURAL, BY REGION, 2017–2020 (KILOTON)
TABLE 46 MARKET SIZE IN ARCHITECTURAL, BY REGION, 2021–2026 (KILOTON)
8.5.2 LIST OF CUSTOMERS
8.5.3 OPERATIONAL DRIVERS OF INDUSTRY & FUTURE OPPORTUNITIES
8.6 FURNITURE
8.6.1 CHANGING CUSTOMER PREFERENCE AND IMPROVED STANDARD OF LIVING DRIVE DEMAND FOR POWDER COATINGS
TABLE 47 POWDER COATINGS MARKET SIZE IN FURNITURE, BY REGION, 2017–2020 (USD MILLION)
TABLE 48 MARKET SIZE IN FURNITURE, BY REGION, 2021–2026 (USD MILLION)
TABLE 49 MARKET SIZE IN FURNITURE, BY REGION, 2017–2020 (KILOTON)
TABLE 50 MARKET SIZE IN FURNITURE, BY REGION, 2021–2026 (KILOTON)
8.6.2 LIST OF CUSTOMERS
8.6.3 OPERATIONAL DRIVERS OF INDUSTRY & FUTURE OPPORTUNITIES
8.7 OTHERS
TABLE 51 POWDER COATINGS MARKET SIZE IN OTHER END-USE INDUSTRIES, BY REGION, 2017–2020 (USD MILLION)
TABLE 52 MARKET SIZE IN OTHER END-USE INDUSTRIES, BY REGION, 2021–2026 (USD MILLION)
TABLE 53 MARKET SIZE IN OTHER END-USE INDUSTRIES, BY REGION, 2017–2020 (KILOTON)
TABLE 54 MARKET SIZE IN OTHER END-USE INDUSTRIES, BY REGION, 2021–2026 (KILOTON)
8.7.1 LIST OF CUSTOMERS
8.7.2 OPERATIONAL DRIVERS OF INDUSTRY & FUTURE OPPORTUNITIES
8.8 CUSTOMER KEY REQUIREMENTS
8.9 LIST OF CUSTOMERS (COATERS)
8.10 VOICE OF CUSTOMERS
9 POWDER COATINGS MARKET, BY REGION (Page No. - 179)
9.1 INTRODUCTION
9.1.1 DISRUPTION DUE TO COVID-19
FIGURE 41 ASIA PACIFIC: FASTEST-GROWING MARKET FOR POWDER COATINGS
TABLE 55 POWDER COATINGS MARKET SIZE, BY REGION, 2017–2020 (USD MILLION)
TABLE 56 MARKET SIZE, BY REGION, 2021–2026 (USD MILLION)
TABLE 57 MARKET SIZE, BY REGION, 2017–2020 (KILOTON)
TABLE 58 MARKET SIZE, BY REGION, 2021–2026 (KILOTON)
9.2 ASIA PACIFIC
9.2.1 IMPACT OF COVID-19 ON ASIA PACIFIC
FIGURE 42 ASIA PACIFIC: POWDER COATINGS MARKET SNAPSHOT
TABLE 59 ASIA PACIFIC: POWDER COATINGS MARKET SIZE, BY COUNTRY, 2017–2020 (USD MILLION)
TABLE 60 ASIA PACIFIC: MARKET SIZE, BY COUNTRY, 2021–2026 (USD MILLION)
TABLE 61 ASIA PACIFIC: MARKET SIZE, BY COUNTRY, 2017–2020 (KILOTON)
TABLE 62 ASIA PACIFIC: MARKET SIZE, BY COUNTRY, 2021–2026 (KILOTON)
TABLE 63 ASIA PACIFIC: MARKET SIZE, BY RESIN TYPE, 2017–2020 (USD MILLION)
TABLE 64 ASIA PACIFIC: MARKET SIZE, BY RESIN TYPE, 2021–2026 (USD MILLION)
TABLE 65 ASIA PACIFIC: MARKET SIZE, BY RESIN TYPE, 2017–2020 (KILOTON)
TABLE 66 ASIA PACIFIC: MARKET SIZE, BY RESIN TYPE, 2021–2026 (KILOTON)
TABLE 67 ASIA PACIFIC: MARKET SIZE, BY END-USE INDUSTRY, 2017–2020 (USD MILLION)
TABLE 68 ASIA PACIFIC: MARKET SIZE, BY END-USE INDUSTRY, 2021–2026 (USD MILLION)
TABLE 69 ASIA PACIFIC: MARKET SIZE, BY END-USE INDUSTRY, 2017–2020 (KILOTON)
TABLE 70 ASIA PACIFIC: MARKET SIZE, BY END-USE INDUSTRY, 2021–2026 (KILOTON)
9.2.2 CHINA
9.2.2.1 Rising demand from housing activities, new construction, and renovation activities
TABLE 71 CHINA: POWDER COATINGS MARKET SIZE, BY RESIN TYPE, 2017–2020 (USD MILLION)
TABLE 72 CHINA: MARKET SIZE, BY RESIN TYPE, 2021–2026 (USD MILLION)
TABLE 73 CHINA: MARKET SIZE, BY RESIN TYPE, 2017–2020 (KILOTON)
TABLE 74 CHINA: MARKET SIZE, BY RESIN TYPE, 2021–2026 (KILOTON)
TABLE 75 CHINA: MARKET SIZE, BY END-USE INDUSTRY, 2017–2020 (USD MILLION)
TABLE 76 CHINA: MARKET SIZE, BY END-USE INDUSTRY, 2021–2026 (USD MILLION)
TABLE 77 CHINA: MARKET SIZE, BY END-USE INDUSTRY, 2017–2020 (KILOTON)
TABLE 78 CHINA: MARKET SIZE, BY END-USE INDUSTRY, 2021–2026 (KILOTON)
9.2.3 INDIA
9.2.3.1 Rapid growth in automotive industry to boost market growth
TABLE 79 INDIA: POWDER COATINGS MARKET SIZE, BY RESIN TYPE, 2017–2020 (USD MILLION)
TABLE 80 INDIA: MARKET SIZE, BY RESIN TYPE, 2021–2026 (USD MILLION)
TABLE 81 INDIA: MARKET SIZE, BY RESIN TYPE, 2017–2020 (KILOTON)
TABLE 82 INDIA: MARKET SIZE, BY RESIN TYPE, 2021–2026 (KILOTON)
TABLE 83 INDIA: MARKET SIZE, BY END-USE INDUSTRY, 2017–2020 (USD MILLION)
TABLE 84 INDIA: MARKET SIZE, BY END-USE INDUSTRY, 2021–2026 (USD MILLION)
TABLE 85 INDIA: MARKET SIZE, BY END-USE INDUSTRY, 2017–2020 (KILOTON)
TABLE 86 INDIA: MARKET SIZE, BY END-USE INDUSTRY, 2021–2026 (KILOTON)
9.2.4 JAPAN
9.2.4.1 Japan is third-largest market for powder coatings in Asia Pacific
TABLE 87 JAPAN: POWDER COATINGS MARKET SIZE, BY RESIN TYPE, 2017–2020 (USD MILLION)
TABLE 88 JAPAN: MARKET SIZE, BY RESIN TYPE, 2021–2026 (USD MILLION)
TABLE 89 JAPAN: MARKET SIZE, BY RESIN TYPE, 2017–2020 (KILOTON)
TABLE 90 JAPAN: MARKET SIZE, BY RESIN TYPE, 2021–2026 (KILOTON)
TABLE 91 JAPAN: MARKET SIZE, BY END-USE INDUSTRY, 2017–2020 (USD MILLION)
TABLE 92 JAPAN: MARKET SIZE, BY END-USE INDUSTRY, 2021–2026 (USD MILLION)
TABLE 93 JAPAN: MARKET SIZE, BY END-USE INDUSTRY, 2017–2020 (KILOTON)
TABLE 94 JAPAN: MARKET SIZE, BY END-USE INDUSTRY, 2021–2026 (KILOTON)
9.2.5 THAILAND
9.2.5.1 Large production of automobiles supporting market growth
TABLE 95 THAILAND: POWDER COATINGS MARKET SIZE, BY RESIN TYPE, 2017–2020 (USD MILLION)
TABLE 96 THAILAND: MARKET SIZE, BY RESIN TYPE, 2021–2026 (USD MILLION)
TABLE 97 THAILAND: MARKET SIZE, BY RESIN TYPE, 2017–2020 (KILOTON)
TABLE 98 THAILAND:MARKET SIZE, BY RESIN TYPE, 2021–2026 (KILOTON)
TABLE 99 THAILAND: MARKET SIZE, BY END-USE INDUSTRY, 2017–2020 (USD MILLION)
TABLE 100 THAILAND: MARKET SIZE, BY END-USE INDUSTRY, 2021–2026 (USD MILLION)
TABLE 101 THAILAND: MARKET SIZE, BY END-USE INDUSTRY, 2017–2020 (KILOTON)
TABLE 102 THAILAND: MARKET SIZE, BY END-USE INDUSTRY, 2021–2026 (KILOTON)
9.2.6 SOUTH KOREA
9.2.6.1 Automotive industry is driving market significantly
TABLE 103 SOUTH KOREA: POWDER COATINGS MARKET SIZE, BY RESIN TYPE, 2017–2020 (USD MILLION)
TABLE 104 SOUTH KOREA: MARKET SIZE, BY RESIN TYPE, 2021–2026 (USD MILLION)
TABLE 105 SOUTH KOREA: MARKET SIZE, BY RESIN TYPE, 2017–2020 (KILOTON)
TABLE 106 SOUTH KOREA: MARKET SIZE, BY RESIN TYPE, 2021–2026 (KILOTON)
TABLE 107 SOUTH KOREA: MARKET SIZE, BY END-USE INDUSTRY, 2017–2020 (USD MILLION)
TABLE 108 SOUTH KOREA: MARKET SIZE, BY END-USE INDUSTRY, 2021–2026 (USD MILLION)
TABLE 109 SOUTH KOREA: MARKET SIZE, BY END-USE INDUSTRY, 2017–2020 (KILOTON)
TABLE 110 SOUTH KOREA: MARKET SIZE, BY END-USE INDUSTRY, 2021–2026 (KILOTON)
9.2.7 INDONESIA
9.2.7.1 Investments in new automotive manufacturing capacities to increase use of powder coatings
TABLE 111 INDONESIA: POWDER COATINGS MARKET SIZE, BY RESIN TYPE, 2017–2020 (USD MILLION)
TABLE 112 INDONESIA: MARKET SIZE, BY RESIN TYPE, 2021–2026 (USD MILLION)
TABLE 113 INDONESIA: MARKET SIZE, BY RESIN TYPE, 2017–2020 (KILOTON)
TABLE 114 INDONESIA: MARKET SIZE, BY RESIN TYPE, 2021–2026 (KILOTON)
TABLE 115 INDONESIA: MARKET SIZE, BY END-USE INDUSTRY, 2017–2020 (USD MILLION)
TABLE 116 INDONESIA: MARKET SIZE, BY END-USE INDUSTRY, 2021–2026 (USD MILLION)
TABLE 117 INDONESIA: MARKET SIZE, BY END-USE INDUSTRY, 2017–2020 (KILOTON)
TABLE 118 INDONESIA: MARKET SIZE, BY END-USE INDUSTRY, 2021–2026 (KILOTON)
9.2.8 MALAYSIA
9.2.8.1 Fastest-growing powder coatings markets in Asia Pacific
TABLE 119 MALAYSIA: POWDER COATINGS MARKET SIZE, BY RESIN TYPE, 2017–2020 (USD MILLION)
TABLE 120 MALAYSIA: MARKET SIZE, BY RESIN TYPE, 2021–2026 (USD MILLION)
TABLE 121 MALAYSIA: MARKET SIZE, BY RESIN TYPE, 2017–2020 (KILOTON)
TABLE 122 MALAYSIA: MARKET SIZE, BY RESIN TYPE, 2021–2026 (KILOTON)
TABLE 123 MALAYSIA: MARKET SIZE, BY END-USE INDUSTRY, 2017–2020 (USD MILLION)
TABLE 124 MALAYSIA: MARKET SIZE, BY END-USE INDUSTRY, 2021–2026 (USD MILLION)
TABLE 125 MALAYSIA: MARKET SIZE, BY END-USE INDUSTRY, 2017–2020 (KILOTON)
TABLE 126 MALAYSIA: MARKET SIZE, BY END-USE INDUSTRY, 2021–2026 (KILOTON)
9.2.9 AUSTRALIA & NEW ZEALAND
9.2.9.1 Construction industry driving powder coatings market
9.2.10 REST OF ASIA PACIFIC
9.3 EUROPE
9.3.1 IMPACT OF COVID-19 ON EUROPE
FIGURE 43 EUROPE: POWDER COATINGS MARKET SNAPSHOT
TABLE 127 EUROPE: MARKET SIZE, BY COUNTRY, 2017–2020 (USD MILLION)
TABLE 128 EUROPE: MARKET SIZE, BY COUNTRY, 2021–2026 (USD MILLION)
TABLE 129 EUROPE: MARKET SIZE, BY COUNTRY, 2017–2020 (KILOTON)
TABLE 130 EUROPE: MARKET SIZE, BY COUNTRY, 2021–2026 (KILOTON)
TABLE 131 EUROPE: MARKET SIZE, BY RESIN TYPE, 2017–2020 (USD MILLION)
TABLE 132 EUROPE: MARKET SIZE, BY RESIN TYPE, 2021–2026 (USD MILLION)
TABLE 133 EUROPE: MARKET SIZE, BY RESIN TYPE, 2017–2020 (KILOTON)
TABLE 134 EUROPE: MARKET SIZE, BY RESIN TYPE, 2021–2026 (KILOTON)
TABLE 135 EUROPE: MARKET SIZE, BY END-USE INDUSTRY, 2017–2020 (USD MILLION)
TABLE 136 EUROPE: MARKET SIZE, BY END-USE INDUSTRY, 2021–2026 (USD MILLION)
TABLE 137 EUROPE:MARKET SIZE, BY END-USE INDUSTRY, 2017–2020 (KILOTON)
TABLE 138 EUROPE: MARKET SIZE, BY END-USE INDUSTRY, 2021–2026 (KILOTON)
9.3.2 RUSSIA
9.3.2.1 Continuous growth in construction industry to increase demand for powder coatings
TABLE 139 RUSSIA: POWDER COATINGS MARKET SIZE, BY RESIN TYPE, 2017–2020 (USD MILLION)
TABLE 140 RUSSIA: MARKET SIZE, BY RESIN TYPE, 2021–2026 (USD MILLION)
TABLE 141 RUSSIA: MARKET SIZE, BY RESIN TYPE, 2017–2020 (KILOTON)
TABLE 142 RUSSIA:MARKET SIZE, BY RESIN TYPE, 2021–2026 (KILOTON)
TABLE 143 RUSSIA: MARKET SIZE, BY END-USE INDUSTRY, 2017–2020 (USD MILLION)
TABLE 144 RUSSIA: MARKET SIZE, BY END-USE INDUSTRY, 2021–2026 (USD MILLION)
TABLE 145 RUSSIA: MARKET SIZE, BY END-USE INDUSTRY, 2017–2020 (KILOTON)
TABLE 146 RUSSIA: MARKET SIZE, BY END-USE INDUSTRY, 2021–2026 (KILOTON)
9.3.3 GERMANY
9.3.3.1 Growth in construction sector expected to drive market
TABLE 147 GERMANY: POWDER COATINGS MARKET SIZE, BY RESIN TYPE, 2017–2020 (USD MILLION)
TABLE 148 GERMANY: MARKET SIZE, BY RESIN TYPE, 2021–2026 (USD MILLION)
TABLE 149 GERMANY: MARKET SIZE, BY RESIN TYPE, 2017–2020 (KILOTON)
TABLE 150 GERMANY: MARKET SIZE, BY RESIN TYPE, 2021–2026 (KILOTON)
TABLE 151 GERMANY: MARKET SIZE, BY END-USE INDUSTRY, 2017–2020 (USD MILLION)
TABLE 152 GERMANY: MARKET SIZE, BY END-USE INDUSTRY, 2021–2026 (USD MILLION)
TABLE 153 GERMANY: MARKET SIZE, BY END-USE INDUSTRY, 2017–2020 (KILOTON)
TABLE 154 GERMANY: MARKET SIZE, BY END-USE INDUSTRY, 2021–2026 (KILOTON)
9.3.4 ITALY
9.3.4.1 Construction industry plays major role in growth of powder coatings market
TABLE 155 ITALY: POWDER COATINGS MARKET SIZE, BY RESIN TYPE, 2017–2020 (USD MILLION)
TABLE 156 ITALY: MARKET SIZE, BY RESIN TYPE, 2021–2026 (USD MILLION)
TABLE 157 ITALY: MARKET SIZE, BY RESIN TYPE, 2017–2020 (KILOTON)
TABLE 158 ITALY: MARKET SIZE, BY RESIN TYPE, 2021–2026 (KILOTON)
TABLE 159 ITALY: MARKET SIZE, BY END-USE INDUSTRY, 2017–2020 (USD MILLION)
TABLE 160 ITALY: MARKET SIZE, BY END-USE INDUSTRY, 2021–2026 (USD MILLION)
TABLE 161 ITALY: MARKET SIZE, BY END-USE INDUSTRY, 2017–2020 (KILOTON)
TABLE 162 ITALY: MARKET SIZE, BY END-USE INDUSTRY, 2021–2026 (KILOTON)
9.3.5 FRANCE
9.3.5.1 Government investments in housing, transport, energy, and tourism infrastructure boost the market
TABLE 163 FRANCE: POWDER COATINGS MARKET SIZE, BY RESIN TYPE, 2017–2020 (USD MILLION)
TABLE 164 FRANCE: MARKET SIZE, BY RESIN TYPE, 2021–2026 (USD MILLION)
TABLE 165 FRANCE: MARKET SIZE, BY RESIN TYPE, 2017–2020 (KILOTON)
TABLE 166 FRANCE: MARKET SIZE, BY RESIN TYPE, 2021–2026 (KILOTON)
TABLE 167 FRANCE: MARKET SIZE, BY END-USE INDUSTRY, 2017–2020 (USD MILLION)
TABLE 168 FRANCE: MARKET SIZE, BY END-USE INDUSTRY, 2021–2026 (USD MILLION)
TABLE 169 FRANCE: MARKET SIZE, BY END-USE INDUSTRY, 2017–2020 (KILOTON)
TABLE 170 FRANCE: MARKET SIZE, BY END-USE INDUSTRY, 2021–2026 (KILOTON)
9.3.6 UK
9.3.6.1 Economic growth, increase in consumer spending, and rising competition drives demand
TABLE 171 UK: POWDER COATINGS MARKET SIZE, BY RESIN TYPE, 2017–2020 (USD MILLION)
TABLE 172 UK: MARKET SIZE, BY RESIN TYPE, 2021–2026 (USD MILLION)
TABLE 173 UK: MARKET SIZE, BY RESIN TYPE, 2017–2020 (KILOTON)
TABLE 174 UK: MARKET SIZE, BY RESIN TYPE, 2021–2026 (KILOTON)
TABLE 175 UK: MARKET SIZE, BY END-USE INDUSTRY, 2017–2020 (USD MILLION)
TABLE 176 UK: MARKET SIZE, BY END-USE INDUSTRY, 2021–2026 (USD MILLION)
TABLE 177 UK: MARKET SIZE, BY END-USE INDUSTRY, 2017–2020 (KILOTON)
TABLE 178 UK: MARKET SIZE, BY END-USE INDUSTRY, 2021–2026 (KILOTON)
9.3.7 SPAIN
9.3.7.1 Recovering economy, rising domestic demand, and increasing consumer spending expected to drive demand
TABLE 179 SPAIN: POWDER COATINGS MARKET SIZE, BY RESIN TYPE, 2017–2020 (USD MILLION)
TABLE 180 SPAIN: MARKET SIZE, BY RESIN TYPE, 2021–2026 (USD MILLION)
TABLE 181 SPAIN: MARKET SIZE, BY RESIN TYPE, 2017–2020 (KILOTON)
TABLE 182 SPAIN: MARKET SIZE, BY RESIN TYPE, 2021–2026 (KILOTON)
TABLE 183 SPAIN: MARKET SIZE, BY END-USE INDUSTRY, 2017–2020 (USD MILLION)
TABLE 184 SPAIN: MARKET SIZE, BY END-USE INDUSTRY, 2021–2026 (USD MILLION)
TABLE 185 SPAIN: MARKET SIZE, BY END-USE INDUSTRY, 2017–2020 (KILOTON)
TABLE 186 SPAIN: MARKET SIZE, BY END-USE INDUSTRY, 2021–2026 (KILOTON)
9.3.8 TURKEY
9.3.8.1 Turkey is a booming and highly attractive market for powder coatings
TABLE 187 TURKEY: POWDER COATINGS MARKET SIZE, BY RESIN TYPE, 2017–2020 (USD MILLION)
TABLE 188 TURKEY: MARKET SIZE, BY RESIN TYPE, 2021–2026 (USD MILLION)
TABLE 189 TURKEY: MARKET SIZE, BY RESIN TYPE, 2017–2020 (KILOTON)
TABLE 190 TURKEY: MARKET SIZE, BY RESIN TYPE, 2021–2026 (KILOTON)
TABLE 191 TURKEY: MARKET SIZE, BY END-USE INDUSTRY, 2017–2020 (USD MILLION)
TABLE 192 TURKEY:MARKET SIZE, BY END-USE INDUSTRY, 2021–2026 (USD MILLION)
TABLE 193 TURKEY: MARKET SIZE, BY END-USE INDUSTRY, 2017–2020 (KILOTON)
TABLE 194 TURKEY: MARKET SIZE, BY END-USE INDUSTRY, 2021–2026 (KILOTON)
9.3.9 POLAND
9.3.9.1 Appliances is fastest-growing end-use industry in Poland
9.3.10 NETHERLANDS
9.3.10.1 Netherlands is one of largest producers and distributors of oil & natural gas
9.3.11 SWEDEN
9.3.11.1 New infrastructural projects to drive market for powder coating in Sweden
9.3.12 BELGIUM
9.3.12.1 Institutional construction will increase demand for powder coatings in Belgium
9.3.13 REST OF EUROPE
9.4 NORTH AMERICA
FIGURE 44 NORTH AMERICA: POWDER COATINGS MARKET SNAPSHOT
TABLE 195 NORTH AMERICA: MARKET SIZE, BY COUNTRY, 2017–2020 (USD MILLION)
TABLE 196 NORTH AMERICA:MARKET SIZE, BY COUNTRY, 2021–2026 (USD MILLION)
TABLE 197 NORTH AMERICA: MARKET SIZE, BY COUNTRY, 2017–2020 (KILOTON)
TABLE 198 NORTH AMERICA: MARKET SIZE, BY COUNTRY, 2021–2026 (KILOTON)
TABLE 199 NORTH AMERICA: MARKET SIZE, BY RESIN TYPE, 2017–2020 (USD MILLION)
TABLE 200 NORTH AMERICA: MARKET SIZE, BY RESIN TYPE, 2021–2026 (USD MILLION)
TABLE 201 NORTH AMERICA: MARKET SIZE, BY RESIN TYPE, 2017–2020 (KILOTON)
TABLE 202 NORTH AMERICA: MARKET SIZE, BY RESIN TYPE, 2021–2026 (KILOTON)
TABLE 203 NORTH AMERICA: MARKET SIZE, BY END-USE INDUSTRY, 2017–2020 (USD MILLION)
TABLE 204 NORTH AMERICA: MARKET SIZE, BY END-USE INDUSTRY, 2021–2026 (USD MILLION)
TABLE 205 NORTH AMERICA: MARKET SIZE, BY END-USE INDUSTRY, 2017–2020 (KILOTON)
TABLE 206 NORTH AMERICA: MARKET SIZE, BY END-USE INDUSTRY, 2021–2026 (KILOTON)
9.4.1 US
9.4.1.1 US accounts for largest share of the region’s powder coatings market
TABLE 207 US: POWDER COATINGS MARKET SIZE, BY RESIN TYPE, 2017–2020 (USD MILLION)
TABLE 208 US: MARKET SIZE, BY RESIN TYPE, 2021–2026 (USD MILLION)
TABLE 209 US: MARKET SIZE, BY RESIN TYPE, 2017–2020 (KILOTON)
TABLE 210 US: MARKET SIZE, BY RESIN TYPE, 2021–2026 (KILOTON)
TABLE 211 US: MARKET SIZE, BY END-USE INDUSTRY, 2017–2020 (USD MILLION)
TABLE 212 US: MARKET SIZE, BY END-USE INDUSTRY, 2021–2026 (USD MILLION)
TABLE 213 US: MARKET SIZE, BY END-USE INDUSTRY, 2017–2020 (KILOTON)
TABLE 214 US: MARKET SIZE, BY END-USE INDUSTRY, 2021–2026 (KILOTON)
9.4.2 CANADA
9.4.2.1 Furniture industry likely to increase demand for powder coatings during forecast period
TABLE 215 CANADA: POWDER COATINGS MARKET SIZE, BY RESIN TYPE, 2017–2020 (USD MILLION)
TABLE 216 CANADA: MARKET SIZE, BY RESIN TYPE, 2021–2026 (USD MILLION)
TABLE 217 CANADA: MARKET SIZE, BY RESIN TYPE, 2017–2020 (KILOTON)
TABLE 218 CANADA: MARKET SIZE, BY RESIN TYPE, 2021–2026 (KILOTON)
TABLE 219 CANADA:MARKET SIZE, BY END-USE INDUSTRY, 2017–2020 (USD MILLION)
TABLE 220 CANADA: MARKET SIZE, BY END-USE INDUSTRY, 2021–2026 (USD MILLION)
TABLE 221 CANADA: MARKET SIZE, BY END-USE INDUSTRY, 2017–2020 (KILOTON)
TABLE 222 CANADA: MARKET SIZE, BY END-USE INDUSTRY, 2021–2026 (KILOTON)
9.4.3 MEXICO
9.4.3.1 Construction industry expected to be driven by investments in infrastructure, energy, and commercial construction projects
TABLE 223 MEXICO: POWDER COATINGS MARKET SIZE, BY RESIN TYPE, 2017–2020 (USD MILLION)
TABLE 224 MEXICO: MARKET SIZE, BY RESIN TYPE, 2021–2026 (USD MILLION)
TABLE 225 MEXICO: MARKET SIZE, BY RESIN TYPE, 2017–2020 (KILOTON)
TABLE 226 MEXICO: MARKET SIZE, BY RESIN TYPE, 2021–2026 (KILOTON)
TABLE 227 MEXICO: MARKET SIZE, BY END-USE INDUSTRY, 2017–2020 (USD MILLION)
TABLE 228 MEXICO: MARKET SIZE, BY END-USE INDUSTRY, 2021–2026 (USD MILLION)
TABLE 229 MEXICO: MARKET SIZE, BY END-USE INDUSTRY, 2017–2020 (KILOTON)
TABLE 230 MEXICO: MARKET SIZE, BY END-USE INDUSTRY, 2021–2026 (KILOTON)
9.5 MIDDLE EAST & AFRICA
9.5.1 COVID-19 IMPACT ON MIDDLE EAST & AFRICA
TABLE 231 MIDDLE EAST & AFRICA: POWDER COATINGS MARKET SIZE, BY COUNTRY, 2017–2020 (USD MILLION)
TABLE 232 MIDDLE EAST & AFRICA: MARKET SIZE, BY COUNTRY, 2021–2026 (USD MILLION)
TABLE 233 MIDDLE EAST & AFRICA: MARKET SIZE, BY COUNTRY, 2017–2020 (KILOTON)
TABLE 234 MIDDLE EAST & AFRICA:MARKET SIZE, BY COUNTRY, 2021–2026 (KILOTON)
TABLE 235 MIDDLE EAST & AFRICA: MARKET SIZE, BY RESIN TYPE, 2017–2020 (USD MILLION)
TABLE 236 MIDDLE EAST & AFRICA: MARKET SIZE, BY RESIN TYPE, 2021–2026 (USD MILLION)
TABLE 237 MIDDLE EAST & AFRICA: MARKET SIZE, BY RESIN TYPE, 2017–2020 (KILOTON)
TABLE 238 MIDDLE EAST & AFRICA: MARKET SIZE, BY RESIN TYPE, 2021–2026 (KILOTON)
TABLE 239 MIDDLE EAST & AFRICA: MARKET SIZE, BY END-USE INDUSTRY, 2017–2020 (USD MILLION)
TABLE 240 MIDDLE EAST & AFRICA: MARKET SIZE, BY END-USE INDUSTRY, 2021–2026 (USD MILLION)
TABLE 241 MIDDLE EAST & AFRICA: MARKET SIZE, BY END-USE INDUSTRY, 2017–2020 (KILOTON)
TABLE 242 MIDDLE EAST & AFRICA: MARKET SIZE, BY END-USE INDUSTRY, 2021–2026 (KILOTON)
9.5.2 SAUDI ARABIA
9.5.2.1 Automotive industry to drive market for powder coatings in Saudi Arabia
9.5.3 IRAN
9.5.3.1 Appliances is largest and fastest-growing end-use industry
9.5.4 IRAQ
9.5.4.1 New construction projects will drive market for powder coatings in Iraq
9.5.5 UAE
9.5.5.1 Developments in ongoing projects will increase demand for powder coatings
9.5.6 SOUTH AFRICA
9.5.6.1 Abundant natural resources and government spending in different industries are expected to improve GDP
9.5.7 REST OF MIDDLE EAST
9.6 SOUTH AMERICA
9.6.1 IMPACT OF COVID-19 ON SOUTH AMERICA
TABLE 243 SOUTH AMERICA: POWDER COATINGS MARKET SIZE, BY COUNTRY, 2017–2020 (USD MILLION)
TABLE 244 SOUTH AMERICA: MARKET SIZE, BY COUNTRY, 2021–2026 (USD MILLION)
TABLE 245 SOUTH AMERICA: MARKET SIZE, BY COUNTRY, 2017–2020 (KILOTON)
TABLE 246 SOUTH AMERICA: MARKET SIZE, BY COUNTRY, 2021–2026 (KILOTON)
TABLE 247 SOUTH AMERICA: MARKET SIZE, BY RESIN TYPE, 2017–2020 (USD MILLION)
TABLE 248 SOUTH AMERICA: MARKET SIZE, BY RESIN TYPE, 2021–2026 (USD MILLION)
TABLE 249 SOUTH AMERICA:MARKET SIZE, BY RESIN TYPE, 2017–2020 (KILOTON)
TABLE 250 SOUTH AMERICA: MARKET SIZE, BY RESIN TYPE, 2021–2026 (KILOTON)
TABLE 251 SOUTH AMERICA: MARKET SIZE, BY END-USE INDUSTRY, 2017–2020 (USD MILLION)
TABLE 252 SOUTH AMERICA: MARKET SIZE, BY END-USE INDUSTRY, 2021–2026 (USD MILLION)
TABLE 253 SOUTH AMERICA: MARKET SIZE, BY END-USE INDUSTRY, 2017–2020 (KILOTON)
TABLE 254 SOUTH AMERICA: MARKET SIZE, BY END-USE INDUSTRY, 2021–2026 (KILOTON)
9.6.2 BRAZIL
9.6.2.1 One of the largest emerging economies and a major automotive market
TABLE 255 BRAZIL: POWDER COATINGS MARKET SIZE, BY RESIN TYPE, 2017–2020 (USD MILLION)
TABLE 256 BRAZIL: MARKET SIZE, BY RESIN TYPE, 2021–2026 (USD MILLION)
TABLE 257 BRAZIL: MARKET SIZE, BY RESIN TYPE, 2017–2020 (KILOTON)
TABLE 258 BRAZIL: MARKET SIZE, BY RESIN TYPE, 2021–2026 (KILOTON)
TABLE 259 BRAZIL: MARKET SIZE, BY END-USE INDUSTRY, 2017–2020 (USD MILLION)
TABLE 260 BRAZIL: MARKET SIZE, BY END-USE INDUSTRY, 2021–2026 (USD MILLION)
TABLE 261 BRAZIL: MARKET SIZE, BY END-USE INDUSTRY, 2017–2020 (KILOTON)
TABLE 262 BRAZIL: MARKET SIZE, BY END-USE INDUSTRY, 2021–2026 (KILOTON)
9.6.3 ARGENTINA
9.6.3.1 Increasing population and improved economic conditions expected
TABLE 263 ARGENTINA: POWDER COATINGS MARKET SIZE, BY RESIN TYPE, 2017–2020 (USD MILLION)
TABLE 264 ARGENTINA: MARKET SIZE, BY RESIN TYPE, 2021–2026 (USD MILLION)
TABLE 265 ARGENTINA: MARKET SIZE, BY RESIN TYPE, 2017–2020 (KILOTON)
TABLE 266 ARGENTINA: MARKET SIZE, BY RESIN TYPE, 2021–2026 (KILOTON)
TABLE 267 ARGENTINA: MARKET SIZE, BY END-USE INDUSTRY, 2017–2020 (USD MILLION)
TABLE 268 ARGENTINA: MARKET SIZE, BY END-USE INDUSTRY, 2021–2026 (USD MILLION)
TABLE 269 ARGENTINA: MARKET SIZE, BY END-USE INDUSTRY, 2017–2020 (KILOTON)
TABLE 270 ARGENTINA: MARKET SIZE, BY END-USE INDUSTRY, 2021–2026 (KILOTON)
9.6.4 COLOMBIA
9.6.4.1 Fourth-biggest automotive manufacturer in the region
TABLE 271 COLOMBIA: POWDER COATINGS MARKET SIZE, BY RESIN TYPE, 2017–2020 (USD MILLION)
TABLE 272 COLOMBIA: MARKET SIZE, BY RESIN TYPE, 2021–2026 (USD MILLION)
TABLE 273 COLOMBIA:MARKET SIZE, BY RESIN TYPE, 2017–2020 (KILOTON)
TABLE 274 COLOMBIA: MARKET SIZE, BY RESIN TYPE, 2021–2026 (KILOTON)
TABLE 275 COLOMBIA: MARKET SIZE, BY END-USE INDUSTRY, 2017–2020 (USD MILLION)
TABLE 276 COLOMBIA: MARKET SIZE, BY END-USE INDUSTRY, 2021–2026 (USD MILLION)
TABLE 277 COLOMBIA: MARKET SIZE, BY END-USE INDUSTRY, 2017–2020 (KILOTON)
TABLE 278 COLOMBIA: MARKET SIZE, BY END-USE INDUSTRY, 2021–2026 (KILOTON)
9.6.5 CHILE
9.6.5.1 Economic recovery and government investments in infrastructure and residential construction
9.6.6 REST OF SOUTH AMERICA
10 COMPETITIVE LANDSCAPE (Page No. - 287)
10.1 OVERVIEW
10.1.1 OVERVIEW OF STRATEGIES ADOPTED BY KEY POWDER COATINGS PLAYERS
10.2 COMPANY EVALUATION QUADRANT MATRIX: DEFINITION AND METHODOLOGY, 2020
10.2.1 STARS
10.2.2 EMERGING LEADERS
10.2.3 PERVASIVE
10.2.4 EMERGING COMPANIES
FIGURE 45 POWDER COATINGS MARKET (GLOBAL): COMPETITIVE LEADERSHIP MAPPING, 2020
10.3 SME MATRIX, 2020
10.3.1 RESPONSIVE COMPANIES
10.3.2 PROGRESSIVE COMPANIES
10.3.3 STARTING BLOCKS
10.3.4 DYNAMIC COMPANIES
FIGURE 46 POWDER COATINGS MARKET: SMALL AND MEDIUM-SIZED ENTERPRISES COMPANIES COMPETITIVE LEADERSHIP MAPPING, 2020
10.4 COMPETITIVE SCENARIO
TABLE 279 PRODUCT FOOTPRINT OF COMPANIES
TABLE 280 INDUSTRY FOOTPRINT OF COMPANIES
TABLE 281 REGIONAL FOOTPRINT OF COMPANIES
10.4.1 MARKET EVALUATION MATRIX
TABLE 282 STRATEGIC DEVELOPMENTS, BY COMPANY
TABLE 283 MOST FOLLOWED STRATEGIES
TABLE 284 GROWTH STRATEGIES ADOPTED BY KEY COMPANIES
10.5 POWDER COATINGS MARKET SHARE ANALYSIS
FIGURE 47 MARKET SHARE ANALYSIS, 2020
10.6 REVENUE ANALYSIS
FIGURE 48 REVENUE ANALYSIS OF TOP PLAYERS, 2016–2020
10.6.1 PPG
10.6.2 AKZONOBEL
10.6.3 AXALTA
10.6.4 SHERWIN-WILLIAMS COMPANY
10.6.5 TIGER COATINGS
10.6.6 JOTUN A/S (NORWAY)
10.7 MARKET RANKING ANALYSIS
TABLE 285 MARKET RANKING ANALYSIS 2020
10.7.1 COMPETITIVE SITUATION AND TRENDS
TABLE 286 POWDER COATINGS MARKET: PRODUCT LAUNCHES, 2016–2021
TABLE 287 MARKET: DEALS, 2016–2021
11 COMPANY PROFILE (Page No. - 311)
11.1 MAJOR PLAYERS
(Business Overview, Products/Services/Solutions Offered, MnM View, Key Strengths and Right to Win, Strategic Choices Made, Weaknesses and Competitive Threats, Recent Developments)*
11.1.1 PPG INDUSTRIES, INC.
TABLE 288 PPG INDUSTRIES, INC.: BUSINESS OVERVIEW
FIGURE 49 PPG INDUSTRIES, INC.: COMPANY SNAPSHOT
TABLE 289 PPG INDUSTRIES, INC.: PRODUCT LAUNCHES
TABLE 290 PPG INDUSTRIES, INC.: DEALS
11.1.2 THE SHERWIN-WILLIAMS COMPANY
TABLE 291 THE SHERWIN-WILLIAMS COMPANY: BUSINESS OVERVIEW
FIGURE 50 THE SHERWIN-WILLIAMS COMPANY: COMPANY SNAPSHOT
TABLE 292 THE SHERWIN-WILLIAMS COMPANY: DEALS
TABLE 293 THE SHERWIN-WILLIAMS COMPANY: PRODUCT LAUNCHES
11.1.3 AKZONOBEL N.V.
TABLE 294 AKZONOBEL N.V.: BUSINESS OVERVIEW
FIGURE 51 AKZONOBEL N.V.: COMPANY SNAPSHOT
TABLE 295 AKZONOBEL N.V.: PRODUCT LAUNCHES
TABLE 296 AKZONOBEL N.V.: DEALS
11.1.4 AXALTA COATING SYSTEMS
TABLE 297 AXALTA COATING SYSTEMS: BUSINESS OVERVIEW
FIGURE 52 AXALTA COATING SYSTEMS, LLC: COMPANY SNAPSHOT
TABLE 298 AXALTA COATING SYSTEMS: PRODUCT LAUNCHES
TABLE 299 AXALTA COATING SYSTEMS: DEALS
11.1.5 TIGER COATINGS GMBH & CO. KG
TABLE 300 TIGER COATINGS GMBH & CO. KG: BUSINESS OVERVIEW
11.1.6 JOTUN A/S
TABLE 301 JOTUN A/S: BUSINESS OVERVIEW
FIGURE 53 JOTUN A/S: COMPANY SNAPSHOT
TABLE 302 JOTUN A/S: PRODUCT LAUNCHES
TABLE 303 JOTUN A/S: DEALS
11.1.7 ASIAN PAINTS LIMITED
TABLE 304 ASIAN PAINTS LIMITED: BUSINESS OVERVIEW
FIGURE 54 ASIAN PAINTS LIMITED: COMPANY SNAPSHOT
11.1.8 NIPPON PAINTS HOLDINGS CO., LTD.
TABLE 305 NIPPON PAINTS HOLDINGS CO., LTD.: BUSINESS OVERVIEW
FIGURE 55 NIPPON PAINT HOLDINGS CO., LTD.: COMPANY SNAPSHOT
TABLE 306 NIPPON PAINTS HOLDINGS CO., LTD.: DEALS
11.1.9 PROTECH GROUP
TABLE 307 PROTECH GROUP: BUSINESS OVERVIEW
TABLE 308 PROTECH GROUP: DEALS
11.1.10 IGP PULVERTECHNIK AG
TABLE 309 IGP PULVERTECHNIK AG: BUSINESS OVERVIEW
TABLE 310 IGP PULVERTECHNIK AG.: DEALS
11.1.11 ANHUI MEIJIA NEW MATERIAL CO., LTD
TABLE 311 ANHUI MEIJIA NEW MATERIAL CO., LTD: BUSINESS OVERVIEW
11.1.12 KANSAI PAINT COMPANY LIMITED
TABLE 312 KANSAI PAINT COMPANY LIMITED: BUSINESS OVERVIEW
FIGURE 56 KANSAI PAINT COMPANY LIMITED: COMPANY SNAPSHOT
11.1.13 RPM INTERNATIONAL INC.
TABLE 313 RPM INTERNATIONAL INC.: BUSINESS OVERVIEW
FIGURE 57 RPM INTERNATIONAL INC.: COMPANY SNAPSHOT
TABLE 314 RPM INTERNATIONAL INC.: DEALS
11.1.14 BERGER PAINTS INDIA LIMITED
TABLE 315 BERGER PAINTS INDIA LIMITED: BUSINESS OVERVIEW
TABLE 316 BERGER PAINTS INDIA LTD.: DEALS
11.1.15 POWDERTECH SURFACE SCIENCE
TABLE 317 POWDERTECH SURFACE SCIENCE: BUSINESS OVERVIEW
11.1.16 SOMAR CORPORATION
TABLE 318 SOMAR CORPORATION: BUSINESS OVERVIEW
11.1.17 CLOVERDALE PAINT INC.
TABLE 319 CLOVERDALE PAINT INC.: BUSINESS OVERVIEW
11.2 OTHER COMPANIES
11.2.1 EMIL FREI GMBH & CO. KG
TABLE 320 EMIL FREI GMBH & CO. KG: BUSINESS OVERVIEW
11.2.2 DIAMOND VOGEL
TABLE 321 DIAMOND VOGEL: BUSINESS OVERVIEW
11.2.3 IFS COATINGS
TABLE 322 IFS COATINGS: BUSINESS OVERVIEW
11.2.4 3M
TABLE 323 3M: BUSINESS OVERVIEW
11.2.5 ERIE POWDER COATINGS INC.
TABLE 324 ERIE POWDER COATINGS INC.: BUSINESS OVERVIEW
11.2.6 KEYLAND POLYMER
TABLE 325 KEYLAND POLYMER: BUSINESS OVERVIEW
11.2.7 PRIMATEK COATINGS OU
TABLE 326 PRIMATEK COATINGS OU: BUSINESS OVERVIEW
11.2.8 CARDINAL
TABLE 327 CARDINAL: BUSINESS OVERVIEW
11.2.9 MODERN SAK FACTORY FOR POWDER PAINT
TABLE 328 MODERN SAK FACTORY FOR POWER PLANT: BUSINESS OVERVIEW
11.2.10 HENTZEN COATINGS, INC.
TABLE 329 HENTEZ COATINGS, INC: BUSINESS OVERVIEW
11.2.11 VITRACOAT
TABLE 330 VITRACOAT: BUSINESS OVERVIEW
11.2.12 WEG
TABLE 331 WEG: BUSINESS OVERVIEW
11.2.13 EUROPOLVERI SPA
TABLE 332 EUROPOLVERI SPA: BUSINESS OVERVIEW
TABLE 333 EUROPOLVERI SPA: DEALS
TABLE 334 EUROPOLVERI SPA: PRODUCT LAUNCHES
11.2.14 PULVERIT S.P.A.
TABLE 335 PULVERIT S.P.A.: BUSINESS OVERVIEW
11.2.15 ST POWDER COATINGS S.P.A.
TABLE 336 ST POWER COATINGS S.P.A.: BUSINESS OVERVIEW
TABLE 337 ST POWER COATINGS S.P.A.: PRODUCT LAUNCHES
TABLE 338 ST POWER COATINGS S.P.A.: DEALS
11.2.16 ÝBA KIMYA A.Þ.
TABLE 339 ÝBA KIMYA A.Þ: BUSINESS OVERVIEW
11.2.17 NEOKEM S.A.
TABLE 340 NEOKEM S.A.: BUSINESS OVERVIEW
11.2.18 TEKNOS GROUP OY
TABLE 341 TEKNOS GROUP OY: BUSINESS OVERVIEW
TABLE 342 TEKNOS GROUP OY: DEALS
11.2.19 KARL WÖRWAG LACK- UND FARBENFABRIK GMBH & CO. KG
TABLE 343 KARL WÖRWAG LACK- UND FARBENFABRIK GMBH & CO. KG: BUSINESS OVERVIEW
11.2.20 ARSONSISI S.P.A.
TABLE 344 ARSONSISI S.P.A: BUSINESS OVERVIEW
11.2.21 KCC CORPORATION
TABLE 345 KCC CORPORATION: BUSINESS OVERVIEW
11.2.22 CWS POWDER COATINGS GMBH
TABLE 346 CWS POWDER COATINGS GMBH: BUSINESS OVERVIEW
TABLE 347 CWS POWDER COATINGS: DEALS
11.2.23 PULVER KIMYA SAN. VE TIC. A.Þ.
TABLE 348 PULVER KIMYA SAN. VE TIC. A.Þ.: BUSINESS OVERVIEW
*Business Overview, Products/Services/Solutions Offered, MnM View, Key Strengths and Right to Win, Strategic Choices Made, Weaknesses and Competitive Threats, Recent Developments might not be captured in case of unlisted companies.
12 APPENDIX (Page No. - 402)
12.1 DISCUSSION GUIDE
12.2 KNOWLEDGE STORE: MARKETSANDMARKETS SUBSCRIPTION PORTAL
12.3 AVAILABLE CUSTOMIZATIONS
12.4 RELATED REPORTS
12.5 AUTHOR DETAILS
The study of global powder coatings market involves the use of extensive secondary sources, directories, and databases such as Hoovers, Bloomberg BusinessWeek, Factiva, ICIS, and OneSource. Exhaustive secondary research was done to collect information on the market, the peer market, and the parent market. The next step was to validate these findings, assumptions, and sizing with industry experts across the value chain through primary research.
Secondary Research
Secondary sources of data include company information from annual reports, press releases, investor presentations, white papers, and articles from recognized authors and databases. In the market engineering process (which includes calculations for market statistics, market breakdown, market size estimations, market forecast, and data triangulation), both top-down and bottom-up approaches have been extensively used, along with several data triangulation methods, to gather, verify, and validate the market figures.
Primary Research
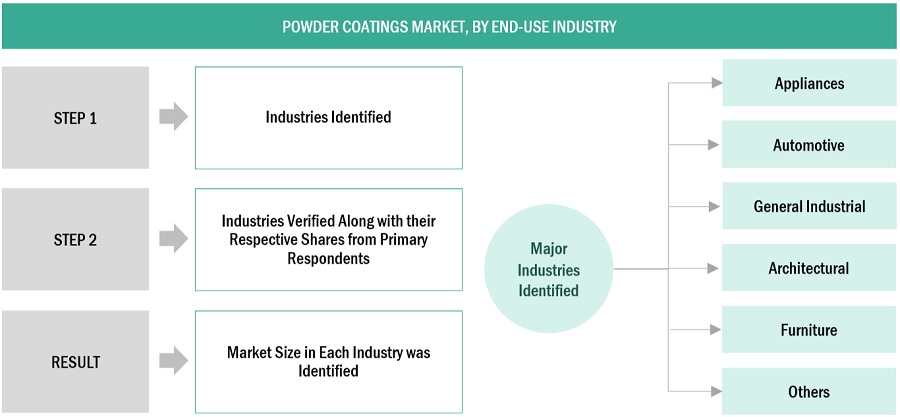
The Powder Coatings market comprises several stakeholders, such as raw material suppliers, processors, end-product manufacturers, and regulatory organizations. The demand side of this market is characterized by the development in end-use industries, such as appliances, automotive, general industrial, architectural, furniture, and others. The supply side is characterized by advancements in technology. Various primary sources from both the supply and demand sides of the market were interviewed to obtain qualitative and quantitative information.
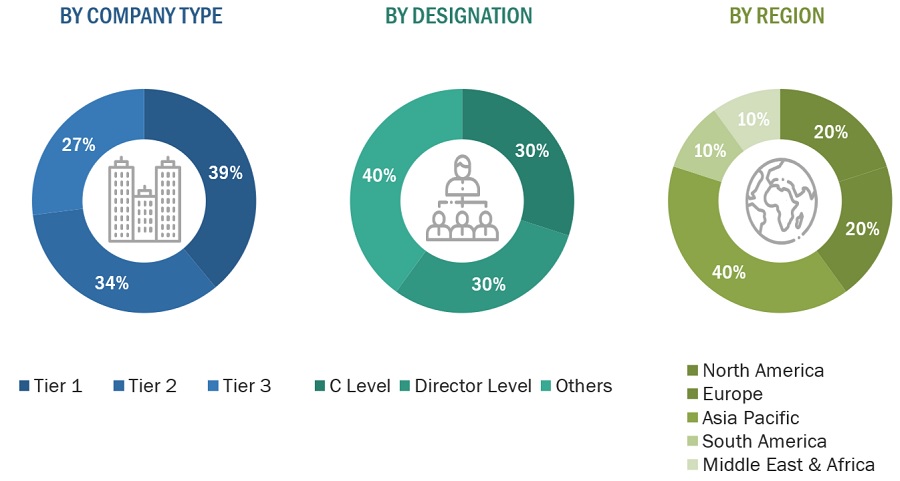
Following is the breakdown of primary respondents:
To know about the assumptions considered for the study, download the pdf brochure
Market Size Estimation
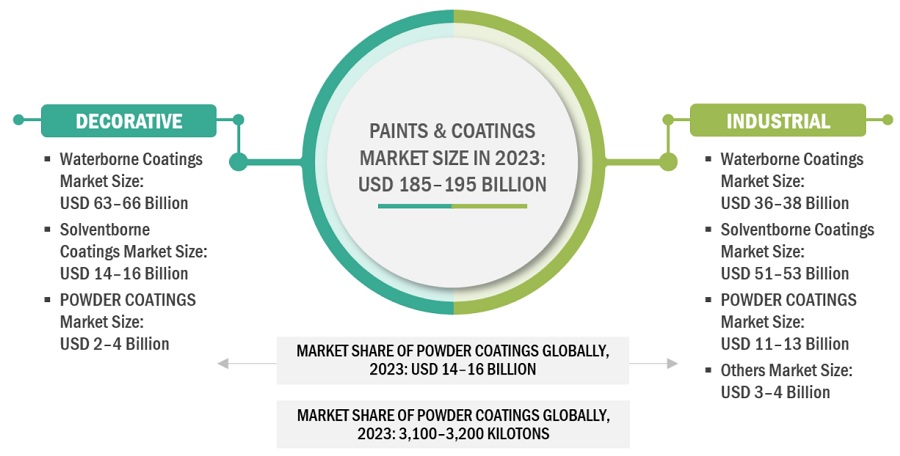
The top-down and bottom-up approaches have been used to estimate and validate the market sizes of Powder coatings for various end-use industries in each region. The research methodology used to estimate the market size includes the following:
- The key players in the market have been identified through extensive secondary research.
- The industry’s supply chain and market size, in terms of value, have been determined through primary and secondary research processes.
- All possible parameters that affect the markets covered in this research study have been accounted for, viewed in extensive detail, verified through primary research, and analyzed to get the final quantitative and qualitative data.
- All percentage shares, splits, and breakdowns have been determined using secondary sources and verified through primary sources.
Global Powder coatings Market Size: Bottom-Up Approach
To know about the assumptions considered for the study, Request for Free Sample Report
Data Triangulation
After arriving at the overall market size—using the market size estimation processes as explained above—the market was split into several segments and sub-segments. To complete the overall market engineering process and arrive at the exact statistics of each market segment and subsegment, the data triangulation, and market breakdown procedures were employed, wherever applicable. The data was triangulated by studying various factors and trends from both the demand and supply sides.
Report Objectives
- To define, describe, and forecast the size of the powder coatings market, in terms of both value (USD million/billion) and volume (Kiloton)
- To provide detailed information about the key factors (drivers, restraints, opportunities, and challenges) influencing the growth of the market
- To forecast the market size by resin type, by coating method, end-use industry, and region
- To forecast the market size with respect to five main regions: North America, Europe, Asia Pacific, Middle East & Africa, and South America
- To analyze the opportunities in the market for stakeholders and provide a competitive landscape for the market leaders
- To analyze competitive developments in the market, such as Joint venture & partnership, Investment & expansion, new product launch and merger & acquisition.
- To strategically profile the key players and comprehensively analyze their market shares.
Available Customizations
MarketsandMarkets offers customizations according to the specific needs of the companies with the given market data.
The following customization options are available for the report:
Product Analysis
- Product matrix, which gives a detailed comparison of the product portfolio of each company
Regional Analysis
- Further breakdown of the market, by country
Company Information
- Detailed analysis and profiling of additional market players (up to five)
Growth opportunities and latent adjacency in Powder Coating Market