
Acrylic Resins Market

Acrylic Resins Market by Chemistry, Property, Solvency, Application, End-use Industry (Building & Construction, Industrial, Paper & Paperboard, Consumer Goods, Electrical & Electronics, and Packaging), and Region � Global Forecast to 2030


OVERVIEW
Source: Secondary Research, Interviews with Experts, MarketsandMarkets Analysis
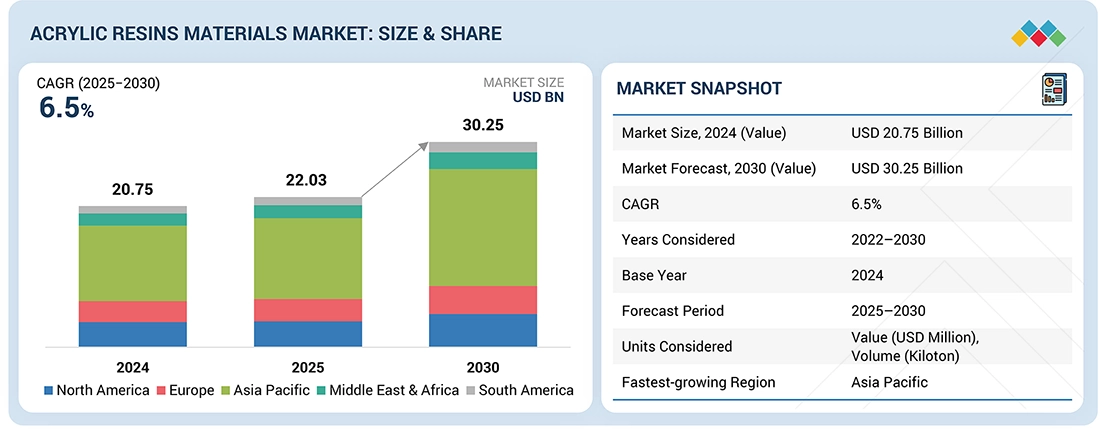
The acrylic resins market is projected to grow from approximately USD 22.03 billion in 2025 to USD 30.25 billion by 2030, registering a CAGR of about 6.5%. Acrylic resins are widely used in paints, coatings, adhesives, sealants, and specialty applications due to their excellent weather and UV resistance, strong adhesion, clarity, and color retention. Rising demand for durable and environmentally friendly coatings in construction, automotive, and industrial sectors is driving market growth. Additionally, stringent regulations on volatile organic compounds (VOCs) are accelerating the adoption of waterborne acrylic resins, creating opportunities for sustainable and high-performance formulations. Growing industrialization and infrastructure development, particularly in emerging economies, are further fueling the expansion of the acrylic resins market.
KEY TAKEAWAYS
-
BY CHEMISTRYThe market is segmented into methacrylates, acrylates, and hybrids, with methacrylates gaining traction due to their high-performance properties and broad adoption in coatings and adhesives.
-
BY PROPERTYThermosetting and thermoplastic resins dominate the market, with thermosetting resins preferred in durable coatings and specialty applications, while thermoplastics are increasingly used in flexible and DIY products.
-
BY SOLVENCYThe market includes solvent-based, water-based, and other solvency types. Water-based acrylics are witnessing faster growth due to environmental regulations and demand for low-VOC products, whereas solvent-based resins remain critical for high-performance industrial applications.
-
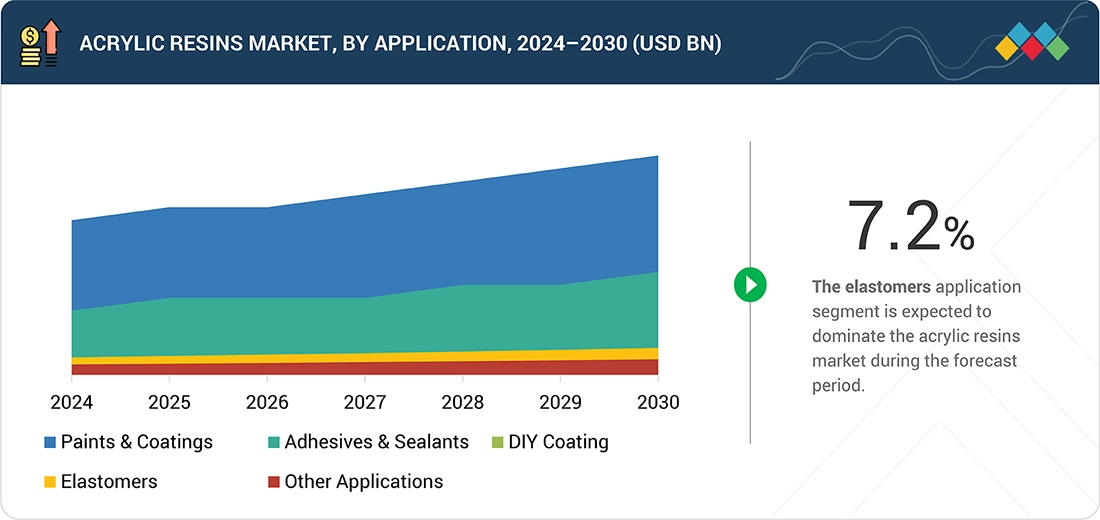
BY APPLICATIONKey applications include paints & coatings, adhesives & sealants, DIY coatings, elastomers, and other applications. Paints & coatings are estimated to account for the largest share, while adhesives and DIY segments are expanding due to growth in construction, automotive, and consumer sectors.
-
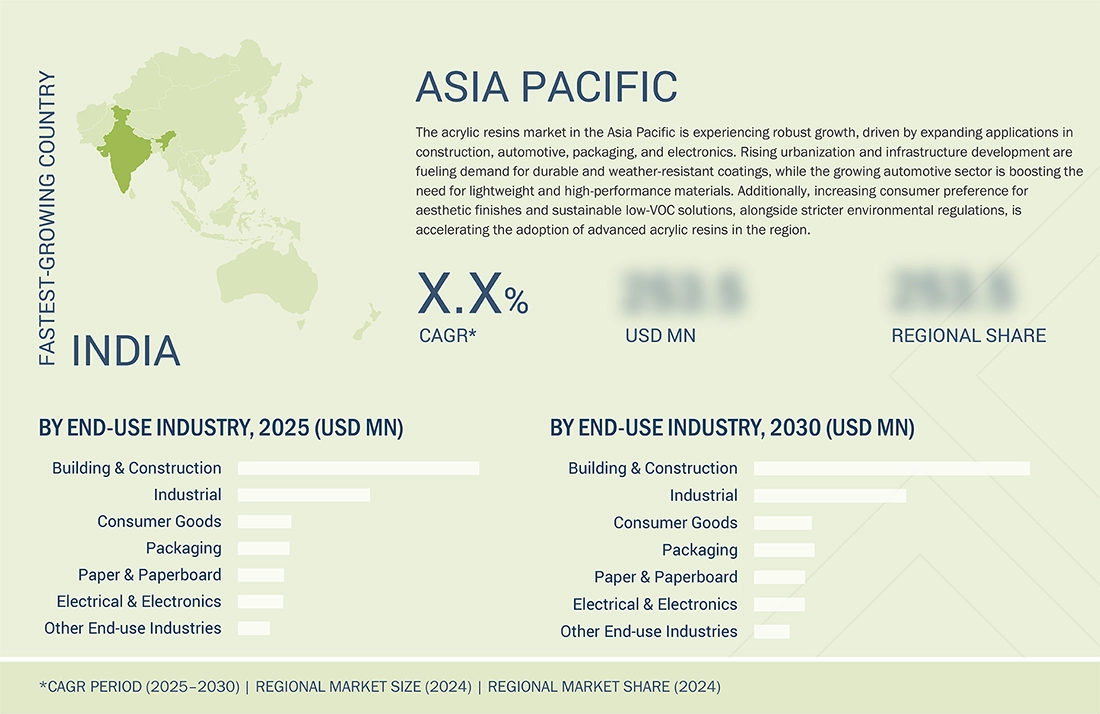
BY END-USE INDUSTRYThe major end-users are Building & Construction, Industrial, Paper & Paperboard, Consumer Goods, Electrical & Electronics, Packaging, and Other End-Use Industries. Building & construction continues to dominate, driven by infrastructure growth and rising demand for high-performance, durable coatings.
-
BY REGIONAcrylic resins are marketed across Europe, North America, the Asia Pacific, South America, and the Middle East & Africa. The Asia Pacific market has the highest share of the entire market due to industrialization, increased infrastructure growth, and automotive production growth in countries such as China, India, and Japan. Europe and North America are also prominent markets owing to high demand for high-performance coatings, stringent environmental regulations mandating low-VOC resins, and rising demand for advanced packaging applications. Several emerging economies in South America, the Middle East, and Africa will promote market growth through growing construction activity and growing demand for consumer goods.
-
COMPETITIVE LANDSCAPEThe market for acrylic resins is fragmented and competitive, with a few dominant players proposed by BASF (Germany), Dow (US), Mitsubishi Chemical Group Corporation (Japan), Sumitomo Chemical Co., Ltd. (Japan), and Arkema (France). Major companies are focusing on natural and inorganic strategies to adopt new growing methods, including expansion of capacity, developing sustainable products, and forming strategic alliances.
The global acrylic resins market was valued at approximately USD 20.75 billion in 2024 and is projected to grow at a CAGR of 6.5% during the forecast period (2025–2030), driven by increasing demand across paints & coatings, adhesives & sealants, and industrial applications. The acrylic resins market is evident of sustained growth as there are increasingly durable, versatile uses for coatings, adhesives, plastics, and packaging. Encourage low-VOC or waterborne alternatives and the sustainability angle could be easily supported by regulations and demand oriented by consumers. New collaborations and developments are disrupting the market; resin suppliers are forming agreements with the end-use market; investments in bio-based and recyclable acrylics and solutions designed to solve high-performance resins with improved weatherability, scratch, and chemical resistance are also taking place.
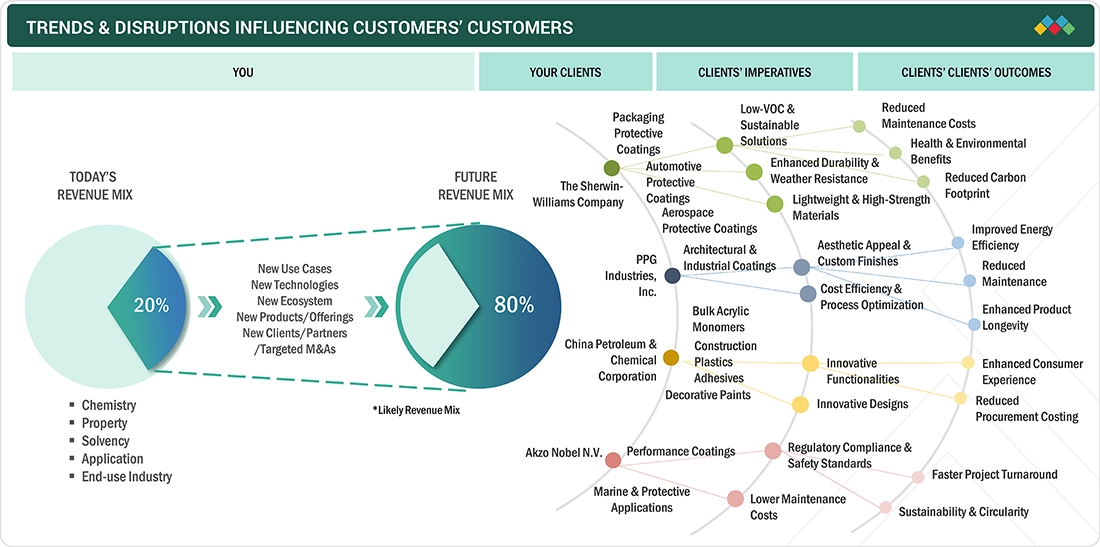
TRENDS & DISRUPTIONS IMPACTING CUSTOMERS' CUSTOMERS
The impact on consumers' businesses in the acrylic resins market emerges from evolving customer trends and disruptions. Hot bets are clients of acrylic resin manufacturers, such as coatings producers, adhesives formulators, and plastics processors, while target applications represent their downstream customers in industries like automotive, construction, packaging, and electronics. Changes such as the transition to low-VOC alternatives, bio-based resins, lighter-weight materials, and newly developed durability specifications will, in turn, directly affect revenue streams for these end users. Changes in revenue for end users will affect the performance of hot bets and revenues for acrylic resin manufacturers.
Source: Secondary Research, Interviews with Experts, MarketsandMarkets Analysis
MARKET DYNAMICS
Level
-
Rising Global Vehicle Production and EV Adoption

-
Increased Infrastructural and Construction Activities

Level
-
Fluctuating Raw Material and Resin Prices Due to Crude Oil Volatility

-
Environmental Concerns over Limited Biodegradability of Acrylic Resins Impacting Disposal Practices

Level
-
Rapid Expansion of Photopolymer and 3D-Printing Resin Applications

-
Expanding Market for Bio-Based and Sustainable Resin Alternatives

Level
-
Stringent Environmental Regulations and Compliance Burdens

Source: Secondary Research, Interviews with Experts, MarketsandMarkets Analysis
Driver: Rising Global Vehicle Production and EV Adoption
A rise in car manufacturing worldwide, notably with the fast acceptance of electric vehicles (EVs), is leading the need for acrylic resins in a very pronounced way. Acrylic resins are used broadly in the automotive industry for applications where acrylic is a high-performance coating and paint for vehicle exteriors and interiors, adhesives and sealants, and lightweight components such as light covers. The unique property aspects include UV resistance, performance, gloss retention, and chemical resistance, making acrylic the material of choice for manufacturing modern vehicles.
Restraint: Fluctuating Raw Material and Resin Prices Due to Crude Oil Volatility
Price consistency is a substantial difficulty for acrylic resin manufacturers. Resin manufacturing relies upon petrochemical monomers sourced from crude oil; resin market pricing will align with the global energy pricing marketplace to some degree. As of January 2023 data, crude product volatility persists since trade continues to be uncertain, along with an ongoing re-evaluation of OPEC+ production policies.
Opportunity: Rapid Expansion of Photopolymer and 3D Printing Resin Applications
The demand has been caused by the more extensive use of high-resolution, long-lasting, and specially made photopolymer resin materials for various industrial and healthcare applications. Advanced manufacturing processes such as stereolithography (SLA), digital light processing (DLP), and continuous liquid interface production (CLIP) have benefitted immensely from these acrylic-based photopolymers. It is encouraging to see advances in biocompatible and biodegradable resin chemistry that are also consistent with the world's sustainability initiatives and garnering regulation by governments and investments by key global stakeholders in North America and the European Union.
Challenge: Stringent Environmental Regulations and Compliance Burdens
Regulatory scrutiny regarding emissions and environmental impacts related to polymer and resin manufacturing processes is increasing; especially in addition to recent, pronounced scrutiny in April 2024 when the U.S. EPA, under the Clean Air Act, issued new rules that will force manufacturers to reduce emissions from ethylene oxide, chloroprene, benzene, vinyl chloride, and 1,3-butadiene, by these manufacturers, up to 80%, from around 200 emissions sources related to resin and chemical manufacturing processes. The new rules also implement fence-line air monitoring and an increase in enforcement. Compliance costs (both direct and indirect) are significant and will be experienced as new compliance costs related to upgrading emission controls and associated monitoring systems, possible modifications of facilities for compliance, and/or parts of plant processes delayed due to these constraints and conditions.
Acrylic Resins Market: COMMERCIAL USE CASES ACROSS INDUSTRIES
| COMPANY | USE CASE DESCRIPTION | BENEFITS |
|---|---|---|
 |
Acronal acrylic binders in architectural paints and roof coatings | Weather and UV resistance, excellent adhesion, extended service life of coatings, reduced maintenance |
 |
AINCOTE AEH-10 Resin, Acrylic resins as film-formers and binders in paints, coatings, and finishes | Durable protection, strong adhesion, resistance to weathering, formulation flexibility with low VOC |
 |
SHINKOLITE PMMA sheets for signage, displays, glazing, and light-guide plates | Outstanding optical clarity, UV/weather resistance, long-life outdoor use, easy fabrication |
 |
Chemically recycled PMMA commercialized for automotive and electronics (customers include Nissan, LG Display) | Circular economy solution, ~50% lower lifecycle emissions, same clarity and durability as virgin PMMA |
 |
Altuglas PMMA resins and sheets in automotive lighting, displays, and signage | High optical performance, scratch and UV resistance, durable, lightweight parts |
Logos and trademarks shown above are the property of their respective owners. Their use here is for informational and illustrative purposes only.
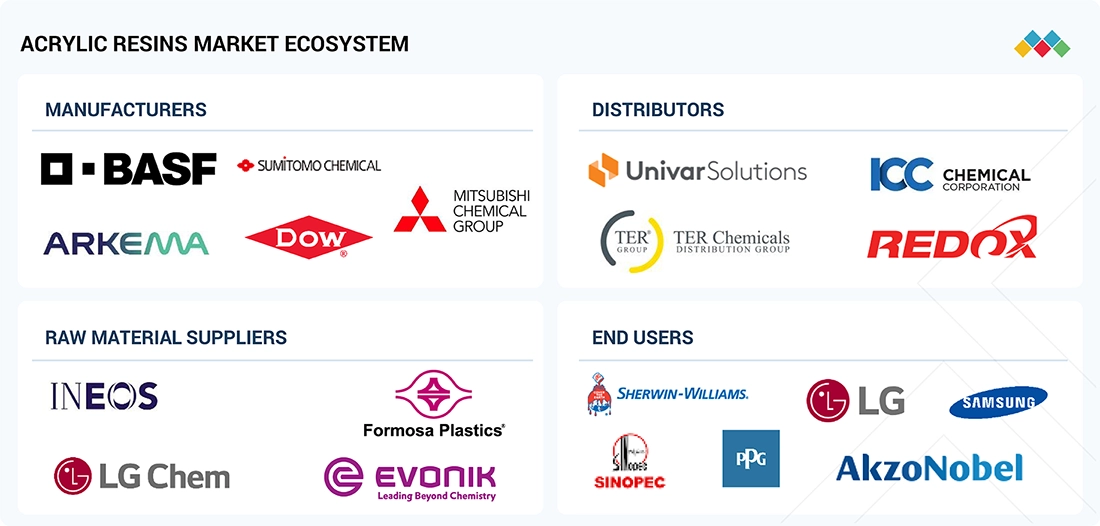
MARKET ECOSYSTEM
Analysis of the acrylic resin market ecosystem indicates a complex web of interconnected stakeholder participants all responsible for the production, distribution, and ultimate use of this versatile polymer. Within the ecosystem lie upstream raw materials suppliers (which include producers of acrylic acid, methacrylic acid, and ester monomers), specialty acrylic resin producers, chemical distributors (global and regional), regulatory agencies, and a range of end-use industries, including paints and coatings, construction, automotive, adhesives, electronics, and consumer. The market's response to raw material price fluctuations, regulatory agency mandates for sustainable alternatives, and ongoing performance introductions and innovations highlights the importance of a relationship-based value chain.
Logos and trademarks shown above are the property of their respective owners. Their use here is for informational and illustrative purposes only.
MARKET SEGMENTS
Source: Secondary Research, Interviews with Experts, MarketsandMarkets Analysis
Acrylic Resins Market, by Chemistry
Methacrylates are projected to be the fastest-growing segment in the acrylic resin market due to their exceptional clarity, weather resistance, and chemical stability, which make them ideal for high-performance applications. These resins enhance durability, adhesion, and UV stability, serving as effective coatings, adhesives, and plastics that maintain both aesthetic quality and functional integrity in harsh environments. This growth is supported by regulatory initiatives promoting low-VOC and environmentally compliant formulations, prompting manufacturers to innovate solvent-based formulations that comply with EU REACH and US EPA Clean Air Act standards. As a result, many companies are shifting towards methacrylate-based resin systems that minimize solvent use while preserving performance.
Acrylic Resins Market, by Property
Thermoplastic acrylic resins are anticipated to see the highest growth rate in the acrylic resin market due to their ease of processing, recyclability, and versatility across applications such as automotive parts, packaging films, and high-performance coatings. Their superior impact resistance and dimensional stability align with the rising demand for lightweight and durable materials in the transportation and electronics sectors. Innovation is enhancing their performance, with improvements in chemical and weather resistance, which opens new opportunities for outdoor structures and consumer goods. Furthermore, their re-processing capabilities contribute to circular economy goals, appealing to industries focused on waste reduction and carbon footprint minimization. As a result, thermoplastic acrylic resins are expected to gain significant market acceptance in both developed and emerging economies.
REGION
Asia Pacific to be Fastest-Growing Region in Global Acrylic Resins Market During Forecast Period
During the forecast period, the Asia Pacific acrylic resins market is set to witness the highest CAGR due to increasing industrialization, urbanization, and demand from end-use industries such as construction, automotive, coatings, and packaging. An increase in the consumption of waterborne and low-VOC acrylic resins in paints, adhesives, and specialty coatings can also be observed in countries like China, India, and Japan, owing to stringent environmental regulations and the green movement. In addition, the growth of infrastructure projects, increased automotive production, and a growing consumer preference for high-performance and durable coatings are contributing to the acrylic resin market growth in the region.
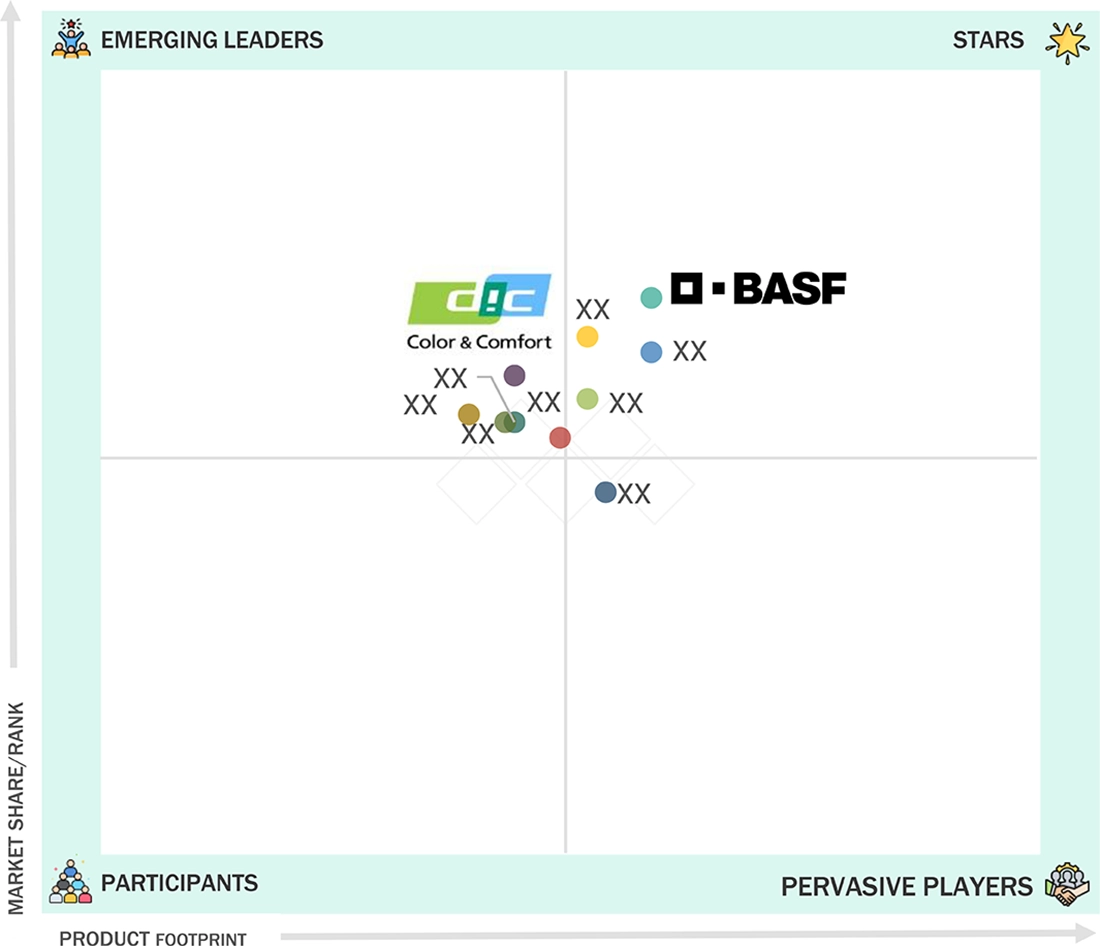
Acrylic Resins Market: COMPANY EVALUATION MATRIX
BASF (Star) is a known and established company that has a full range of products and covers the entire world for the market of acrylic industrial resins. Their high-performance resins are the base for coatings, adhesives, plastics, and industrial applications. DIC Corporation (Emerging Leader) is a company that has been slow but steady in the development of innovative resins and specialty products, and the gradual move to the broadening of its position with more valuable application solutions. Due to its scale, the range of products, and three-tier distribution, BASF is still the top company in acrylic industrial resins. However, DIC has the potential to grow to the leader quadrant if the trend of customer requirements for high-performance, innovative, and sustainable acrylic resins continues.
Source: Secondary Research, Interviews with Experts, MarketsandMarkets Analysis
KEY MARKET PLAYERS
MARKET SCOPE
| REPORT METRIC | DETAILS |
|---|---|
| Market Size, 2024 (Value) | USD 20.75 Billion |
| Market Forecast, 2030 (Value) | USD 30.25 Billion |
| Growth Rate | CAGR of 6.5% from 2025 to 2030 |
| Years Considered | 2022–2030 |
| Base Year | 2024 |
| Forecast Period | 2025–2030 |
| Units Considered | Value (USD Million), Volume (Kiloton) |
| Report Coverage | Market size projection, company ranking, competitive landscape, growth factors, and trends |
| Segments Covered |
|
| Regions Covered | North America, Asia Pacific, Europe, South America, Middle East & Africa |
WHAT IS IN IT FOR YOU: Acrylic Resins Market REPORT CONTENT GUIDE
DELIVERED CUSTOMIZATIONS
We have successfully delivered the following deep-dive customizations:
| CLIENT REQUEST | CUSTOMIZATION DELIVERED | VALUE ADDS |
|---|---|---|
| Coatings Manufacturer |
|
|
| Adhesives & Sealants Producer |
|
|
| Plastics & Polymers Manufacturer |
|
|
| Raw Material Supplier / Distributor |
|
|
| Industrial Coatings End User |
|
|
RECENT DEVELOPMENTS
- March 2025 : BASF completed the mechanical construction of a world-scale integrated production site for glacial acrylic acid (GAA) and downstream esters, butyl acrylate (BA), and 2-ethylhexyl acrylate (2-EHA).
- March 2025 : Sumitomo Chemical Co., Ltd. began offering chemically recycled PMMA (polymethyl methacrylate) at scale to major OEMs such as LG Display and Nissan.
- April 2024 : BASF signed a Letter of Intent (LoI) to supply butyl acrylate and 2-ethylhexyl acrylate from its upcoming Zhanjiang site to Youyi Group.
- September 2023 : Arkema implement a patented purification technology at its Carling, France production site by 2026.
- February 2022 : Mitsubishi Chemical Group Corporation designed of plant-derived and chemically recycled MMA via “Sustainable MMA” pilot program.
Table of Contents
 Exclusive indicates content/data unique to MarketsandMarkets and not available with any competitors.
Methodology
The study involved four major activities to estimate the current size of the global acrylic resins market. Exhaustive secondary research was carried out to collect information on the market, the peer product market, and the parent product group market. The next step was to validate these findings, assumptions, and sizes with the industry experts across the value chain of acrylic resin through primary research. The top-down and bottom-up approaches were employed to estimate the overall size of the acrylic resins market. After that, market breakdown and data triangulation procedures were used to determine the size of different segments and sub-segments of the market.
Secondary Research
The market for companies offering acrylic resin is arrived at by secondary data available through paid and unpaid sources, analyzing the product portfolios of the major companies in the ecosystem, and rating the companies by their performance and quality. Various secondary sources, such as Business Standard, Bloomberg, World Bank, and Factiva, were referred to identify and collect information for this study on the acrylic resins market. In the secondary research process, various secondary sources were referred to identify and collect information related to the study. Secondary sources included annual reports, press releases, and investor presentations, forums, certified publications, and whitepapers. The secondary research was used to obtain critical information on the industry’s value chain, the total pool of key players, market classification, and segmentation from the market and technology-oriented perspectives.
Primary Research
In the primary research process, various primary sources from both the supply and demand sides were interviewed to obtain qualitative and quantitative information for this report. Primary sources from the supply side included industry experts, such as Chief Executive Officers (CEOs), Vice Presidents (VPs), marketing directors, technology and innovation directors, and related key executives from several key companies and organizations operating in the acrylic resins market. After the complete market engineering (calculations for market statistics, market breakdown, market size estimations, market forecasting, and data triangulation), extensive primary research was conducted to gather information and verify and validate the critical numbers arrived at. Primary research was also conducted to identify the segmentation types, industry trends, competitive landscape of acrylic resin offered by various market players, and key market dynamics, such as drivers, restraints, opportunities, challenges, industry trends, and key player strategies. In the complete market engineering process, the top-down and bottom-up approaches and several data triangulation methods were extensively used to perform the market estimation and market forecasting for the overall market segments and subsegments listed in this report. Extensive qualitative and quantitative analysis was performed on the complete market engineering process to list the key information/insights throughout the report.
Breakdown of primary respondents:

Notes: Other designations include sales, marketing, and product managers.
Tier 1: >USD 1 Billion; Tier 2: USD 500 million–1 Billion; and Tier 3: < USD 500 million.
To know about the assumptions considered for the study, download the pdf brochure
Market Size Estimation
The top-down and bottom-up approaches were used to estimate and validate the size of the global acrylic resins market. These approaches were also used extensively to estimate the size of various dependent market segments. The research methodology used to estimate the market size included the following:

Data Triangulation
After arriving at the overall market size using the market size estimation processes, the market was split into several segments and subsegments. Wherever applicable, the data triangulation and market breakup procedures were employed to complete the overall market engineering process and arrive at the exact statistics of each market segment and subsegment. The data was triangulated by studying various factors and trends from both the demand and supply sides.
Market Definition
Acrylic resins are specially engineered polymers derived from acrylic acid, methacrylic acid, or their esters, widely used across industries such as paints & coatings, adhesives & sealants, construction, automotive, and electronics. These resins are critical for delivering high performance in applications requiring durability, weather resistance, clarity, and strong adhesion. Their usage is tailored to end-product requirements and environmental conditions, offering unique functionalities such as UV resistance, chemical resistance, impact strength, and color retention. They play an essential role in surface protection, esthetic enhancement, and structural performance in both industrial and consumer products.
Organizations including the American Coatings Association (ACA) and the European Council of the Paint, Printing Ink and Artists’ Colours Industry (CEPE) recognize acrylic resins as a key class of synthetic resins alongside alkyds, epoxies, and polyurethanes. The assessment of these resins follows international standards, which incorporate ASTM D5095, ISO 9001 for quality management, and REACH compliance for chemical safety in the European Union.
Stakeholders
- Acrylic resin manufacturers
- Raw material suppliers
- Converters & processors
- Distributors and traders
- Industry associations and regulatory bodies
- End users
Report Objectives
- To define, describe, and forecast the size of the acrylic resins market, based on chemistry, property, solvency, application, end-use industry, and region in terms of value and volume
- To provide detailed information on the significant drivers, restraints, opportunities, and challenges influencing the market
- To strategically analyze micromarkets1 concerning individual growth trends, prospects, and their contribution to the market
- To assess the growth opportunities in the market for stakeholders and provide details on the competitive landscape for market leaders
- To forecast the market size of segments and subsegments for North America, Europe, Asia Pacific, South America, and the Middle East & Africa
- To strategically profile key players and comprehensively analyze their market shares and core competencies
- To analyze competitive developments such as acquisitions, product launches, expansions, partnerships, and agreements in the acrylic resins market
- To provide the impact of AI/Gen AI on the market
Key Questions Addressed by the Report
Which factors are propelling the growth of the acrylic resin market?
Increasing demand from construction, automotive, and packaging sectors, along with rising adoption of eco-friendly and waterborne resin technologies. Additionally, advancements in durability, weatherability, and adhesion are boosting adoption across industries.
What are the major challenges to the growth of the acrylic resin market?
Fluctuating raw material prices, environmental compliance costs, and limitations in heat and chemical resistance in certain applications.
What are the major opportunities in the acrylic resin market?
Rising demand for bio-based and low-VOC formulations, expansion into renewable energy applications (e.g., wind turbine coatings), and rapid urbanization in emerging economies.
What are the major factors restraining the growth of the acrylic resin market?
High production costs for advanced grades and strong competition from alternative resin chemistries like epoxy, polyurethane, and alkyds.
Who are the major players in the acrylic resin market?
Major players include BASF (Germany), Dow (US), Mitsubishi Chemical Group Corporation (Japan), Sumitomo Chemical Co., Ltd. (Japan), Arkema (France), DIC CORPORATION (Japan), Covestro AG (Germany), Mitsui Chemicals, Inc. (Japan), Trinseo (US), and Asahi Kasei Corporation (Japan).
Need a Tailored Report?
Customize this report to your needs
Get 10% FREE Customization
Customize This ReportPersonalize This Research
- Triangulate with your Own Data
- Get Data as per your Format and Definition
- Gain a Deeper Dive on a Specific Application, Geography, Customer or Competitor
- Any level of Personalization
Let Us Help You
- What are the Known and Unknown Adjacencies Impacting the Acrylic Resins Market
- What will your New Revenue Sources be?
- Who will be your Top Customer; what will make them switch?
- Defend your Market Share or Win Competitors
- Get a Scorecard for Target Partners

Custom Market Research Services
We Will Customise The Research For You, In Case The Report Listed Above Does Not Meet With Your Requirements
Get 10% Free CustomisationTESTIMONIALS

We at Nissan Chemicals Corporation have been clients of MarketsandMarkets for more than a year now. We recently consulted MarketsandMarkets for a study, the team at MarketsandMarkets was extremely professional and organized. The business insights were very detailed and aligned well with our expectations that really helped us formulate the Business Plans and device new strategies for development themes. MarketsandMarkets offers a unique combination of expertise and dedicated engagement model. Their research findings have helped us in designing our Pricing Strategy which will make it easier for us to predict the future sales and profits for the next ten years. We look forward to working with MarketsandMarkets in the future.
VP of Strategy & New Business Development
Leading Specialty Chemical Company
The MarketsandMarkets Engagement Model, composed of both the Knowledge Store and advisory custom research, has greatly helped us in understanding our markets and making strategic decisions. The Knowledge Store is a fast way to allow everyone in our organization to understand more about most any market they are interested in. The ability to then get custom research done and get answers to specific strategic questions and market insight has been spectacular. The Markets and Markets team feel more like colleagues than vendors and their services have helped us change our culture where statements of things like growth opportunities and competitive position are always backed by industry research.

Rich Gibson,
Director, Corporate Strategy
Milliken & Company,
Leading Industrial Manufacturer of specialty chemical, floor covering, performance and protective textile materials, and healthcaremilliken.com
MarketsandMarkets is a trusted resource that helps us to better understand markets that are near-adjacencies-whether its technology, value chain or geography. Their Knowledge Store platform provides a dashboard of markets and their characteristics which is easy to use and saves us time.
Adam Shaw,
Market Development and Strategy Manager
AdvanSix Inc. USA,
An American Leader in Chemicalswww.advansix.com
The Knowledge Store from MarketsandMarkets is a valuable tool which has helped my team acquire greater insight in to the end markets that our business serves. This has enabled us to help our company build stronger strategies throughout our planning process.
TOSHIO KINOSHITA
Senior Chif Consultion Research & Consulting Division
Mitsubishi Chemical Research Corporation,
Leading Manufacturer of Chemical Productswww.mitsubishichem-res.co.jp/en/

We recently engaged with MarketsandMarkets for a study, the team not only clearly understood our business objectives but was also extremely professional in the way they handled the entire project. The study was efficiently conducted in a phase-wise manner, and the engagement model furnished us with high-quality business insights that far exceeded our expectations at each phase. We were especially happy that MarketsandMarkets could provide us with both, an English as well as a Japanese version of the study. A special thanks to the Analyst Team and Client Services Team, whose fluency in Japanese enhanced our comfort level, as we could converse with them in our preferred language.
Independent entrepreneurs
Arrow Precision
We approached MarketsandMarkets for study on Proppants Market, and their work exceeded our expectations. The study conducted was comprehensive and enabled us to view the market through the various dimensions. In addition, the team was extraordinarily responsive throughout the process and resolved our queries on time. I strongly recommend MarketsandMarkets and will certainly consider them for additional market assessments we will need in the future.
Global engineering company, Japan
Deputy Manager,
Strategic Planning OfficeThe high-quality insights shared by the MarketsandMarkets team helped us understand the pharmaceutical plant designers in a specific geography. It also captured the risks that we may likely face in communicating with our potential partners. The study would enable us identify partners, which would impact our future growth.


Growth opportunities and latent adjacency in Acrylic Resins Market