
PVC Pipes & Fittings Market

PVC Pipes & Fittings Market by Material (UPVC, CPVC, Flexible PVC), Product Type (Pipes, Fittings), Application (Water Supply & Distribution, Sewerage & Drainage Systems, Irrigation & Agriculture, Chemical & Industrial Fluid Handling, HVAC & Plumbing Systems, Electrical Conduit & Cable Protection), End-Use Industry (Residential, Commercial, Municipal & Utilities, Agriculture, Industrial), and Region - Global Forecast to 2030
Updated on : November 27, 2025


PVC PIPES & FITTINGS MARKET OVERVIEW
Source: Secondary Research, Interviews with Experts, MarketsandMarkets Analysis
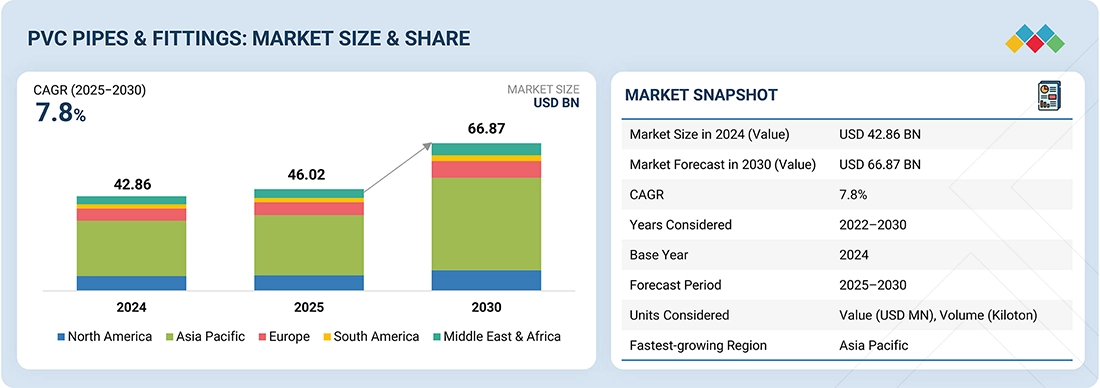
The PVC pipes & fittings market is projected to reach USD 66.87 billion by 2030 from USD 46.02 billion in 2025, at a CAGR of 7.8% from 2025 to 2030. PVC pipes & fittings are expected to witness strong growth driven by increasing infrastructure development, urbanization, and rising demand for efficient water management systems. Governments worldwide are investing heavily in upgrading aging water and sewage networks, particularly in emerging economies where access to clean water and sanitation is a priority.
KEY TAKEAWAYS
-
BY MATERIALBy material, the market is segmented into UPVC, CPVC, and other materials. UPVC (unplasticized PVC) is the most widely used type. It offers high rigidity, chemical resistance, and cost efficiency, making it ideal for water supply, drainage, and agricultural applications. Its growth is fueled by rapid urbanization and infrastructure expansion. CPVC (chlorinated PVC) provides superior heat and corrosion resistance, making it suitable for hot water and industrial fluid systems. Its demand is rising with the growth of residential and commercial plumbing systems requiring thermal durability. Other materials, such as MPVC (molecularly oriented PVC) and PVC-O, are gaining traction due to enhanced strength, pressure resistance, and environmental benefits. Overall, the shift toward durable, lightweight, and sustainable piping materials is driving the adoption of these PVC variants across global construction and utility sectors.
-
BY PRODUCT TYPEBy product type, the market is segmented into pipes, fittings, and other product types. Pipes dominate the market due to their extensive use in water supply, sewage, irrigation, and industrial applications, driven by their durability, corrosion resistance, and cost-effectiveness. Fittings, including elbows, tees, couplings, and valves, are essential for connecting and directing pipe networks. Their growth is supported by the increasing complexity of plumbing and infrastructure systems requiring reliable joint solutions. Other product types, such as valves and conduits, are witnessing steady demand from electrical, telecommunication, and specialized fluid transport applications.
-
BY APPLICATIONPVC pipes & fittings products are increasingly used in water supply & distribution, sewage & drainage, irrigation, chemical & industrial handling, electrical & conduct systems, HVAC & plumbing, and other applications. The water supply & distribution segment leads due to increasing investments in urban and rural water infrastructure and the need for leak-proof, corrosion-resistant systems. Sewage & drainage applications are expanding with the rise in sanitation projects and smart city initiatives aimed at improving wastewater management. Irrigation demand is growing rapidly, especially in agriculture-driven economies, due to the need for efficient water conservation and distribution solutions. Chemical & industrial handling uses are increasing owing to PVC’s strong resistance to corrosive fluids and chemicals. Additionally, other applications such as cable conduits and HVAC systems are benefiting from the material’s versatility and ease of installation. Overall, market growth is being driven by urbanization, infrastructure development, and the global push for sustainable and cost-effective fluid transport systems.
-
BY END-USE INDUSTRYPVC pipes & fittings products are increasingly used in Municipal & Utilities, Residential, Agriculture, Industrial, Commercial and other end-use industries. The municipal & utilities segment leads the market, driven by government investments in water supply, sewage, and sanitation infrastructure upgrades. The residential sector is expanding rapidly due to increasing housing construction, urbanization, and the adoption of modern plumbing systems. Commercial applications, including office complexes, hospitals, and retail facilities, are growing with the rise in urban infrastructure development and demand for efficient HVAC and water management systems. The agriculture sector contributes significantly through irrigation and drainage applications, supported by initiatives promoting water conservation and rural infrastructure. Other industries, such as industrial processing and power generation, further add to the market through demand for durable, corrosion-resistant piping systems.
-
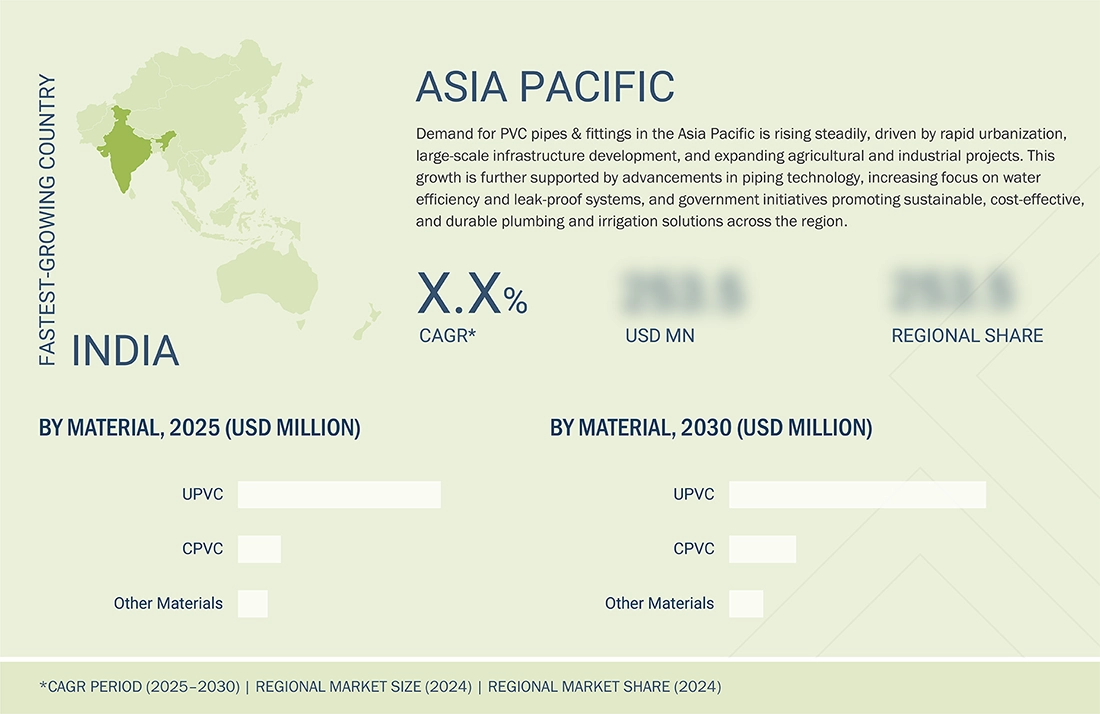
BY REGIONAsia Pacific is expected to register the highest CAGR of 9.0%, due to rapid urbanization, population growth, and extensive infrastructure development across countries such as China, India, and Southeast Asian nations. Rising investments in water supply, sanitation, irrigation, and housing projects are driving strong demand for PVC piping systems in the region. Additionally, the presence of major manufacturers, availability of low-cost raw materials, and supportive government initiatives for rural water management and smart city development further boost market growth..
-
COMPETITIVE LANDSCAPEThe market is driven by strategic collaborations, capacity expansions, and technological innovations from leading players such as JM EAGLE, INC. (US), Aliaxis Holdings SA (Belgium), China Lesso Group Holdings Limited (China), Orbia (Mexico), and Georg Fischer Ltd. (Switzerland). These companies are making advancements in PVC pipes & fittings technology compared to their competitors.
The PVC pipes & fittings market is projected to reach USD 66.87 billion by 2030 from USD 46.02 billion in 2025, at a CAGR of 7.8% from 2025 to 2030. PVC pipes & fittings are plastic piping components made from polyvinyl chloride (PVC), a durable and lightweight thermoplastic material widely used for fluid transportation systems. These pipes & fittings are designed to convey water, wastewater, chemicals, and other fluids efficiently in applications such as plumbing, irrigation, sewage, and industrial processes. Known for their corrosion resistance, smooth internal surface, chemical stability, and cost-effectiveness, PVC pipes and fittings offer long service life and low maintenance requirements, making them a preferred alternative to traditional metal and concrete piping systems across residential, commercial, municipal, and industrial sectors.
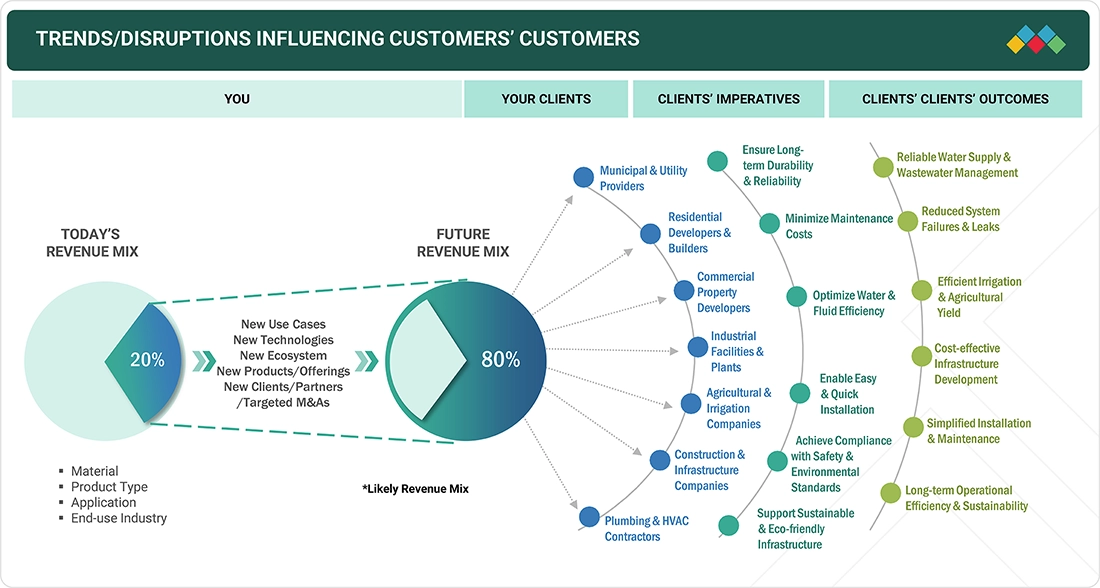
TRENDS & DISRUPTIONS IMPACTING CUSTOMERS' CUSTOMERS
PVC pipes & fittings are critical components across a wide range of applications, including water supply & distribution, sewage & drainage, irrigation, chemical & industrial handling, electrical & conduct systems, HVAC & plumbing, and other applications. The market’s revenue mix is primarily driven by traditional applications; however, future growth—estimated at around 80% from new use cases and technologies—will come from innovations, ecosystem partnerships, and targeted mergers and acquisitions. As end-use industries such as municipal utilities, residential and commercial construction, agriculture, and industrial facilities prioritize long-term durability, water efficiency, and sustainability, PVC pipe manufacturers are aligning product development to meet these imperatives. This shift highlights the market’s transformation toward high-performance, low-maintenance, and eco-friendly piping systems, driving reliability, operational efficiency, and infrastructure resilience for customers and their end users.
Source: Secondary Research, Interviews with Experts, MarketsandMarkets Analysis
MARKET DYNAMICS
Level
-
Fueling Growth Through Infrastructure Expansion

-
Lowering Costs with Easy Installation & Maintenance

Level
-
Navigating Tightening Environmental Regulations

-
Facing Material Substitution Threats

Level
-
Advancing Sustainability Through PVC Recycling

-
Innovating with Lead-free and Non-phthalate Additives

Level
-
Managing Volatile Raw Material & Energy Costs

-
Improving Market Perception Under ESG Pressures

Source: Secondary Research, Interviews with Experts, MarketsandMarkets Analysis
Driver: Fueling Growth Through Infrastructure Expansion
Global infrastructure growth is one of the primary drivers for the PVC pipes & fittings market. Countries worldwide are investing heavily in residential, commercial, and industrial construction, along with large-scale public infrastructure projects such as metro systems, airports, hospitals, and urban housing schemes. In the US, government-backed infrastructure initiatives, including the Bipartisan Infrastructure Law, are expected to channel billions of dollars toward construction and water systems modernization, increasing demand for reliable piping solutions. Similarly, in Europe, the European Investment Bank has funded urban development and water management projects that depend on durable and cost-effective piping systems. Emerging economies in the Asia Pacific, including India, China, and Southeast Asian nations, are witnessing rapid urbanization, with new smart cities, industrial parks, and affordable housing schemes under construction. In India alone, the Smart Cities Mission and Pradhan Mantri Awas Yojana (PMAY) program are driving substantial demand for PVC-based plumbing and drainage systems. PVC pipes offer an attractive solution in these projects because of their lightweight nature, corrosion resistance, and ease of installation, reducing construction timelines and overall project costs. Consequently, manufacturers are scaling local production capacities and expanding distribution networks to meet the growing requirements of both public and private infrastructure projects. The sustained pace of global infrastructure development ensures a stable and long-term demand for PVC pipes & fittings, making infrastructure expansion a key growth driver for the market.
Restraint: Navigating Tightening Environmental Regulations
Regulatory scrutiny of PVC materials and additives has emerged as a key restraint in the global market. In regions such as Europe, agencies, including ECHA (European Chemicals Agency), have imposed stringent rules under REACH to limit the use of hazardous substances like lead-based stabilizers and certain phthalates in PVC products. Compliance with these regulations often requires manufacturers to reformulate products, invest in R&D, and adopt new production processes, which increase operational costs. In North America, similar concerns exist with EPA guidelines on chemical safety and drinking water standards, requiring manufacturers to maintain strict quality and safety measures for potable water applications. Emerging markets, including India and Southeast Asia, are gradually introducing environmental norms for building materials and water supply systems, pushing manufacturers to align with global standards. Non-compliance can lead to market restrictions, reputational damage, or exclusion from public tenders. Moreover, end-users are increasingly aware of environmental and health impacts, influencing procurement decisions toward safer or alternative materials. While PVC remains cost-effective and durable, regulatory pressures pose challenges to production scalability, product consistency, and pricing strategies, especially for smaller regional manufacturers who may lack resources to implement compliant formulations. These regulatory dynamics restrain market growth by adding compliance complexity, increasing capital expenditures, and potentially slowing adoption in regions with evolving environmental standards.
Opportunity: Advancing Sustainability Through PVC Recycling
Sustainability and recycling represent a significant growth opportunity for the PVC pipes & fittings market. Globally, industry initiatives such as VinylPlus in Europe are driving large-scale PVC recycling, promoting circular economy principles and reducing environmental impact. In Europe, recycled PVC is increasingly being used in construction, electrical insulation, and piping systems, demonstrating the potential for eco-friendly product offerings. In India, programs for collecting and reprocessing post-consumer PVC waste are gradually emerging, particularly in urban centers where construction and municipal projects generate significant PVC scrap. Companies that adopt recycled-content pipes and fittings can not only reduce raw material costs but also align with green building standards, such as LEED certification, thereby attracting environmentally conscious developers and municipal clients. Additionally, sustainable PVC solutions can help manufacturers comply with stricter environmental regulations and waste management policies, enhancing brand reputation and competitive positioning. Globally, regions like North America, Southeast Asia, and Latin America are beginning to recognize the importance of PVC recycling in reducing landfill pressures and promoting material efficiency. This creates opportunities for manufacturers to establish recycling plants, collaborate with municipal waste management programs, and market recycled-content PVC pipes & fittings. By integrating recycling into product lines, the industry can enhance its environmental credentials, reduce dependency on virgin materials, and tap into the growing demand for sustainable infrastructure solutions, thus driving long-term growth in both mature and emerging markets.
Challenge: Managing Volatile Raw Material & Energy Costs
PVC production depends heavily on vinyl chloride monomer (VCM) and ethylene, both of which are derived from crude oil and natural gas. Fluctuations in global oil and gas prices directly impact the cost of PVC resin, affecting margins and pricing strategies. For instance, geopolitical tensions or supply disruptions in the Middle East, a major source of petrochemical feedstock, can create sudden price volatility. In regions like India and Southeast Asia, where imported feedstocks are often used, manufacturers face additional exposure to currency fluctuations and shipping costs. Similarly, in North America and Europe, energy-intensive PVC production is sensitive to electricity and natural gas costs. High raw material costs can delay procurement, reduce competitiveness against alternative materials such as HDPE, and pressure manufacturers to optimize production efficiency. The cyclical nature of petrochemical prices makes long-term financial planning challenging, especially for smaller manufacturers with limited hedging capabilities. Volatility also affects project economics for contractors and utilities, who may delay or substitute materials when PVC prices spike, creating a ripple effect across supply chains. Managing this cost uncertainty requires strategic sourcing, supply contracts, and operational efficiency improvements, but it remains a persistent challenge for the PVC market globally.
PVC Pipes & Fittings Market: COMMERCIAL USE CASES ACROSS INDUSTRIES
| COMPANY | USE CASE DESCRIPTION | BENEFITS |
|---|---|---|
 |
Blue Brute (C900) Pressure Pipe used for municipal water distribution; SDR Series 77743 Pipe used for pressurized irrigation; Solvent Weld DWV Pipe for commercial drainage; Eagle Loc Electrical Conduit for electrical installations | High pressure tolerance, corrosion resistance, cost-effective, easy to handle, meets ASTM standards, and non-conductive for electrical safety |
 |
FIP PVC-U System for industrial liquid transport; Lareter PVC-A Pipes & Fittings for under-pressure applications; Acoustic Soil & Waste System for noise reduction in commercial buildings | Chemical resistance, reliable fluid transport, reduces noise in commercial settings, and suitable for industrial applications |
 |
PVC-U Pressure Pipes for water supply in residential, commercial, and municipal projects; PVC-U Double Wall Corrugated Pipe for drainage and sewerage; PVC-U Fittings (elbows, tees, couplings) for secure connections | Durable, easy installation, flexible, leak-proof, and strong for civil engineering projects |
 |
FlowGuard Gold CPVC for high-temperature drinking water in commercial buildings; PVC-U Pipes for drainage in commercial/industrial settings; PVC Resins for rigid and flexible applications | High-temperature resistance, long-term reliability, efficient waste management, and versatile resin options |
Logos and trademarks shown above are the property of their respective owners. Their use here is for informational and illustrative purposes only.
MARKET ECOSYSTEM
The PVC pipes & fittings ecosystem represents a well-integrated value chain comprising manufacturers, raw material suppliers, distributors, and end users, all working together to enable the efficient production and delivery of durable, high-performance, and sustainable piping solutions. Leading manufacturers such as JM Eagle, Aliaxis, China Lesso, Georg Fischer (+GF+), and Orbia dominate the market with their advanced technologies, extensive product portfolios, and global manufacturing capabilities, focusing on innovation and strategic expansion to meet growing demand across construction, utilities, and industrial sectors. Raw material suppliers, including SHG Microns, Sanmar, Apcotex, and Barus, provide the essential PVC resins, additives, and stabilizers that enhance product quality, strength, and sustainability. Distributors such as Harrington, DNOW, and PCW Global Distribution ensure smooth supply chain operations by facilitating wide market reach, efficient logistics, and technical support. At the end of the value chain, end users like Red Sea International, Syngenta, and BASF represent key sectors such as agriculture, chemicals, construction, and infrastructure, driving the global demand for reliable and efficient piping systems.
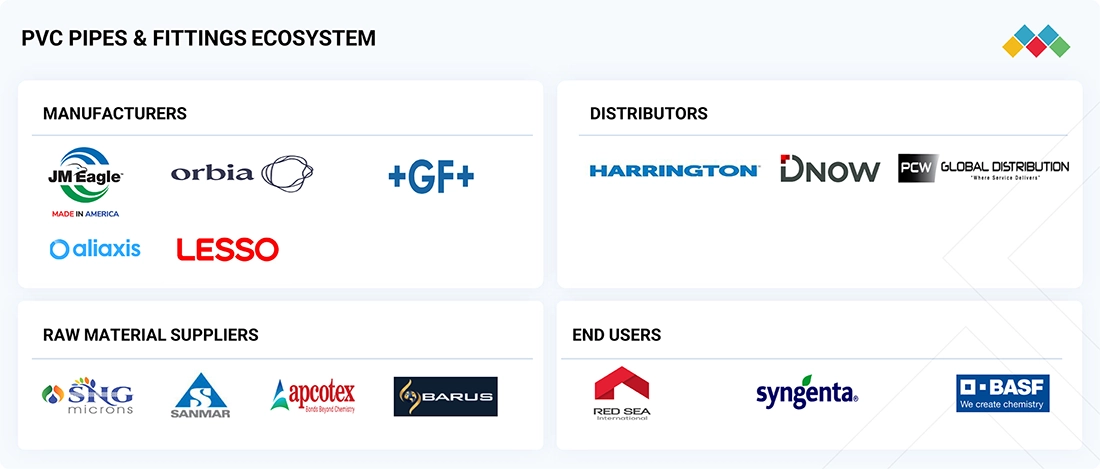
Logos and trademarks shown above are the property of their respective owners. Their use here is for informational and illustrative purposes only.
MARKET SEGMENTS
Source: Secondary Research, Interviews with Experts, MarketsandMarkets Analysis
PVC Pipes & Fittings Market, by Material
UPVC materials are expected to hold the highest market share in the PVC pipes & fittings market due to their superior mechanical strength, chemical resistance, and cost-effectiveness. Unlike CPVC or other modified variants, UPVC does not contain plasticizers, which enhances its rigidity and durability, making it ideal for applications such as water supply, drainage, and irrigation. Its low thermal conductivity, excellent corrosion resistance, and ability to withstand harsh weather conditions make it a preferred material for both residential and commercial plumbing systems. Moreover, UPVC pipes are lightweight, easy to install, and have a long service life with minimal maintenance, driving their adoption in large-scale infrastructure and urban development projects. The growing demand for sustainable and lead-free piping materials further supports UPVC’s dominance, as it aligns with green building standards and environmental regulations across emerging and developed markets.
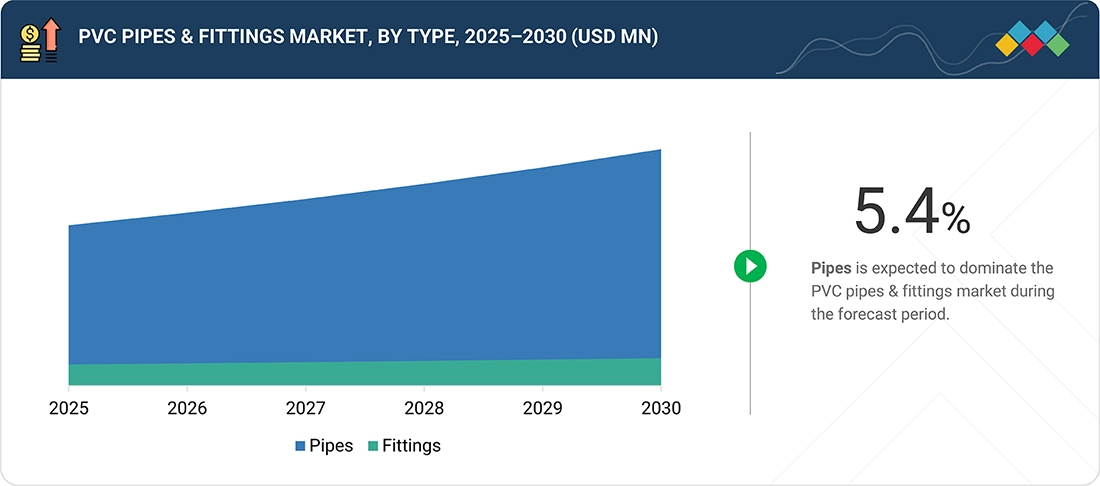
PVC Pipes & Fittings Market, by Product Type
Pipes are expected to hold the highest market share in the PVC pipes & fittings market due to their extensive use across key applications such as water supply, irrigation, sewage, and industrial fluid transport. Their superior strength, corrosion resistance, and ease of installation make them a preferred choice over traditional metal and concrete pipes. PVC pipes offer a longer service life with minimal maintenance, reducing lifecycle costs for infrastructure projects. Additionally, rapid urbanization, government investments in water management, and growing demand for efficient plumbing systems are further propelling the adoption of PVC pipes, reinforcing their dominance over fittings in the overall market.
PVC Pipes & Fittings Market, by Application
The water supply and distribution segment is expected to hold the highest market share in the PVC pipes & fittings market due to the increasing global emphasis on improving water infrastructure and ensuring reliable access to clean water. PVC pipes are widely preferred for water distribution systems because of their corrosion resistance, leak-proof joints, smooth internal surfaces, and long service life, which help minimize water losses and maintenance costs. Additionally, rising urbanization, government investments in rural water supply projects, and smart city initiatives are driving large-scale deployment of PVC piping networks for potable water distribution, further solidifying this segment’s dominant position in the market.
PVC Pipes & Fittings Market, by End-use Industry
The municipal and utilities end-use industry is expected to hold the highest market share in the PVC pipes & fittings market due to the growing demand for durable, cost-effective, and corrosion-resistant piping solutions for water supply, sewage, and drainage networks. Governments and local authorities are increasingly investing in upgrading aging infrastructure and expanding water distribution and wastewater management systems to meet urban population growth and environmental regulations. PVC pipes’ lightweight nature, ease of installation, and long service life make them ideal for large-scale municipal projects, reducing operational and maintenance costs. This widespread use in essential public infrastructure solidifies the dominance of the municipal and utilities sector in the overall PVC pipes & fittings market.
REGION
Asia Pacific to be fastest-growing region in global PVC pipes & fittings market during forecast period
The Asia Pacific region is the fastest-growing market for PVC pipes & fittings due to rapid urbanization, industrialization, and infrastructure expansion across major economies such as China, India, Japan, and South Korea. Massive investments in residential construction, water supply, irrigation, and sewage management are fueling demand for durable and cost-effective piping solutions. PVC pipes are especially favored in this region for their low installation costs, corrosion resistance, and long service life, making them ideal for large-scale public and private infrastructure projects.
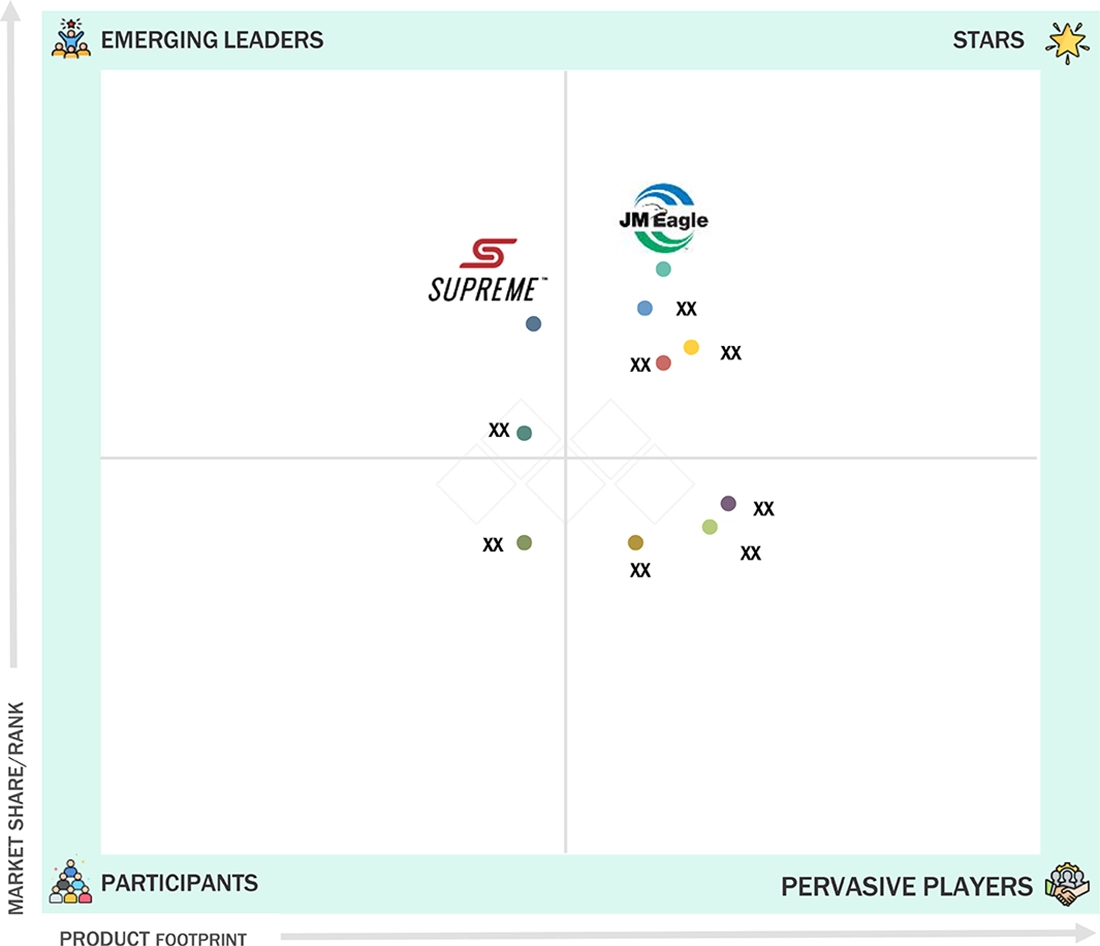
PVC Pipes & Fittings Market: COMPANY EVALUATION MATRIX
In the PVC pipes & fittings market matrix, JM EAGLE, INC. (Star), a US company, leads the market through its manufacturing and distribution of PVC pipe & fitting products. The company has extensive production capacity, advanced manufacturing technology, and strong distribution network across North America and international markets. As one of the world’s largest plastic pipe manufacturers, the company benefits from economies of scale, ensuring competitive pricing and consistent product quality. JM EAGLE’s comprehensive product portfolio covers applications in water supply, sewage, irrigation, gas distribution, and industrial systems, allowing it to serve diverse end-use industries. The company’s focus on innovation, such as developing high-performance, lead-free, and energy-efficient PVC piping solutions, strengthens its position amid increasing sustainability demands.
Source: Secondary Research, Interviews with Experts, MarketsandMarkets Analysis
KEY MARKET PLAYERS
MARKET SCOPE
| REPORT METRIC | DETAILS |
|---|---|
| Market Size in 2024 (Value) | USD 42.86 Billion |
| Market Forecast in 2030 (Value) | USD 66.87 Billion |
| Growth Rate | CAGR of 7.8% from 2025–2030 |
| Years Considered | 2022–2030 |
| Base Year | 2024 |
| Forecast Period | 2025–2030 |
| Units Considered | Value (USD Million/Billion), Volume (Kiloton) |
| Report Coverage | Revenue Forecast, Company Ranking, Competitive Landscape, Growth Factors, and Trends |
| Segments Covered | • By Material: UPVC, CPVC, and Other Materials • By Product Type: Pipes, Fittings, and Other Product Types • By Application: Water Supply & Distribution, Sewage & Drainage, Irrigation, Chemical & Industrial Handling, Electrical & Conduct Systems, HVAC & Plumbing, and Other Applications By End-use Industry: Municipal & Utilities, Residential, Agriculture, Industrial, Commercial, and Other End-use Industries |
| Regions Covered | North America, Asia Pacific, Europe, South America, Middle East & Africa |
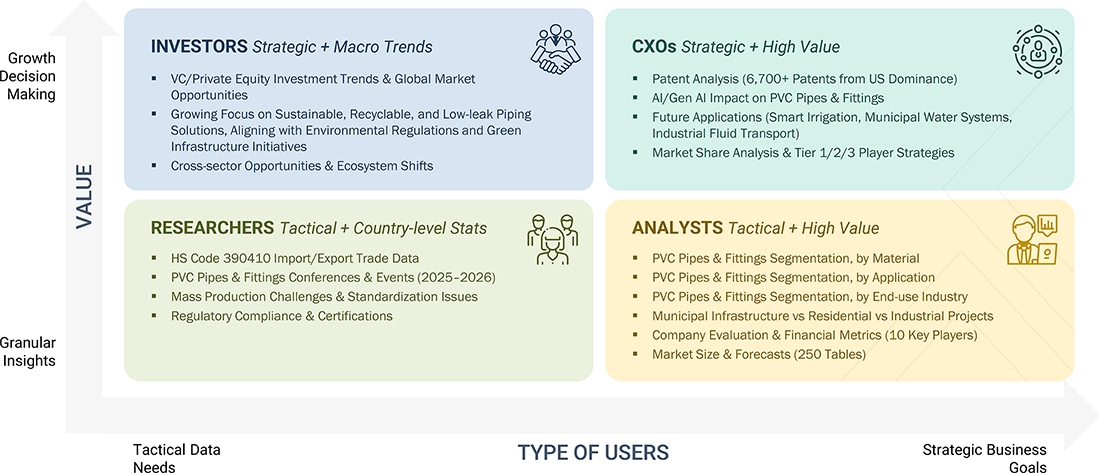
WHAT IS IN IT FOR YOU: PVC Pipes & Fittings Market REPORT CONTENT GUIDE
DELIVERED CUSTOMIZATIONS
We have successfully delivered the following deep-dive customizations:
| CLIENT REQUEST | CUSTOMIZATION DELIVERED | VALUE ADDS |
|---|---|---|
| PVC Resin/Compound Manufacturer | • Competitive profiling of PVC resin producers (virgin PVC vs. recycled PVC/compounders — cost structures, margins, portfolio) • Mapping downstream customer segments by pipes, fittings, rigid PVC extrusions, and specialty applications • Assessment of regulatory & additive requirements (stabilizers, impact modifiers, flame retardants) and supply chain risk | Unit-cost and margin comparison for virgin PVC vs. reprocessed/compound PVC across product grades (uPVC, CPVC, high-impact) • Customer map (OEMs, pipe makers, fabricators, distributors) with volume/price sensitivity and preferred resin grades • Risk matrix for feedstock (VCM/ethylene feed changes), additive sourcing, and regulatory compliance (RoHS, REACH, BIS/IS standards) |
| PVC Pipes & Fittings Manufacturer (National/Regional) | Benchmark of product portfolios, gross margins by SKU, and distribution models (direct, dealers, retail chains) • Demand heat map by application and procurement cycle timelines for municipal vs. private projects • Manufacturing gap analysis with automation/quality checkpoints, capital ROI models for new extrusion lines | • Actionable product rationalization to drop low-margin SKUs and focus on high-growth, high-margin segments • Sales playbook aligned to buyer type (tender-winning for utilities; fast-delivery SKUs for retail) • Capex roadmap to cut per-unit costs and improve lead times |
| Construction, Infrastructure & Utilities (Contractors/EPCs) | • Side-by-side technical performance matrix (pressure rating, jointing methods, chemical resistance, UV durability) and cost-per-km models • Total cost of ownership (TCO) calculator that factors installation labor, fittings count, expected leaks, and lifecycle maintenance • Recommended vendor shortlist with lead-time analytics and staging/just-in-time delivery plans | • Faster, lower-risk spec selection that reduces tender risk and lifecycle O&M costs • Procurement strategy to minimize on-site delays and reduce inventory carrying cost • Evidence-based arguments to justify PVC selection to owners/engineers (TCO + performance) |
| Agricultural & Irrigation OEM/Dealer | • Demand segmentation by crop type, irrigation type (drip, lateral, mainlines), and seasonal cadence • Durability and maintenance comparisons with recommended grade (UV-stabilized uPVC vs. flexible PE) • Go-to-market plan for dealer training, bundle SKU pricing, and seasonal stocking strategies | • Increased penetration of high-margin irrigation fittings and value bundles at dealer level • Reduced field failures via recommended grades and installation training — improves brand reputation • Capture of seasonal demand peaks through optimized stocking and promotional planning |
RECENT DEVELOPMENTS
- March 2025 : Aliaxis Holdings SA announced an investment to establish two new greenfield manufacturing facilities in Chennai and Hyderabad by FY27. This will strengthen Aliaxis Holdings SA’s manufacturing footprint in India and enhance production capacity for PVC and CPVC pipes and fittings.
- August 2024 : Aliaxis Holdings SA closed a deal to acquire Johnson Controls’ CPVC pipe & fittings business for residential & light commercial sprinkler systems. This move broadens Aliaxis Holdings SA’s product portfolio into CPVC piping and residential sprinkler markets, strengthening its market share in specialized piping systems.
- March 2024 : JM Eagle Inc. has expanded its plant in Wilton, Iowa, by adding a five-story building to increase production capacity. This development enhances JM Eagle's capabilities, allowing the company to meet the growing demand and improve supply in the PVC pipes & fittings market.
Table of Contents
 Exclusive indicates content/data unique to MarketsandMarkets and not available with any competitors.
Methodology
The study involves two major activities in estimating the current market size for the PVC pipes & fittings market. Exhaustive secondary research was done to collect information on the market, peer market, and parent market. The next step was to validate these findings, assumptions, and sizing with industry experts across the value chain through primary research. Both top-down and bottom-up approaches were employed to estimate the complete market size. Following this, market breakdown and data triangulation were employed to determine the market size of segments and subsegments.
Secondary Research
Secondary sources referred to for this research study include financial statements of companies offering PVC pipes & fittings and information from various trade, business, and professional associations. Secondary research has been used to obtain critical information about the industry’s value chain, the total pool of key players, market classification, and segmentation according to industry trends, to the bottom-most level, and regional markets. The secondary data was collected and analyzed to arrive at the overall size of the PVC pipes & fittings market, which was validated by primary respondents.
Primary Research
Extensive primary research was conducted after obtaining information regarding the PVC pipes & fittings market scenario through secondary research. Several primary interviews were conducted with market experts from both the demand and supply sides across major countries of North America, Europe, Asia Pacific, the Middle East & Africa, and South America. Primary data was collected through questionnaires, emails, and telephonic interviews. The primary sources from the supply side included various industry experts, such as chief executive officers (CXOs), vice presidents (VPs), directors from business development, marketing, product development/innovation teams, and related key executives from the PVC pipes & fittings industry, vendors, material providers, distributors, and key opinion leaders. Primary interviews were conducted to gather insights, including market statistics, revenue data from products and services, market breakdowns, market size estimations, market forecasting, and data triangulation. Primary research also helped in understanding the various trends related to material, product types, applications, end-use industries, and regions. Stakeholders from the demand side, such as CIOs, CTOs, CSOs, and installation teams of the customer/end users who are seeking PVC pipes & fittings services, were interviewed to understand the buyer’s perspective on the suppliers, products, component providers, and their current usage of PVC pipes & fittings and future outlook of their business which will affect the overall market.
The Breakup of Primary Research:

To know about the assumptions considered for the study, download the pdf brochure
Market Size Estimation
The research methodology used to estimate the size of the PVC pipes & fittings market includes the following details. The market sizing was undertaken from the demand side. The market was upsized based on the demand for PVC pipes & fittings in different applications at a regional level. Such procurements provide information on the demand aspects of the PVC pipes & fittings industry for each application. For each application, all possible segments of the PVC pipes & fittings market were integrated and mapped.

Data Triangulation
After arriving at the overall size from the market size estimation process explained above, the total market was split into several segments and subsegments. The data triangulation and market breakdown procedures explained below were implemented, wherever applicable, to complete the overall market engineering process and arrive at the exact statistics for various market segments and subsegments. The data was triangulated by studying various factors and trends from the demand and supply sides. Along with this, the market size was validated using both the top-down and bottom-up approaches.
Market Definition
The PVC pipes & fittings market refers to the global industry involved in the production, distribution, and application of polyvinyl chloride (PVC)-based piping systems used for fluid transport and structural applications. This market encompasses a wide range of products, including pressure pipes, non-pressure pipes, and fittings, designed for water supply, sewage, irrigation, plumbing, and industrial uses. Characterized by the material’s lightweight nature, corrosion resistance, cost efficiency, and long service life, the market serves diverse sectors such as construction, agriculture, infrastructure, and manufacturing, making it a cornerstone of modern fluid management and urban development systems.
Stakeholders
- PVC Pipes & Fittings Manufacturers
- PVC Pipes & Fittings Distributors and Suppliers
- End-use Industries
- Universities, Governments, and Research Organizations
- Associations and Industrial Bodies
- R&D Institutes
- Environmental Support Agencies
- Investment Banks and Private Equity Firms
- Research and Consulting Firms
Report Objectives
- To define, describe, and forecast the PVC pipes & fittings market size in terms of volume and value
- To provide detailed information regarding the key factors, such as drivers, restraints, opportunities, and challenges influencing the market growth
- To analyze and project the global PVC pipes & fittings market, by material, product type, application, end-use industry, and region
- To forecast the market size concerning five main regions (along with country-level data), namely, North America, Europe, Asia Pacific, Middle East & Africa, and South America, and analyze the significant region-specific trends
- To strategically analyze micromarkets with respect to individual growth trends, prospects, and contributions of the submarkets to the overall market
- To analyze the market opportunities and the competitive landscape for stakeholders and market leaders
- To assess recent market developments and competitive strategies, such as agreements, contracts, acquisitions, partnerships, collaborations, and product developments/product launches, to draw the competitive landscape
- To strategically profile the key market players and comprehensively analyze their core competencies
Need a Tailored Report?
Customize this report to your needs
Get 10% FREE Customization
Customize This ReportPersonalize This Research
- Triangulate with your Own Data
- Get Data as per your Format and Definition
- Gain a Deeper Dive on a Specific Application, Geography, Customer or Competitor
- Any level of Personalization
Let Us Help You
- What are the Known and Unknown Adjacencies Impacting the PVC Pipes & Fittings Market
- What will your New Revenue Sources be?
- Who will be your Top Customer; what will make them switch?
- Defend your Market Share or Win Competitors
- Get a Scorecard for Target Partners

Custom Market Research Services
We Will Customise The Research For You, In Case The Report Listed Above Does Not Meet With Your Requirements
Get 10% Free CustomisationTESTIMONIALS

We at Nissan Chemicals Corporation have been clients of MarketsandMarkets for more than a year now. We recently consulted MarketsandMarkets for a study, the team at MarketsandMarkets was extremely professional and organized. The business insights were very detailed and aligned well with our expectations that really helped us formulate the Business Plans and device new strategies for development themes. MarketsandMarkets offers a unique combination of expertise and dedicated engagement model. Their research findings have helped us in designing our Pricing Strategy which will make it easier for us to predict the future sales and profits for the next ten years. We look forward to working with MarketsandMarkets in the future.
VP of Strategy & New Business Development
Leading Specialty Chemical Company
The MarketsandMarkets Engagement Model, composed of both the Knowledge Store and advisory custom research, has greatly helped us in understanding our markets and making strategic decisions. The Knowledge Store is a fast way to allow everyone in our organization to understand more about most any market they are interested in. The ability to then get custom research done and get answers to specific strategic questions and market insight has been spectacular. The Markets and Markets team feel more like colleagues than vendors and their services have helped us change our culture where statements of things like growth opportunities and competitive position are always backed by industry research.

Rich Gibson,
Director, Corporate Strategy
Milliken & Company,
Leading Industrial Manufacturer of specialty chemical, floor covering, performance and protective textile materials, and healthcaremilliken.com
MarketsandMarkets is a trusted resource that helps us to better understand markets that are near-adjacencies-whether its technology, value chain or geography. Their Knowledge Store platform provides a dashboard of markets and their characteristics which is easy to use and saves us time.
Adam Shaw,
Market Development and Strategy Manager
AdvanSix Inc. USA,
An American Leader in Chemicalswww.advansix.com
The Knowledge Store from MarketsandMarkets is a valuable tool which has helped my team acquire greater insight in to the end markets that our business serves. This has enabled us to help our company build stronger strategies throughout our planning process.
TOSHIO KINOSHITA
Senior Chif Consultion Research & Consulting Division
Mitsubishi Chemical Research Corporation,
Leading Manufacturer of Chemical Productswww.mitsubishichem-res.co.jp/en/

We recently engaged with MarketsandMarkets for a study, the team not only clearly understood our business objectives but was also extremely professional in the way they handled the entire project. The study was efficiently conducted in a phase-wise manner, and the engagement model furnished us with high-quality business insights that far exceeded our expectations at each phase. We were especially happy that MarketsandMarkets could provide us with both, an English as well as a Japanese version of the study. A special thanks to the Analyst Team and Client Services Team, whose fluency in Japanese enhanced our comfort level, as we could converse with them in our preferred language.
Independent entrepreneurs
Arrow Precision
We approached MarketsandMarkets for study on Proppants Market, and their work exceeded our expectations. The study conducted was comprehensive and enabled us to view the market through the various dimensions. In addition, the team was extraordinarily responsive throughout the process and resolved our queries on time. I strongly recommend MarketsandMarkets and will certainly consider them for additional market assessments we will need in the future.
Global engineering company, Japan
Deputy Manager,
Strategic Planning OfficeThe high-quality insights shared by the MarketsandMarkets team helped us understand the pharmaceutical plant designers in a specific geography. It also captured the risks that we may likely face in communicating with our potential partners. The study would enable us identify partners, which would impact our future growth.


Growth opportunities and latent adjacency in PVC Pipes & Fittings Market