The study involved four major activities in estimating the current size of the Radome Market. Exhaustive secondary research was done to collect information on the radome market, its adjacent markets, and its parent market. The next step was to validate these findings, assumptions, and sizing with industry experts across the value chain through primary research. Demand-side analyses were carried out to estimate the overall size of the market. After that, market breakdown and data triangulation procedures were used to estimate the sizes of different segments and subsegments of the radome market.
Secondary Research
The market ranking of radome companies was determined using secondary data made available through paid and unpaid sources and by analyzing the product portfolios of major companies. These companies the performance on the basis of the performance and quality of their products. These data points were further validated by primary sources.
Secondary sources referred to for this research study included financial statements of companies offering radomes and information from various trade, business, and professional associations. The secondary data was collected and analyzed to arrive at the overall size of the radome market, which was validated by primary respondents.
Primary Research
Extensive primary research was conducted after acquiring information regarding the radome market scenario through secondary research. Several primary interviews were conducted with market experts from both the demand and supply sides across major countries of North America, Europe, Asia Pacific, Middle East and ROW which includes the Africa, and Latin America. Primary data was collected through questionnaires, emails, and telephonic interviews.

To know about the assumptions considered for the study, download the pdf brochure
Market Size Estimation
The market sizing of the market was undertaken from the demand side. The market was upsized at a regional level based on procurements and launches planned by country. Such procurements provide information on each application demand aspects of radome. For each application, all possible end users in radome market were identified.
Note: An analysis of technological, military funding, year-on-year launches, and operational cost were carried out to arrive at the CAGR and understand the market dynamics of all countries in the report. The market share for all size, operational orbit, component, application, and end user was based on the recent and upcoming launches of radome in every country from 2023 to 2028.
Radome Market Size: Bottom-up Approach

Radome Market Size: Top-Down Approach

Data Triangulation
After arriving at the overall size of the market, the total market was split into several segments and subsegments. The data triangulation and market breakdown procedures explained below were implemented wherever applicable, to complete the overall market engineering process and arrive at the exact statistics for various market segments and subsegments. The data was triangulated by studying various factors and trends from both, the demand and supply sides. Along with this, the market size was validated using both, the top-down and bottom-up approaches.
Country-wise deliveries of vehicles in different platform from 2023 to 2028 were considered for base data. Data was taken from the OEM manufacturers and various governing bodies of each country.
The following figure indicates the market breakdown structure and the data triangulation procedure implemented in the market engineering process used to develop this report.
Market Definition
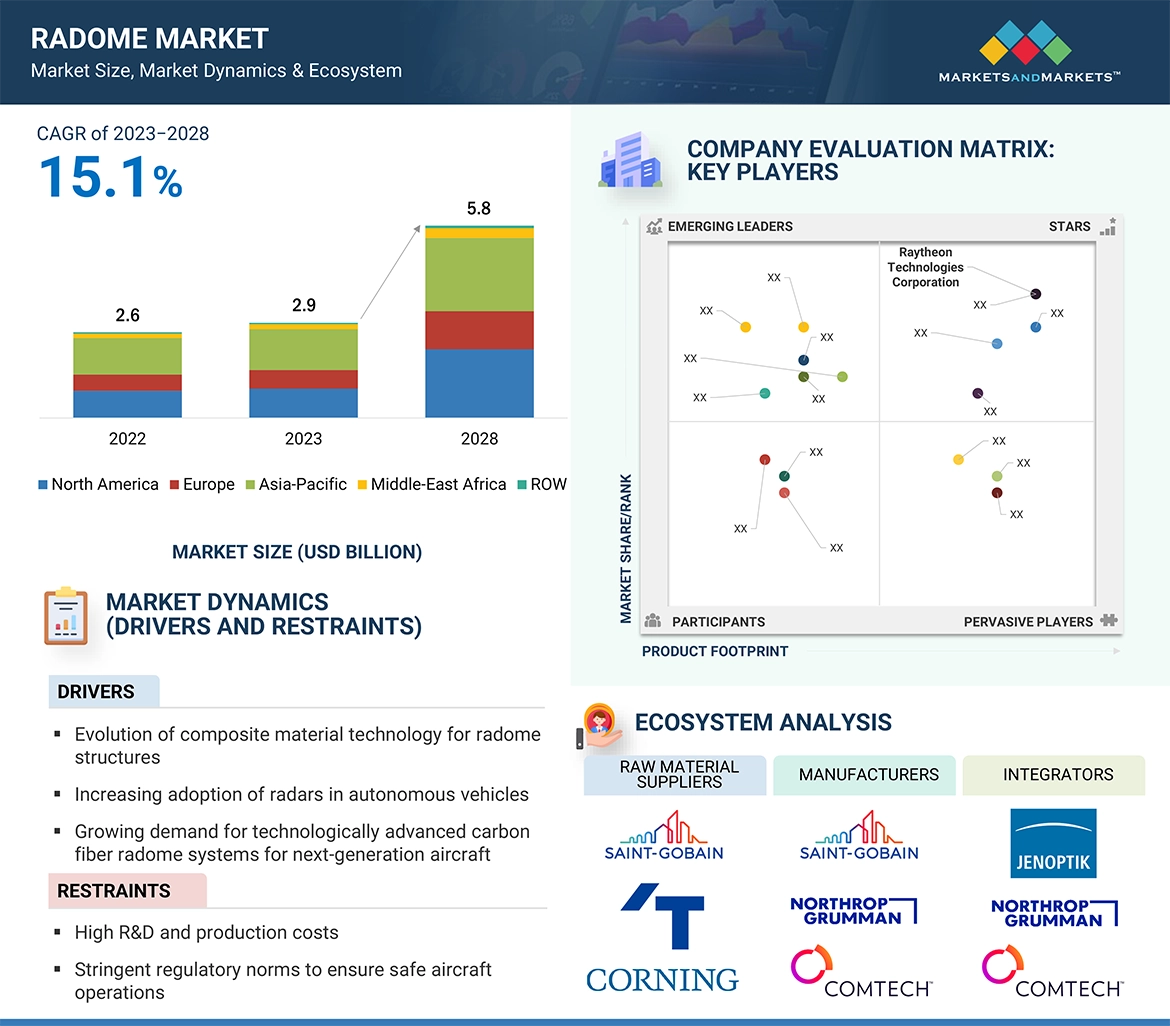
A radome is a geodesic, prefabricated structure designed to shield radar and antenna systems from harsh weather conditions, including wind, blowing sand, snow, ice, rain, ultraviolet sunlight, temperature fluctuations, fungus, and corrosion. Constructed from fiber-reinforced composites, radomes shield crucial antenna systems from environmental factors, withstand significant aerodynamic pressures, and provide optimal permeability for the necessary radio frequencies. Marine Radome are employed in ships and submarines to detect unidentified objects. Radome coated with anti-corrosive paints to guard against rust and ensure extended durability.
Radomes are governed by both government and commercial standards pertaining to their design, testing, and application. Various agencies and organizations are responsible for establishing and maintaining these benchmarks. For instance, the US military adheres to MIL-Spec and MIL-STD standards. On the federal level, entities such as the FAA uphold standards, and the FED-STD provides guidelines. Meanwhile, on the commercial front, standards are set and maintained by organizations like ASTM, ASME, ASCE, and ISO. Radome market expands globally and regions covered are North America, Europe, Asia Pacific, Middle east and the Rest of the World, which comprise countries with high expenditure.
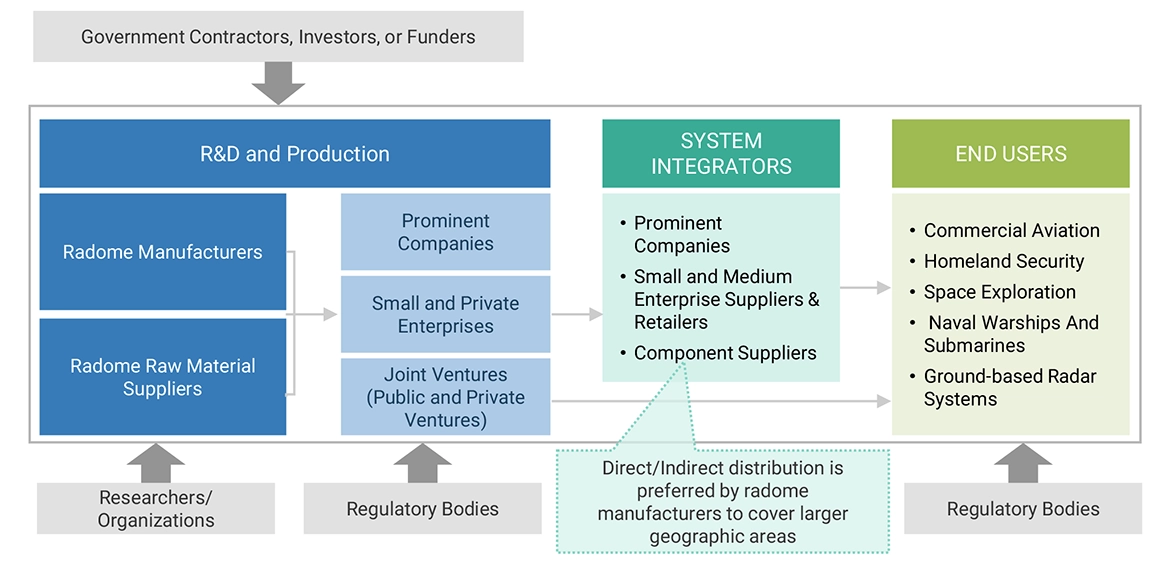
Market Stakeholders
-
Radome Manufacturers
-
Parts & Sub-Component Manufacturers
-
Maintenance, Repair, and Overhaul (MRO) Companies
-
Research Organizations, Forums, Alliances, and Associations
-
Providers of SATCOM Systems
-
Ministries of Defense
-
OEMs
-
Regulatory Bodies
-
R&D Companies
Report Objectives
-
To define, describe, and forecast the size of the radome market based on end user, domain, communication, components, and region from 2023 to 2028.
-
To forecast the size of various segments of the market with respect to major regions, namely, North America, Europe, Asia Pacific, Middle East and the Rest of the World (RoW), which comprises the Latin America
-
To identify and analyze key drivers, restraints, opportunities, and challenges influencing the growth of the radome market across the globe.
-
To strategically analyze micromarkets1 with respect to individual growth trends, prospects, and their contribution to the radome market.
-
To analyze opportunities for stakeholders in the market by identifying key market trends
-
To analyze competitive developments such as contracts, acquisitions and expansions, agreements, joint ventures and partnerships, new product launches, and Research & Development (R&D) activities in the radome market.
-
To provide a detailed competitive landscape of the -market, in addition to an analysis of business and corporate strategies adopted by leading market players.
-
To strategically profile key market players and comprehensively analyze their core competencies2.
Available Customizations
MarketsandMarkets offers the following customizations for this market report:
-
Additional country-level analysis of the Radome Market
-
Profiling of other market players (up to 5)
Product Analysis
-
Product matrix, which provides a detailed


Growth opportunities and latent adjacency in Radome Market