The study involves two major activities in estimating the current market size for the rail composites market. Exhaustive secondary research was done to collect information on the market, peer market, and parent market. The next step was to validate these findings, assumptions, and sizing with industry experts across the value chain through primary research. Both top-down and bottom-up approaches were employed to estimate the complete market size. After that, market breakdown and data triangulation were used to estimate the market size of segments and subsegments.
Secondary Research
Secondary sources referred to for this research study include financial statements of companies offering rail composites and information from various trade, business, and professional associations. Secondary research has been used to obtain critical information about the industry’s value chain, the total pool of key players, market classification, and segmentation according to industry trends to the bottom-most level and regional markets. The secondary data was collected and analyzed to arrive at the overall size of the rail composites market, which was validated by primary respondents.
Primary Research
Extensive primary research was conducted after obtaining information regarding the rail composites market scenario through secondary research. Several primary interviews were conducted with market experts from both the demand and supply sides across major countries of North America, Europe, Asia Pacific, and Rest of the World. Primary data was collected through questionnaires, emails, and telephonic interviews. The primary sources from the supply side included various industry experts, such as Chief X Officers (CXOs), Vice Presidents (VPs), Directors from business development, marketing, product development/innovation teams, and related key executives from rail composites industry vendors; system integrators; component providers; distributors; and key opinion leaders. Primary interviews were conducted to gather insights such as market statistics, data on revenue collected from the products and services, market breakdowns, market size estimations, market forecasting, and data triangulation. Primary research also helped in understanding the various trends related to type, application, and region. Stakeholders from the demand side, such as CIOs, CTOs, CSOs, and installation teams of the customer/end users who are using rail composites products were interviewed to understand the buyer’s perspective on the suppliers, products, component providers, and their current usage of rail composites and future outlook of their business which will affect the overall market.
The Breakup of Primary Research:

To know about the assumptions considered for the study, download the pdf brochure
Market Size Estimation
The research methodology used to estimate the size of the rail composites market includes the following details. The market sizing of the market was undertaken from the demand side. The market was upsized based on procurements and adoption in rail plastic composite products in different applications at a regional level. Such procurements provide information on the demand aspects of the rail composites industry for each application. For each application, all possible segments of the rail composites market were integrated and mapped.
Rail Composites Market Size: Botton Up Approach

To know about the assumptions considered for the study, Request for Free Sample Report
Rail Composites Market Size: Top-Down Approach

Data Triangulation
After arriving at the overall size from the market size estimation process explained above, the total market was split into several segments and subsegments. The data triangulation and market breakdown procedures explained below were implemented, wherever applicable, to complete the overall market engineering process and arrive at the exact statistics for various market segments and subsegments. The data was triangulated by studying various factors and trends from the demand and supply sides. Along with this, the market size was validated using both the top-down and bottom-up approaches.
Market Definition
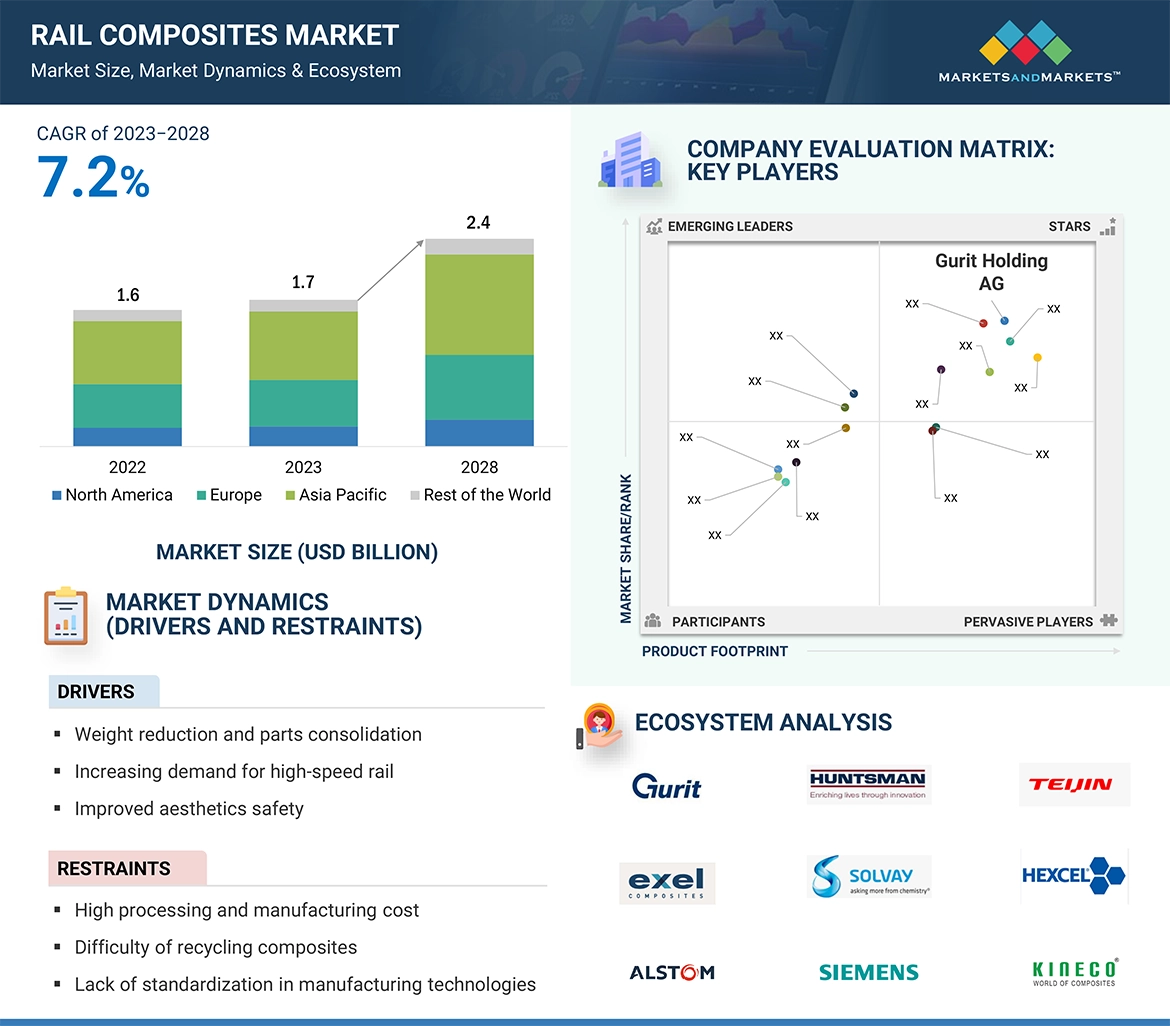
A composite is a combination of two or more materials that have better properties than those of the individual components. It is a blend of least two immiscible components, with different structures, whose individual features combine to provide improved performance. Composites are formed by a combination of a matrix and reinforcement. In a composite, fibers are reinforced and are used to fortify the matrix in terms of strength and stiffness. The reinforcement fibers can be cut and aligned in different ways to affect the properties of the resulting composites. The matrix, normally, a form of resin, keeps the reinforcement in the desired orientation and also protects the reinforcement from chemical and environmental attack. The composites that gets used in rail exterior, interior, structural and other rail applications are considered as rail composites.
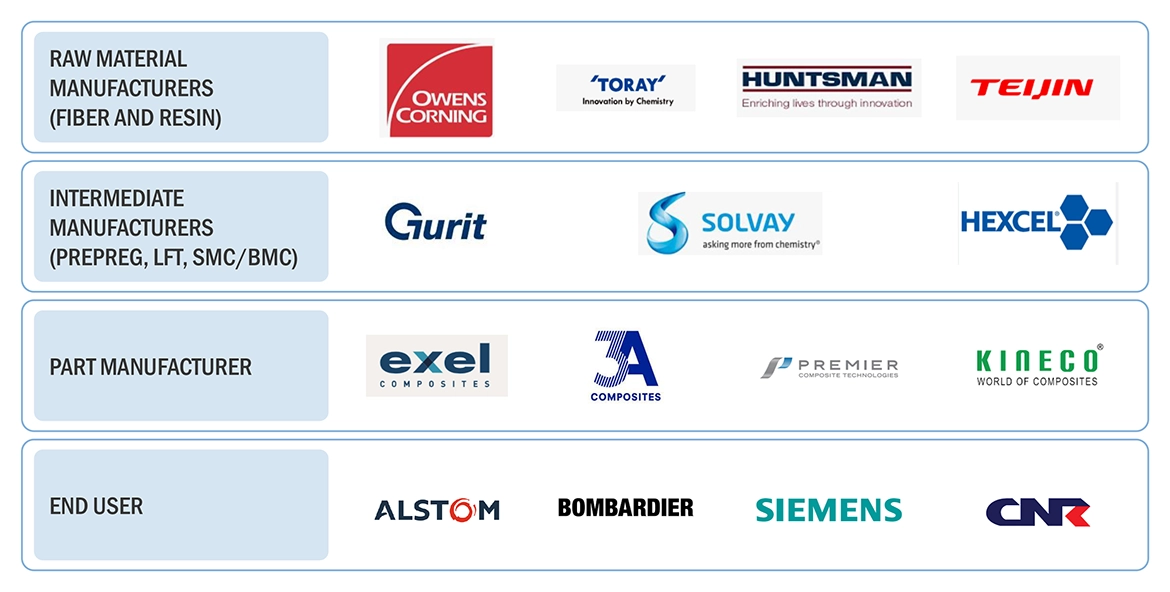
Key Stakeholders
-
Rail Composites Manufacturers
-
Raw Materials Suppliers
-
Distributors and Suppliers
-
End-use Applications
-
Industry Associations
-
R&D Institutions
-
Environment Support Agencies
Report Objectives
-
To define, describe, and forecast the rail composites market size in terms of volume and value
-
To provide detailed information regarding the key factors, such as drivers, restraints, opportunities, and challenges influencing market growth
-
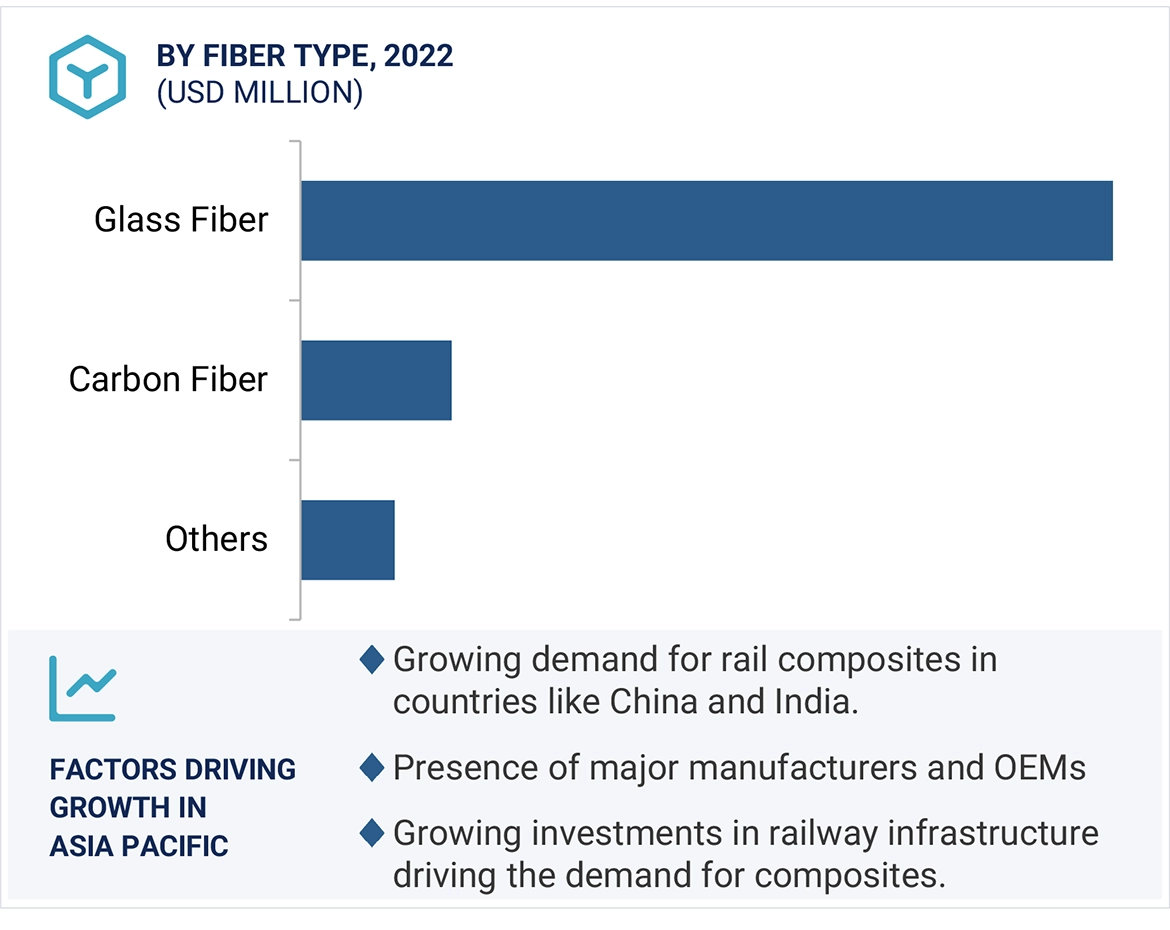
To analyze and project the global rail composites market by fiber type, resin type, manufacturing process, application, and region
-
To forecast the market size concerning five main regions (along with country-level data), namely, North America, Europe, Asia Pacific, Rest of the World, and analyze the significant region-specific trends
-
To strategically analyze micromarkets with respect to individual growth trends, prospects, and contributions of the submarkets to the overall market
-
To analyze the market opportunities and the competitive landscape for stakeholders and market leaders
-
To assess recent market developments and competitive strategies, such as agreements, contracts, acquisitions, and new product developments/new product launches, to draw the competitive landscape
-
To strategically profile the key market players and comprehensively analyze their core competencies
Available Customizations
MarketsandMarkets offers following customizations for this market report:
Additional country-level analysis of the rail composites market
Product Analysis
-
Product matrix, which provides a detailed comparison of the product portfolio of each company's market


Growth opportunities and latent adjacency in Rail Composites Market