
Rare Earth Magnets Market

Rare Earth Magnets Market by Type (NdFeB, SmCo), Manufacturing Process (Sintered, Bonded), End-use Industry (Automotive, Consumer Electronics, Aerospace & Defense, Energy, Industrial, Other End-use Industries), and Region - Global Forecast to 2030


RARE EARTH MAGNETS MARKET OVERVIEW
Source: Secondary Research, Interviews with Experts, MarketsandMarkets Analysis
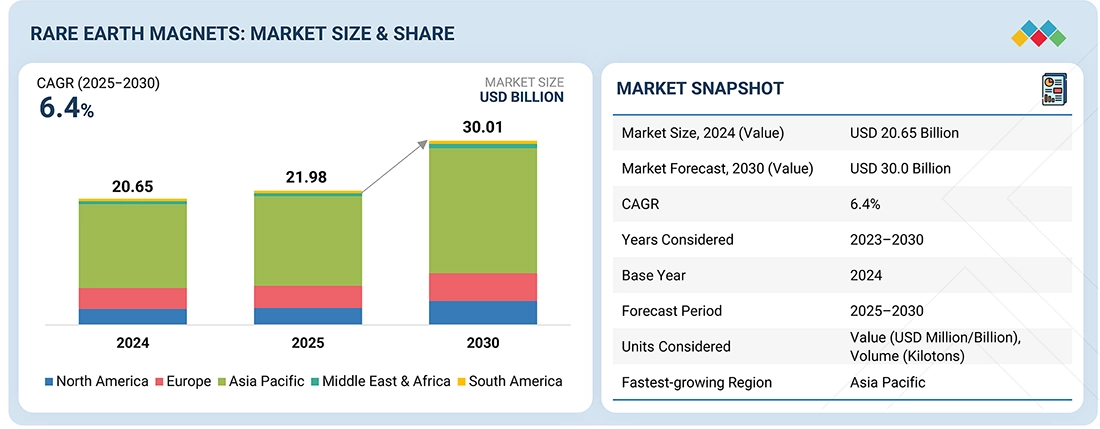
The rare earth magnets market is projected to reach USD 30.01 billion by 2030 from USD 21.98 billion in 2025, at a CAGR of 6.4%. The market is divided into types, including NdFeB and SmCo magnets. Neodymium-iron-boron (NdFeB) magnets are increasingly popular due to their high magnetic strength and effectiveness in high-performance applications. The market is expanding as these magnets are employed in consumer electronics, robots, wind turbines, and electric vehicles.
KEY TAKEAWAYS
-
BY TYPEThe rare earth magnets market comprises NdFeB and SmCo magnets. NdFeB magnets are estimated to account for a larger market share due to their exceptionally strong magnetic power and high performance application efficiency.
-
BY MANUFACTURING PROCESSIn terms of the manufacturing process, the market is segmented into sintered and bonded. The sintered manufacturing process for rare earth magnets is widely used because it produces magnets that are stronger, more stable at higher temperatures, and have a more uniform structure than bonded magnets.
-
BY END-USE INDUSTRYThe rare earth magnets market is segmented by end-use industry, which includes automotive, consumer electronics, aerospace & defense, industrial, energy, and other end-use industries. The use of rare earth magnets in the automotive industry is growing because of the quick shift to electric and hybrid vehicles.
-
BY REGIONThe aerospace materials market covers Europe, North America, Asia Pacific, South America, the Middle East, and Africa. Asia Pacific is projected to lead the global market of rare earth magnets because of its manufacturing base mainly in China, Japan, and South Korea, where both producers and end-use industries are located.
-
COMPETITIVE LANDSCAPEMajor market players have adopted both organic and inorganic strategies, including partnerships and expansions. For instance, Proterial, Ltd. (Japan), Shin-Etsu Chemical Co., Ltd. (Japan), TDK Corporation (Japan), and VACUUMSCHMELZE (Germany) have entered into many agreements and partnerships to cater to the growing demand for rare earth magnets across end-use industries.
Rising EV adoption, expansion of wind energy, and a push for supply chain security of rare earth magnets are expected to drive market growth. New deals and developments, including strategic partnerships between OEMs and material suppliers, investments in recycling technologies, and innovations in products, are reshaping the industry landscape.
TRENDS & DISRUPTIONS IMPACTING CUSTOMERS' CUSTOMERS
Key trends in rare earth magnets include a projected shift in revenue mix toward new technologies and emerging applications such as EVs, automation, drone systems, renewable energy, and AI-driven solutions. Future growth will be driven by ecosystem expansion, magnet recycling, and disruptive innovations like quantum magnetic computing and autonomous vehicles. The market’s focus is rapidly evolving from established uses to advanced, high-growth sectors and new use cases.
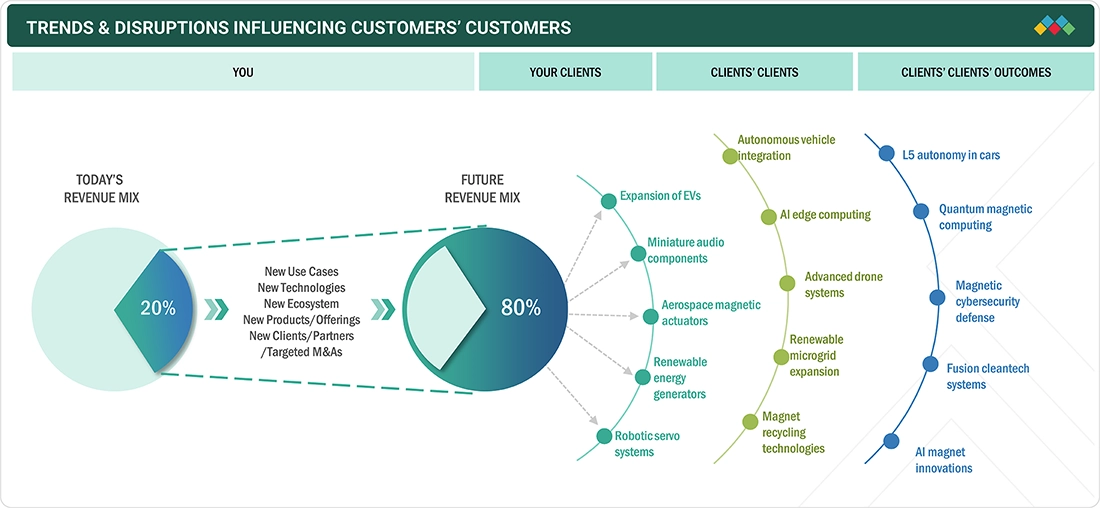
Source: Secondary Research, Interviews with Experts, MarketsandMarkets Analysis
RARE EARTH MAGNETS MARKET DYNAMICS
Level
-
Electric mobility growth

-
Expansion of wind energy

Level
-
Raw material price volatility

-
Environmental effects of rare earth magnets

Level
-
Diversification in rare earth magnets production

-
Recycled rare earth magnets

Level
-
Regulatory and trade obstacles

-
Scaling, infrastructure, and capital costs

Source: Secondary Research, Interviews with Experts, MarketsandMarkets Analysis
Driver: Electric mobility growth
The main element that explains the substantial demand for rare earth magnets is the exponential use of electrified mobility, largely in the automotive sector, that has occurred in recent years. The higher the number of electric vehicles (EVs) in the market, the greater the need for these magnets to be of high quality in electric motors. These magnets, especially those of neodymium-iron-boron (NdFeB), are very helpful to improve the effectiveness and power density of electric motors. Thus, the global call to deliver environmentally friendly transportation solutions and to lessen the transport sector emissions is the underlying reason for the demand for EVs and, thus, rare earth magnets.
Restraint: Raw material price volatility
An important challenge that the rare earth magnets industry has to deal with is the highly changeable prices of the raw materials, which especially applies to essential elements like neodymium, dysprosium, and terbium. These materials are obtained from only a few countries, and as a result, the supply chain is affected by the conflicts between these countries, changes in regulations, and the ups and downs of the market. The fact that most of the production is in countries like China leads to a dependency that brings about considerable fluctuations in prices. Such price volatility can affect companies' production and pricing strategies, which leads to uncertainty in their long-term planning and inhibits stable market conditions from forming. It takes some cost to the environment to extract and purify these materials, and that is another factor making the price less stable. Therefore, the frequent, drastic price changes that have been observed have been a limiting factor for the economic side and the sustainability of the rare earth magnets.
Opportunity: Diversification in rare earth magnets production
As nations apart from China widen their mining and processing capacities to satisfy the global demand, the diversification of rare earth production becomes a major opportunity. Australia is progressing with such projects as the Kalgoorlie Rare Earths Processing Facility, which is backed by the government. In the US, the collaboration of MP Materials with the Department of Defense is a way to lessen the dependence on foreign sources. The Southeast Asian countries like Malaysia, Thailand, and Vietnam that are also becoming the main players of the rare earth supply chain because of the demand for electric vehicles and the tech sectors. Such initiatives increase the variety of supply sources and the capability of the global economy to withstand crises.
Challenge: Scaling, infrastructure, and capital costs
There are difficulties in increasing the production of rare earth magnets caused by the expensive and large-scale infrastructure and capital costs. The entire process of mining, refining, and manufacturing demands a heavy investment in specialized equipment and facilities that are designed for precision manufacturing. Obtaining capital for the construction and upkeep of such infrastructures can be a hindrance, particularly for newcomers. Meeting environmental and regulatory standards also complicates the matter. The high costs of research, development, and technology scaling can be a situation where few investors choose to invest. Nevertheless, the substantial demand for these products in the electrification and renewable energy sectors is still a strong reason to get past these obstacles.
Rare Earth Magnets Market: COMMERCIAL USE CASES ACROSS INDUSTRIES
| COMPANY | USE CASE DESCRIPTION | BENEFITS |
|---|---|---|
 |
The development of permanent magnet alloys based on SmCo and new joining technologies for cobalt-iron laminations is aimed at enhancing power density and reducing weight for sustainable transportation. | Electric motors with greater power density, reduced size and weight, minimal eddy current losses, and a scalable manufacturing process enable widespread adoption and enhanced sustainability. |
 |
Development and commercialization of NMX-F1SH-HF and NMX-G1NH-HF neodymium sintered magnets, designed for high temperature performance without relying on heavy rare earths like terbium and dysprosium. | Magnets with high heat resistance, high magnetic flux, and coercivity offer improved motor performance while mitigating resource depletion risks and reducing environmental impacts. |
 |
The development of EcoFlux magnets uses a proprietary process that eliminates harmful mining practices and reduces energy consumption, integrating magnet-to-magnet recycling with 100% post-consumer rare earth material. | They offer magnets with high magnetic performance, reduced environmental impact, 20% less heavy rare earth element content, and the potential for large-scale, closed-loop recycling. |
Logos and trademarks shown above are the property of their respective owners. Their use here is for informational and illustrative purposes only.
RARE EARTH MAGNETS MARKET ECOSYSTEM
The rare earth magnets market comprises a considerable number of suppliers, producers, and industries. The process begins with companies mining and refining rare earth elements such as neodymium, dysprosium, and samarium. These are then delivered to magnet manufacturers, who produce high-performance NdFeB and SmCo magnets through advanced techniques like alloying and coating. Distributors and component suppliers facilitate the connection between manufacturers and original equipment manufacturers (OEMs) by providing the necessary logistics and quality control. Sectors like electric vehicles, wind energy, consumer electronics, robotics, and aerospace are the major users of these efficient and compact magnet solutions.
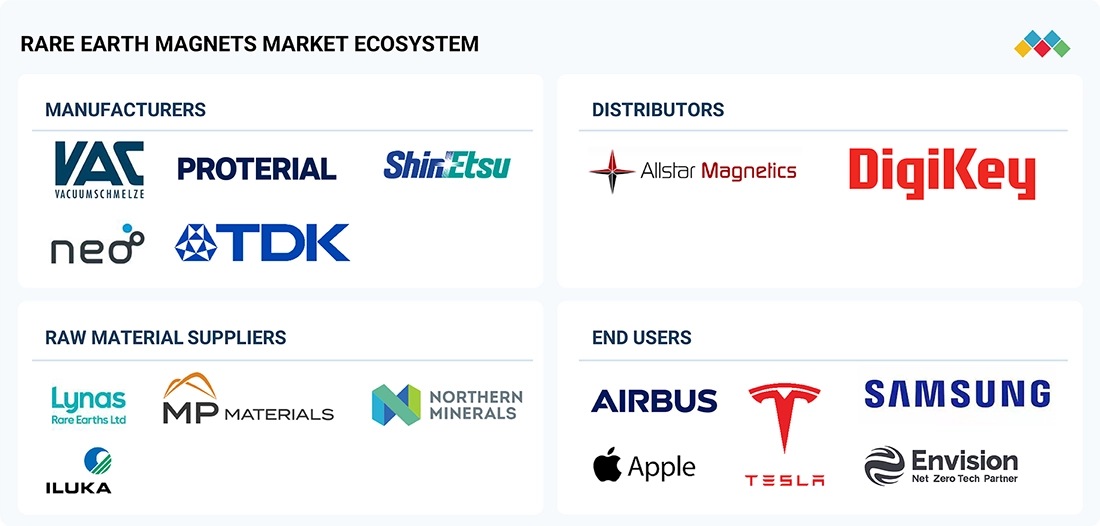
Logos and trademarks shown above are the property of their respective owners. Their use here is for informational and illustrative purposes only.
RARE EARTH MAGNETS MARKET SEGMENTS
Source: Secondary Research, Interviews with Experts, MarketsandMarkets Analysis
Rare Earth Magnets Market, by Type
As of 2024, NdFeB is the leading material in the rare earth magnets market and is expected to maintain its dominance through 2025. The demand for neodymium-iron-boron (NdFeB) magnets is rising due to their powerful magnetic capabilities and their efficiency in high-performance uses. The market is expanding as these magnets find applications in consumer electronics, robotics, wind energy systems, and electric vehicles. Lightweight and strong magnets like NdFeB are becoming essential in the production of motors and generators in response to the global shift toward clean energy and electrification.
Rare Earth Magnets Market, by Manufacturing Process
In 2024, the sintered manufacturing process was the leading method for producing rare earth magnets. This process is popular because it produces magnets with stronger magnetic power, better resistance to heat, and a more consistent structure than bonded types. Sintering allows for accurate control of how the magnet’s grains are aligned, resulting in improved magnetic performance. This method is especially effective for high-performance uses, such as in electric vehicles, wind turbines, and industrial motors, making it the top choice around the world.
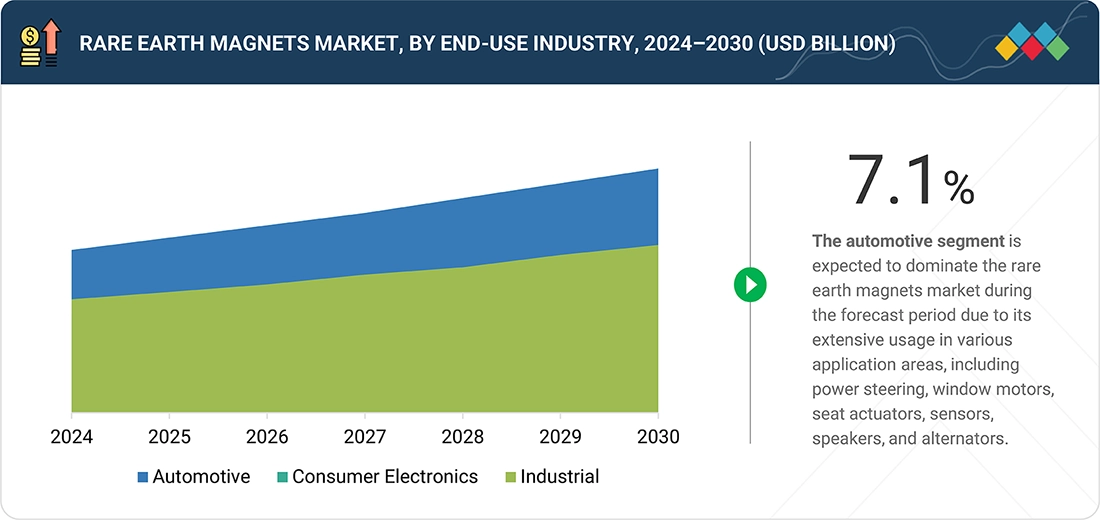
Rare Earth Magnets Market, by End-use Industry
The rare earth magnets market is projected to be led by the automotive sector. The rising adoption of rare earth magnets in the automotive industry is driven by the rapid transition to electric and hybrid vehicles. These magnets, particularly the NdFeB variety, are essential for high-efficiency electric motors. They enhance power density, efficiency, and compactness. They contribute to lighter designs, enhance energy efficiency, and enable features like regenerative braking and power steering, making them vital for contemporary mobility systems.
REGION
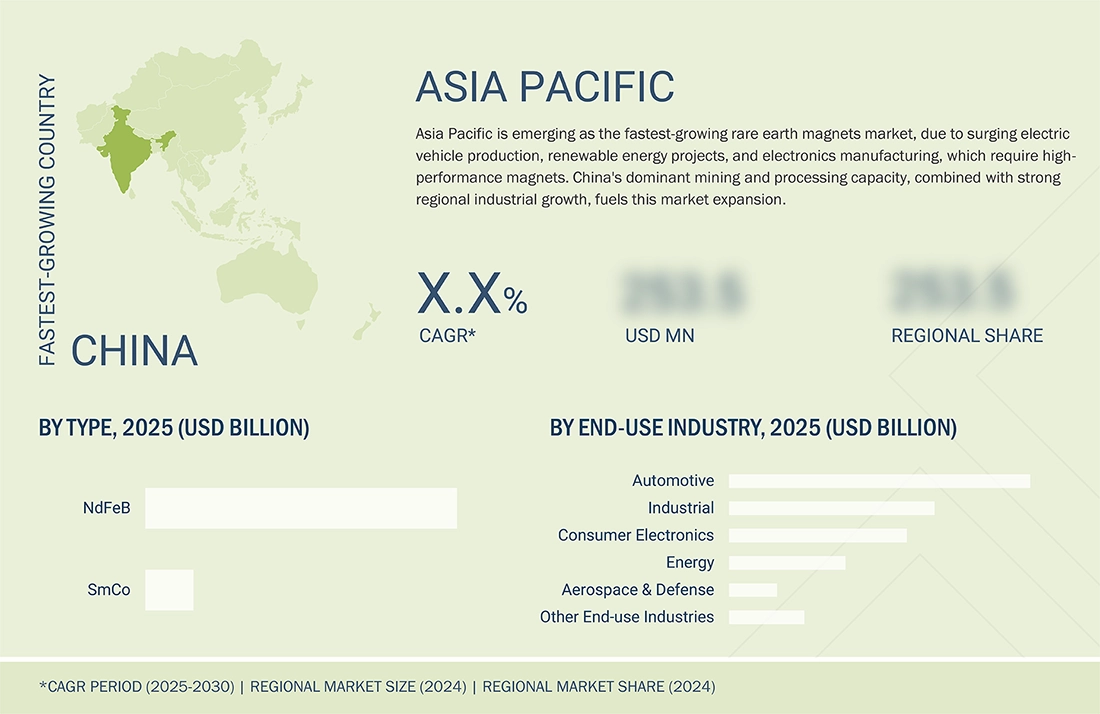
Asia Pacific to be fastest-growing region in global rare earth magnets market during forecast period
The Asia Pacific region is estimated to dominate the global market for rare earth magnets due to its manufacturing hubs primarily located in China, Japan, and South Korea, where both manufacturers and end-user industries are situated. The rapid industrial growth and the surge in electric vehicle (EV) development in the region, especially in China, drive a significant demand for rare earth magnets. This consumption is further heightened by the flourishing electronics and renewable energy industries. The expansion is supported by government initiatives focused on clean energy and electric transportation. Additionally, China's abundant rare earth resources and its robust refining capabilities render the region highly competitive on a global scale.
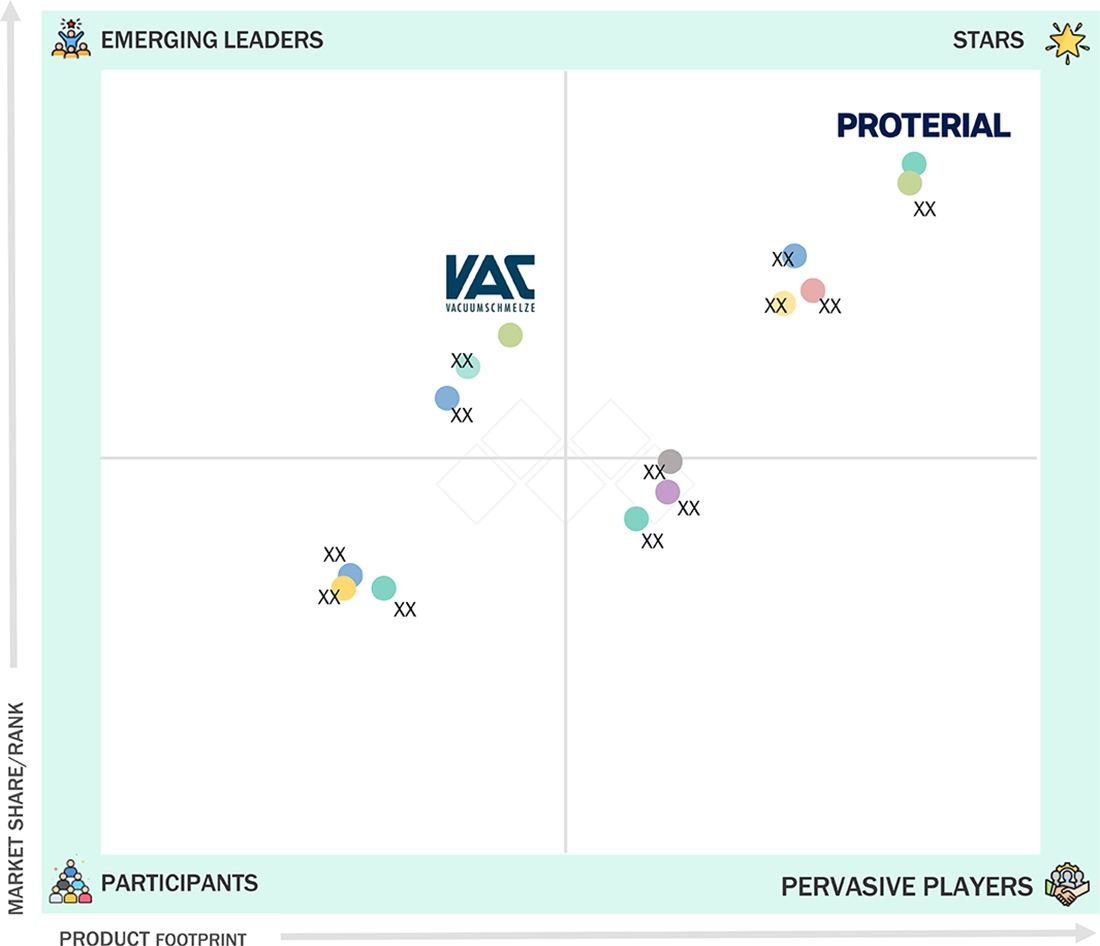
Rare Earth Magnets Market: COMPANY EVALUATION MATRIX
In the rare earth magnets market matrix, Proterial, Ltd. (Star) leads with a strong market share and extensive product footprint, driven by its advanced products and huge international market presence. VACUUMSCHMELZE (Emerging Leader) is gaining visibility with its expertise in magnetic technology, which has a wide range of applications in many industries. While Proterial, Ltd. dominates through scale and a diverse portfolio, VACUUMSCHMELZE shows significant potential to move toward the leaders’ quadrant as demand for high-strength rare earth magnets continues to rise.
Source: Secondary Research, Interviews with Experts, MarketsandMarkets Analysis
RARE EARTH MAGNETS MARKET PLAYERS
RARE EARTH MAGNETS MARKET SCOPE
| REPORT METRIC | DETAILS |
|---|---|
| Market Size, 2024 (Value) | USD 20.65 Billion |
| Market Forecast, 2030 (Value) | USD 30.01 Billion |
| Growth Rate | CAGR of 6.4% from 2025 to 2030 |
| Years Considered | 2023–2030 |
| Base Year | 2024 |
| Forecast Period | 2025–2030 |
| Units Considered | Value (USD Million/Billion), Volume (Kiloton) |
| Report Coverage | Revenue Forecast, Company Ranking, Competitive Landscape, Growth Factors, and Trends |
| Segments Covered |
|
| Regions Covered | North America, Asia Pacific, Europe, South America, Middle East & Africa |
WHAT IS IN IT FOR YOU: Rare Earth Magnets Market REPORT CONTENT GUIDE

DELIVERED CUSTOMIZATIONS
We have successfully delivered the following deep-dive customizations:
| CLIENT REQUEST | CUSTOMIZATION DELIVERED | VALUE ADDS |
|---|---|---|
| NdFeB Magnet Recycling Potential in Malaysia |
|
|
RECENT DEVELOPMENTS
- July 2025 : The company developed high-performance, heavy-rare-earth-free neodymium sintered magnets NMX-F1SH-HF and NMX-G1NH-HF for electric vehicle (EV) driving motors. These magnets offer enhanced heat resistance and magnetic properties, reducing reliance on scarce heavy rare earths and contributing to energy efficiency and CO2 emission reductions.
- June 2025 : TDK Corporation signed a memorandum of agreement with Siemens Gamesa under the Japan METI public-private framework to supply permanent magnets for wind turbines. This helped improve TDK Corporation's profile in the industry, as it supplies magnets for such emerging applications.
- January 2023 : VACUUMSCHMELZE signed a binding long-term supply agreement with General Motors to build a facility in North America for producing permanent magnets for EVs (e.g., Silverado EV, LYRIQ, Hummer) using locally sourced raw materials. The binding agreement finalized the MoU announced by VACUUMSCHMELZE and General Motors in December 2021.
Table of Contents
 Exclusive indicates content/data unique to MarketsandMarkets and not available with any competitors.
Methodology
The study involved four major activities to estimate the current size of the global rare earth magnets market. Exhaustive secondary research was carried out to collect information on the market, the peer product market, and the parent product group market. The next step was to validate these findings, assumptions, and sizes with the industry experts across the value chain of rare earth magnets through primary research. The top-down and bottom-up approaches were employed to estimate the overall size of the rare earth magnets market. After that, market breakdown and data triangulation procedures were used to determine the size of different market segments.
Secondary Research
The market for the companies offering rare earth magnets is arrived at by secondary data available through paid and unpaid sources, analyzing the product portfolios of the major companies in the ecosystem, and rating the companies by their performance and quality. Various secondary sources, such as Business Standard, Bloomberg, World Bank, and Factiva, were referred to in order to identify and collect information for this study on the rare earth magnets market. In the secondary research process, various secondary sources were referred to identify and collect information related to the study. Secondary sources included annual reports, press releases, and investor presentations of rare earth magnets vendors, forums, certified publications, and whitepapers. The secondary research was used to obtain critical information on the industry’s value chain, the total pool of key players, market classification, and segmentation from the market and technology-oriented perspectives.
Primary Research
In the primary research process, various primary sources from both the supply and demand sides were interviewed to obtain qualitative and quantitative information for this report. The primary sources from the supply side included industry experts, such as Chief Executive Officers (CEOs), Vice Presidents (VPs), marketing directors, technology and innovation directors, and related key executives from several key companies and organizations operating in the rare earth magnets market. After the complete market engineering (calculations for market statistics, market breakdown, market size estimations, market forecasting, and data triangulation), extensive primary research was conducted to gather information and verify and validate the critical numbers arrived at. Primary research was also conducted to identify the segmentation types, industry trends, competitive landscape of rare earth magnets offered by various market players, and key market dynamics, such as drivers, restraints, opportunities, challenges, industry trends, and key player strategies. In the complete market engineering process, the top-down and bottom-up approaches and several data triangulation methods were extensively used to perform the market estimation and market forecasting for the overall market segments and subsegments listed in this report. Extensive qualitative and quantitative analysis was performed on the complete market engineering process to list the key information/insights throughout the report.
The following is the breakdown of primary respondents:

Notes: Other designations include sales, marketing, and product managers.
Tier 1: Greater than USD 1 Billion; Tier 2: Between USD 500 million and USD 1 Billion; and Tier 3: Less than USD 500 million
To know about the assumptions considered for the study, download the pdf brochure
Market Size Estimation
The top-down and bottom-up approaches were used to estimate and validate the size of the global rare earth magnets market. These approaches were also used extensively to estimate the size of various dependent market segments. The research methodology used to estimate the market size included the following:

Data Triangulation
After arriving at the overall market size using the market size estimation processes, the market was split into several segments and subsegments. The data triangulation procedure was employed, wherever applicable, to complete the overall market engineering process and arrive at the exact statistics of each market segment and subsegment. The data was triangulated by studying various factors and trends from both the demand and supply sides.
Market Definition
According to the Rare Earths Industry Association, rare-earth elements (REE) are a group of 17 elements on the periodic table, consisting of the lanthanoid series, and scandium and yttrium. Rare earth magnets are composed of these rare earth metals and elements, specifically categorized into two main types: neodymium magnets (NdFeB) and samarium cobalt magnets (SmCo). Each type has distinct characteristics that make it suitable for different applications. These magnets are popular for their remarkably strong magnetic fields, which significantly exceed those of traditional magnets. Additionally, they exhibit a high level of magnetic longevity, meaning they retain their magnetism over time. Due to these properties, rare earth magnets are widely utilized in advanced technologies, including electric vehicles, wind turbines, and various medical devices.
Stakeholders
- Raw material suppliers
- Rare earth magnet manufacturers
- Manufacturing technology providers
- Industry associations
- Mining associations
- Traders, distributors, and suppliers
- Non-governmental organizations (NGOs), government and regional agencies, and research organizations
Report Objectives
- To define, describe, and forecast the size of the global rare earth magnets market based on type, manufacturing process, end-use industry, and region in terms of value and volume
- To provide detailed information on the significant drivers, restraints, opportunities, and challenges influencing the market
- To strategically analyze micromarkets concerning individual growth trends, prospects, and their contribution to the market
- To assess the growth opportunities in the market for stakeholders and provide details on the competitive landscape for market leaders
- To forecast the market size of segments for North America, Europe, Asia Pacific, South America, and the Middle East & Africa
- To strategically profile key players and comprehensively analyze their market shares and core competencies
- To analyze competitive developments such as product launches, expansions, partnerships, and acquisitions in the rare earth magnets market
- To provide the impact of AI on the market
Key Questions Addressed by the Report
What is driving growth for rare earth magnets market?
The rare earth magnets industry is in a phase of high growth with the is projected to be $21.98 billion in 2025 and reach $30.01 billion by 2030, at a CAGR of 6.4%. These magnets primarily Neodymium Iron Boron (NdFeB) and Samarium Cobalt (SmCo) - are indispensable for electric vehicles, offshore wind farms, consumer electronics, and defense applications.
How rare earth magnets are produced?
They are produced mainly via sintered processes that align grains for superior magnetic strength, heat resistance, and uniformity.
What are the features of rare earth magnets?
NdFeB (neodymium) magnets dominate due to their exceptional power, while SmCo provides high-temperature stability.
Why rare earth magnets market is growing?
Rising EV adoption, wind energy expansion, and supply chain diversification from China drive the market to $30B by 2030.
How China is dominating rare earth magnets market?
China controls 90% of processing due to rich resources and refining expertise, causing price volatility elsewhere.
Need a Tailored Report?
Customize this report to your needs
Get 10% FREE Customization
Customize This ReportPersonalize This Research
- Triangulate with your Own Data
- Get Data as per your Format and Definition
- Gain a Deeper Dive on a Specific Application, Geography, Customer or Competitor
- Any level of Personalization
Let Us Help You
- What are the Known and Unknown Adjacencies Impacting the Rare Earth Magnets Market
- What will your New Revenue Sources be?
- Who will be your Top Customer; what will make them switch?
- Defend your Market Share or Win Competitors
- Get a Scorecard for Target Partners

Custom Market Research Services
We Will Customise The Research For You, In Case The Report Listed Above Does Not Meet With Your Requirements
Get 10% Free CustomisationTESTIMONIALS

We at Nissan Chemicals Corporation have been clients of MarketsandMarkets for more than a year now. We recently consulted MarketsandMarkets for a study, the team at MarketsandMarkets was extremely professional and organized. The business insights were very detailed and aligned well with our expectations that really helped us formulate the Business Plans and device new strategies for development themes. MarketsandMarkets offers a unique combination of expertise and dedicated engagement model. Their research findings have helped us in designing our Pricing Strategy which will make it easier for us to predict the future sales and profits for the next ten years. We look forward to working with MarketsandMarkets in the future.
VP of Strategy & New Business Development
Leading Specialty Chemical Company
The MarketsandMarkets Engagement Model, composed of both the Knowledge Store and advisory custom research, has greatly helped us in understanding our markets and making strategic decisions. The Knowledge Store is a fast way to allow everyone in our organization to understand more about most any market they are interested in. The ability to then get custom research done and get answers to specific strategic questions and market insight has been spectacular. The Markets and Markets team feel more like colleagues than vendors and their services have helped us change our culture where statements of things like growth opportunities and competitive position are always backed by industry research.

Rich Gibson,
Director, Corporate Strategy
Milliken & Company,
Leading Industrial Manufacturer of specialty chemical, floor covering, performance and protective textile materials, and healthcaremilliken.com
MarketsandMarkets is a trusted resource that helps us to better understand markets that are near-adjacencies-whether its technology, value chain or geography. Their Knowledge Store platform provides a dashboard of markets and their characteristics which is easy to use and saves us time.
Adam Shaw,
Market Development and Strategy Manager
AdvanSix Inc. USA,
An American Leader in Chemicalswww.advansix.com
The Knowledge Store from MarketsandMarkets is a valuable tool which has helped my team acquire greater insight in to the end markets that our business serves. This has enabled us to help our company build stronger strategies throughout our planning process.
TOSHIO KINOSHITA
Senior Chif Consultion Research & Consulting Division
Mitsubishi Chemical Research Corporation,
Leading Manufacturer of Chemical Productswww.mitsubishichem-res.co.jp/en/

We recently engaged with MarketsandMarkets for a study, the team not only clearly understood our business objectives but was also extremely professional in the way they handled the entire project. The study was efficiently conducted in a phase-wise manner, and the engagement model furnished us with high-quality business insights that far exceeded our expectations at each phase. We were especially happy that MarketsandMarkets could provide us with both, an English as well as a Japanese version of the study. A special thanks to the Analyst Team and Client Services Team, whose fluency in Japanese enhanced our comfort level, as we could converse with them in our preferred language.
Independent entrepreneurs
Arrow Precision
We approached MarketsandMarkets for study on Proppants Market, and their work exceeded our expectations. The study conducted was comprehensive and enabled us to view the market through the various dimensions. In addition, the team was extraordinarily responsive throughout the process and resolved our queries on time. I strongly recommend MarketsandMarkets and will certainly consider them for additional market assessments we will need in the future.
Global engineering company, Japan
Deputy Manager,
Strategic Planning OfficeThe high-quality insights shared by the MarketsandMarkets team helped us understand the pharmaceutical plant designers in a specific geography. It also captured the risks that we may likely face in communicating with our potential partners. The study would enable us identify partners, which would impact our future growth.


Growth opportunities and latent adjacency in Rare Earth Magnets Market