Smart Locker Market

Smart Locker Market Size, Share, Statistics and Industry Growth Analysis Report by Offering (Hardware, Software, Services), Technology (RFID, Electronic, Mobile, Biometric, Cloud), Deployment (Indoor, Outdoor), Application (Day, Parcel, Staff, Asset Management), End-Use Industry, Region - Global Forecast to 2028

Report Code: SE 8856 Nov, 2023, by marketsandmarkets.com

[205 Pages Report] The global Smart Locker Market Size was valued at USD 2.1 billion in 2023 and is estimated to reach USD 3.6 billion by 2028, registering a CAGR of 11.6% during the forecast period.

The growth of the Smart lockers Industry is propelled by the surge in e-commerce activities, increasing urbanization and population density, demand for contactless solutions, and advancements in technology such as IoT and RFID integration. These factors collectively drive the adoption of smart lockers, offering secure and efficient parcel delivery solutions in response to last-mile delivery challenges and the need for streamlined package management.

Smart Locker Market

Smart Locker Market

Smart Locker Market Forecast to 2028

To know about the assumptions considered for the study, Request for Free Sample Report

Market Dynamics:

Driver: Growth in e-commerce, retail, and logistics application for parcel management

The Smart Locker Market Growth in e-commerce, retail, and logistics applications is a significant driver propelling the market. With the ever-increasing popularity of online shopping, there is a growing need for efficient, secure, and convenient package management solutions. Smart lockers have become an indispensable tool for e-commerce companies, ensuring that packages are securely delivered to customers, even in their absence. For instance, Amazon Locker, operated by Amazon, utilizes smart lockers to enable customers to pick up their online purchases at convenient locations, providing a prime example of the retail sector embracing this technology. In the logistics industry, companies like UPS and FedEx have adopted smart locker systems for parcel drop-off and pickup, streamlining the last-mile delivery process. Moreover, the retail sector is also reaping the benefits of smart lockers, as they provide an efficient way for customers to collect online or in-store products, enhancing the overall shopping experience. Companies like Luxer One and Cleveron offer smart locker solutions tailored to these applications, addressing the growing demands of e-commerce, retail, and logistics for secure and convenient package management.

Restraint:  High initial investment costs

High initial investment costs are a significant restraint in the smart locker market, comprising various financial considerations that can deter potential adopters. The expense encompasses acquiring hardware components such as lockers, electronic locks, and sensors, with costs increasing as the system’s size and complexity grow. Software development and integration add another expenditure layer, especially if customization is needed to meet specific requirements. Setting up the necessary infrastructure, including power supply and internet connectivity, presents further financial challenges. Installation, configuration, and training require specialized skills and can incur additional costs. Moreover, ongoing operational expenses, such as maintenance and software updates, must be factored in. Scalability considerations and return on investment (ROI) calculations are essential but can be impacted by high upfront costs, potentially delaying the realization of benefits. Smaller businesses may need more money to invest in smart locker technology. However, as the market evolves and competition increases, there’s a growing trend toward cost reductions and more accessible pricing models, which may alleviate some of these financial constraints over time.

Opportunity: Rapid urbanization in emerging nations

As per the report of United Nations that is published in 2018, the global urban population is expected to increase to 4.46 billion in 2021 and is expected to reach 6.68 billion by 2050. The smart lockers market is expected to experience significant growth due to rapid urbanization in emerging countries. As urban areas expand and populations concentrate in cities, the demand for efficient and secure parcel delivery solutions is on the rise. Smart lockers, with their ability to streamline package management, provide a convenient and technologically advanced solution for urban dwellers. The expansion of e-commerce, coupled with the challenges of last-mile delivery in densely populated urban environments, further amplifies the need for smart lockers. These lockers offer a practical and space-efficient way to address the evolving demands of urban lifestyles, making them a key driver in the growing market for smart locker particularly in technologically advancing countries such as the US, Germany, the UK, and China.

Challenge: Space and Installation Challenges

Installing smart locker systems requires sufficient physical space to accommodate the lockers and related infrastructure. Space constraints can be a significant issue in some settings, particularly in densely populated urban environments, small businesses, or residential buildings with limited common areas. The availability of space for locker placement may be restricted, making it challenging to implement smart locker systems. In cases where space is limited or not initially designed for smart locker installation, retrofitting existing spaces can be costly and complex. This process may involve modifying the physical layout, electrical wiring, and internet connectivity, which can disrupt operations and add to the overall cost of deployment. Installing smart lockers requires access to essential utilities such as power and the internet. Ensuring these utilities are readily available in the chosen location is crucial for successfully deploying smart lockers. In remote or underserved areas, this can be a significant challenge. The installation process, including securing lockers, wiring, and configuring software, can be technically complex. It often requires specialized expertise; errors can lead to operational issues or security vulnerabilities.

Smart Locker Market Ecosystem

The Smart locker market is competitive, with major companies such as Ricoh, Pitney Bowes, Inc., ASSA ABLOY, Quadient, Gibraltar Industries, Hollman Inc., Bell and Howell, LLC, and Cleveron among others, are the significant manufacturers of smart locker, and numerous small- and medium-sized vital enterprises. Many players offer smart locker and their components, while many players and details offer integration services. These integration services are widely required in commercial, logistics, office, residential, and education.

Smart Locker Market by Ecosystem

Based on the offering, the hardware segment is expected to account for the largest market share during the forecast period.

The hardware segment will account for a significant Smart Locker Market Share in 2028. The hardware market is propelled by a constellation of factors, such as increased usage of smart lockers due to increasing demand for contactless solutions, particularly in a post-pandemic world, where touchless interactions are highly valued. The surge in e-commerce and online shopping has also played a pivotal role, as smart lockers offer a secure and convenient way to receive packages. The rising proliferation of mobile devices and other electronic devices is also a driving factor for growth in smart locker storage solutions. As a result, Smart lockers are also finding a place in modern workplaces, providing employees with secure storage for their personal belongings and contributing to the flexibility of contemporary work environments. Efficiency gains in last-mile delivery, security benefits, cost savings, and alignment with sustainability initiatives further fuel the demand for smart locker hardware.

Based on technology, the electronic segment is projected to contribute the largest market share during the forecast period.

The electronics technology segment will account for a significant market share in 2028. This is propelled by various factors such as the integration of electronic features (Pin Code, QR Codes, Bar codes, and other electronic keys) into smart locker technology that enhances the overall functionality, security, and user experience. It enables convenient and secure access for users while providing efficient management and oversight for administrators. Additionally, these features can be combined to create multi-layered security measures, ensuring that smart lockers are a dependable solution for various applications, including package delivery, personal storage, and more.

Based on region, Asia Pacific is projected to grow fastest for the smart locker market

The scope of the smart locker market in Asia Pacific includes China, Japan, South Korea, and the Rest of Asia Pacific. The smart locker market in Asia Pacific is expected to record the highest CAGR during the forecast period. China, Japan, and South Korea are among the major countries driving the smart locker market in the region. The increasing population, the need for investments in automation, and smart city initiatives are expected to drive the market.

Smart Locker Market by Region

Smart Locker Market Statistics by Region

To know about the assumptions considered for the study, download the pdf brochure

Key Market Players

The smart locker companies is dominated by a few globally established players such as Ricoh, Pitney Bowes, Inc., ASSA ABLOY, Quadient, Gibraltar Industries, Bell and Howell, LLC, Cleveron, etc.

Smart Locker Market Report Scope

Report Metric

Details

Estimated Market Size in 2023

USD 2.1 Billion

Projected Market Size in 2028

USD 3.6 Billion

Growth Rate

CAGR of 11.6%

Market size available for years

2019—2028

Base year

2022

Forecast period

2023—2028

Forecast Units

USD Millions/USD Billions and Million Units

Segments Covered

Offering, Deployment, Application, End-Use and Region.

Geographic regions covered

North America, Europe, Asia Pacific, and Rest of the world

Companies covered

Ricoh, Pitney Bowes, Inc, ASSA ABLOY, Quadient, Gibraltar Industries, Hollman Inc, Bell and Howell, LLC, Cleveron,InPost SA etc.

Smart Locker Market Highlights

This research report categorizes the smart locker market based on offering, deployment,technology,application, end-use industry, and region

Segment

Subsegment

Based on Offering:

  • Software
  • Hardware
  • Services

Based on Technology:

  • RFID
  • Electronics
  • Mobile
  • Biometrics
  • Cloud-based

Based on Deployment

  • Indoor
  • Outdoor

Based on Application

  • Day Lockers/Generic Lockers,
  • Parcel Lockers
  • Staff/Employee Lockers,
  • Asset Management Lockers

Based on Application

  • Commercial
  • Office
  • Logistics
  • Residential
  • Education
  • Other end-use industries (Healthcare and Industrial)

Based on Region:

  • North America
    • US
    • Canada
    • Mexico
  • Europe
    • Germany
    • UK
    • France
    • Rest of Europe
  • Asia Pacific (APAC)
    • China
    • Japan
    • South Korea
    • Rest of APAC
  • Rest of the world (RoW)
    • South America
    • Middle East and Africa

Recent Developments

  • In June 2023, Bell and Howell announced that a Tier 1 grocery chain in the United States has installed Bell and Howell’s industry-leading BH QuickCollect GO! Pod to elevate customer experience and deliver exceptional last-mile efficiency
  • In September 2022, Quadient announced that DHL Parcel UK is joining its growing parcel locker network in the United Kingdom. DHL Parcel UK announced a new partnership with Quadient to offer smart lockers for parcel pick-up throughout the UK. The contactless, secure locker stations will give recipients more choice and flexibility to receive their parcels at a time and location that suits them
  • In June 2022, Luxer One announced that it would sponsor and exhibit its suite of smart lockers designed for multifamily facilities at the National Apartment Association’s annual user group and conference, Apartmentalize, in San Diego.

Frequently Asked Questions (FAQs):

To speak to our analyst for a discussion on the above findings, click Speak to Analyst

TABLE OF CONTENTS
 
1 INTRODUCTION (Page No. - 26)
    1.1 STUDY OBJECTIVES 
    1.2 MARKET DEFINITION 
    1.3 STUDY SCOPE 
           1.3.1 INCLUSIONS AND EXCLUSIONS
           1.3.2 MARKETS COVERED
                    FIGURE 1 SMART LOCKER MARKET: SEGMENTATION
           1.3.3 REGIONAL SCOPE
           1.3.4 YEARS CONSIDERED
    1.4 CURRENCY CONSIDERED 
    1.5 STAKEHOLDERS 
    1.6 RECESSION IMPACT 
 
2 RESEARCH METHODOLOGY (Page No. - 30)
    2.1 RESEARCH DATA 
           FIGURE 2 SMART LOCKER MARKET: RESEARCH DESIGN
           2.1.1 SECONDARY AND PRIMARY RESEARCH
           2.1.2 SECONDARY DATA
                    2.1.2.1 List of key secondary sources
                    2.1.2.2 Key data from secondary sources
           2.1.3 PRIMARY DATA
                    2.1.3.1 Key data from primary sources
                    2.1.3.2 Key industry insights
                    2.1.3.3 Breakdown of primaries
    2.2 FACTOR ANALYSIS 
           FIGURE 3 SMART LOCKER MARKET SIZE ESTIMATION METHODOLOGY
    2.3 MARKET SIZE ESTIMATION METHODOLOGY 
           2.3.1 BOTTOM-UP APPROACH
                    2.3.1.1 Approach to derive market size using bottom-up analysis (demand-side)
                               FIGURE 4 MARKET SIZE ESTIMATION METHODOLOGY: BOTTOM-UP APPROACH
           2.3.2 TOP-DOWN APPROACH
                    2.3.2.1 Approach to derive market size using top-down analysis (supply-side)
                               FIGURE 5 MARKET SIZE ESTIMATION METHODOLOGY: TOP-DOWN APPROACH
    2.4 MARKET BREAKDOWN AND DATA TRIANGULATION 
           FIGURE 6 DATA TRIANGULATION
    2.5 RESEARCH ASSUMPTIONS 
           TABLE 1 ASSUMPTIONS
    2.6 PARAMETERS CONSIDERED TO ANALYZE RECESSION IMPACT 
 
3 EXECUTIVE SUMMARY (Page No. - 41)
    FIGURE 7 ELECTRONICS SEGMENT TO DOMINATE MARKET DURING FORECAST PERIOD
    FIGURE 8 SOFTWARE SEGMENT TO REGISTER HIGHEST CAGR IN MARKET DURING FORECAST PERIOD
    FIGURE 9 COMMERCIAL SEGMENT TO HOLD LARGEST MARKET SHARE IN 2028
    FIGURE 10 NORTH AMERICA ACCOUNTED FOR LARGEST MARKET SHARE IN 2022
 
4 PREMIUM INSIGHTS (Page No. - 44)
    4.1 ATTRACTIVE OPPORTUNITIES FOR PLAYERS IN SMART LOCKER MARKET 
           FIGURE 11 RISE IN E-COMMERCE SALES AND GROWING DEMAND FOR SMART LOCKERS IN COMMERCIAL SETTINGS AND OFFICES
    4.2 MARKET, BY APPLICATION 
           FIGURE 12 PARCEL LOCKERS SEGMENT TO REGISTER HIGHEST CAGR DURING FORECAST PERIOD
    4.3 MARKET, BY OFFERING 
           FIGURE 13 HARDWARE SEGMENT TO ACCOUNT FOR LARGEST MARKET SHARE IN 2028
    4.4 MARKET, BY END-USE INDUSTRY 
           FIGURE 14 COMMERCIAL SEGMENT TO HOLD LARGEST SHARE OF MARKET IN 2028
    4.5 MARKET, BY REGION 
           FIGURE 15 CHINA TO REGISTER HIGHEST CAGR IN MARKET DURING FORECAST PERIOD
 
5 MARKET OVERVIEW (Page No. - 47)
    5.1 INTRODUCTION 
    5.2 MARKET DYNAMICS 
           FIGURE 16 SMART LOCKER MARKET: DRIVERS, RESTRAINTS, OPPORTUNITIES, AND CHALLENGES
           5.2.1 DRIVERS
                    5.2.1.1 Rising integration of different technologies into smart lockers
                    5.2.1.2 Increasing applications of smart lockers in e-commerce, retail, and logistics industries
                    5.2.1.3 High emphasis of organizations and individuals on enhancing security of critical assets
                               FIGURE 17 SMART LOCKER MARKET: DRIVERS AND THEIR IMPACT
           5.2.2 RESTRAINTS
                    5.2.2.1 High initial investment and costs
                               FIGURE 18 MARKET: RESTRAINTS AND THEIR IMPACT
           5.2.3 OPPORTUNITIES
                    5.2.3.1 Rapid urbanization and infrastructure development
                    5.2.3.2 Shift toward health-conscious practices
                               FIGURE 19 MARKET: OPPORTUNITIES AND THEIR IMPACT
           5.2.4 CHALLENGES
                    5.2.4.1 Space and installation challenges
                               FIGURE 20 MARKET: CHALLENGES AND THEIR IMPACT
    5.3 VALUE CHAIN ANALYSIS 
           FIGURE 21 MARKET: VALUE CHAIN ANALYSIS
    5.4 ECOSYSTEM MAPPING 
           FIGURE 22MARKET: ECOSYSTEM MAPPING
           TABLE 2 COMPANIES AND THEIR ROLE IN SMART LOCKER ECOSYSTEM
    5.5 PRICING ANALYSIS 
           5.5.1 AVERAGE SELLING PRICE (ASP) TREND, BY END-USE INDUSTRY
                    TABLE 3 INDICATIVE AVERAGE SELLING PRICE (ASP) OF SMART LOCKERS, BY END-USE INDUSTRY, 2019–2023, (USD)
                    FIGURE 23 AVERAGE SELLING PRICE (ASP) OF SMART LOCKERS, BY TOP THREE END-USE INDUSTRIES (USD)
           5.5.2 AVERAGE SELLING PRICE (ASP) OF SMART LOCKERS, BY TOP THREE END-USE INDUSTRIES (USD)
                    TABLE 4 AVERAGE SELLING PRICE (ASP) OF SMART LOCKERS, BY TOP THREE END-USE INDUSTRIES (USD)
    5.6 TRENDS/DISRUPTIONS IMPACTING CUSTOMERS’ BUSINESSES 
           FIGURE 24 TRENDS/DISRUPTIONS IMPACTING CUSTOMERS’ BUSINESSES
    5.7 TECHNOLOGY ANALYSIS 
           5.7.1 IOT CONNECTIVITY
           5.7.2 MOBILE APPLICATION INTEGRATION
           5.7.3 SOFTWARE AS A SERVICE (SAAS)
    5.8 PORTER’S FIVE FORCES ANALYSIS 
           FIGURE 25 MARKET: IMPACT OF PORTER’S FIVE FORCES
           FIGURE 26 MARKET: PORTER’S FIVE FORCES ANALYSIS
           TABLE 5 MARKET: PORTER’S FIVE FORCES ANALYSIS, 2022
    5.9 KEY STAKEHOLDERS AND BUYING CRITERIA 
           FIGURE 27 INFLUENCE OF STAKEHOLDERS ON BUYING PROCESS FOR TOP THREE END-USE INDUSTRIES
           TABLE 6 INFLUENCE OF STAKEHOLDERS ON BUYING PROCESS FOR TOP THREE END-USE INDUSTRIES
           5.9.1 BUYING CRITERIA
                    FIGURE 28 KEY BUYING CRITERIA FOR TOP THREE END-USE INDUSTRIES
                    TABLE 7 KEY BUYING CRITERIA FOR TOP THREE END-USE INDUSTRIES
    5.10 CASE STUDY ANALYSIS 
           5.10.1 CANADIAN PHARMACY OPTED FOR SNAILE INC.’S SMART LOCKERS TO ENSURE SECURE PICKUPS DURING AFTER-HOURS
           5.10.2 LOQIT FINALIZED PROJECT FOR DE RUITER’S BAKKERIJ IN NETHERLANDS THAT INCLUDES INSTALLATION OF LOQIT'S ELECTRONIC LOCKING SYSTEM, DESIGNATED FOR USE AS EMPLOYEE LOCKERS
           5.10.3 QUADIENT DEPLOYED 200 SMART LOCKERS AT EDUCATIONAL INSTITUTIONS IN US FOR PERSONAL STORAGE PURPOSES
    5.11 TRADE ANALYSIS 
           5.11.1 IMPORT SCENARIO
                    FIGURE 29 IMPORT DATA FOR HS CODE 830140-COMPLIANT PRODUCTS, BY KEY COUNTRY, 2018–2022 (USD MILLION)
           5.11.2 EXPORT SCENARIO
                    FIGURE 30 EXPORT DATA FOR HS CODE 830140-COMPLIANT PRODUCTS, BY KEY COUNTRY, 2018–2022 (USD MILLION)
    5.12 PATENT ANALYSIS 
           FIGURE 31 TOP 10 COMPANIES WITH HIGHEST NUMBER OF PATENT APPLICATIONS, 2012–2022
           TABLE 8 TOP 20 PATENT OWNERS IN US, 2012–2022
           FIGURE 32 NUMBER OF PATENTS GRANTED PER YEAR, 2012–2022
           TABLE 9 LIST OF PATENTS RELATED TO SMART LOCKERS
    5.13 KEY CONFERENCES AND EVENTS, 2023–2024 
           TABLE 10 SMART LOCKER MARKET: LIST OF CONFERENCES AND EVENTS, 2023–2024
    5.14 TARIFF ANALYSIS 
           TABLE 11 MFN TARIFF FOR HS CODE 900490-COMPLIANT PRODUCTS EXPORTED BY US
           TABLE 12 MFN TARIFF FOR HS CODE 900490-COMPLIANT PRODUCTS EXPORTED BY CHINA
    5.15 REGULATORY LANDSCAPE 
           5.15.1 REGULATORY BODIES, GOVERNMENT AGENCIES, AND OTHER ORGANIZATIONS
                    TABLE 13 NORTH AMERICA: LIST OF REGULATORY BODIES, GOVERNMENT AGENCIES, AND OTHER ORGANIZATIONS
                    TABLE 14 EUROPE: LIST OF REGULATORY BODIES, GOVERNMENT AGENCIES, AND OTHER ORGANIZATIONS
                    TABLE 15 ASIA PACIFIC: LIST OF REGULATORY BODIES, GOVERNMENT AGENCIES, AND OTHER ORGANIZATIONS
                    TABLE 16 ROW: LIST OF REGULATORY BODIES, GOVERNMENT AGENCIES, AND OTHER ORGANIZATIONS
           5.15.2 STANDARDS RELATED TO SMART LOCKERS
                    TABLE 17 MARKET: STANDARDS
 
6 SMART LOCKER MARKET, BY OFFERING (Page No. - 74)
    6.1 INTRODUCTION 
           FIGURE 33 MARKET, BY OFFERING
           FIGURE 34 SOFTWARE SEGMENT TO DEPICT HIGHEST CAGR FROM 2023 TO 2028
           TABLE 18 MARKET, BY OFFERING, 2019–2022 (USD MILLION)
           TABLE 19 MARKET, BY OFFERING, 2023–2028 (USD MILLION)
    6.2 HARDWARE 
           6.2.1 EXPANDING E-COMMERCE INDUSTRY, REQUIREMENT FOR CONTACTLESS SOLUTIONS, AND SMART CITY INITIATIVES TO FUEL DEMAND
                    TABLE 20 HARDWARE: MARKET, BY END-USE INDUSTRY, 2019–2022 (USD MILLION)
                    TABLE 21 HARDWARE: MARKET, BY END-USE INDUSTRY, 2023–2028 (USD MILLION)
    6.3 SOFTWARE 
           6.3.1 INTEGRATION OF ADVANCED TECHNOLOGIES INTO SMART LOCKER SOFTWARE TO FUEL DEMAND
                    FIGURE 35 COMMERCIAL SEGMENT TO DEPICT HIGHEST CAGR IN MARKET FOR SOFTWARE FROM 2023 TO 2028
                    TABLE 22 SOFTWARE: MARKET, BY END-USE INDUSTRY, 2019–2022 (USD MILLION)
                    TABLE 23 SOFTWARE: MARKET, BY END-USE INDUSTRY, 2023–2028 (USD MILLION)
    6.4 SERVICES 
           6.4.1 RISING ADOPTION OF SERVICES TO ENSURE SEAMLESS OPERATION OF SMART LOCKERS TO DRIVE MARKET
                    TABLE 24 SERVICES: MARKET, BY END-USE INDUSTRY, 2019–2022 (USD MILLION)
                    TABLE 25 SERVICES: MARKET, BY END-USE INDUSTRY, 2023–2028 (USD MILLION)
 
7 SMART LOCKER MARKET, BY TECHNOLOGY (Page No. - 81)
    7.1 INTRODUCTION 
           FIGURE 36 MARKET, BY TECHNOLOGY
           FIGURE 37 CLOUD-BASED TECHNOLOGY SEGMENT TO DEPICT HIGHEST CAGR FROM 2023 TO 2028
           TABLE 26 MARKET, BY TECHNOLOGY, 2019–2022 (USD MILLION)
           TABLE 27 MARKET, BY TECHNOLOGY, 2023–2028 (USD MILLION)
    7.2 RADIO FREQUENCY IDENTIFICATION (RFID) 
           7.2.1 GROWING USE OF RADIO FREQUENCY IDENTIFICATION (RFID) TECHNOLOGY TO ENHANCE ACCESS CONTROL, SECURITY, AND OPERATIONAL EFFICIENCY OF SMART LOCKERS
    7.3 ELECTRONICS 
           7.3.1 RISING ADOPTION OF ELECTRONIC TECHNOLOGIES TO ENHANCE FUNCTIONALITY AND SECURITY OF SMART LOCKERS
    7.4 MOBILE 
           7.4.1 INCREASING REQUIREMENT FOR MULTI-FACTOR AUTHENTICATION TO ENHANCE SECURITY OF SMART LOCKERS
    7.5 BIOMETRIC 
           7.5.1 INCREASING DEMAND FOR HIGH SECURITY AND CONTACTLESS ACCESS SOLUTIONS
    7.6 CLOUD-BASED 
           7.6.1 GROWING ADOPTION IN VARIOUS INDUSTRIES TO REMOTELY MANAGE AND MONITOR LOCKER OPERATIONS FROM INTERNET-CONNECTED DEVICES
 
8 SMART LOCKER MARKET, BY DEPLOYMENT (Page No. - 86)
    8.1 INTRODUCTION 
           FIGURE 38 MARKET, BY DEPLOYMENT
           FIGURE 39 INDOOR SEGMENT TO REGISTER HIGHER CAGR DURING FORECAST PERIOD
           TABLE 28 MARKET, BY DEPLOYMENT, 2019–2022 (USD MILLION)
           TABLE 29 MARKET, BY DEPLOYMENT, 2023–2028 (USD MILLION)
    8.2 INDOOR 
           8.2.1 INCREASING DEPLOYMENT OF INDOOR SMART LOCKERS TO ENHANCE SECURITY AND ACCESS CONTROL
    8.3 OUTDOOR 
           8.3.1 GROWING INSTALLATION OF OUTDOOR SMART LOCKERS IN COMMERCIAL SPACES, OFFICES, AND LOGISTICS INDUSTRY
 
9 SMART LOCKER MARKET, BY APPLICATION (Page No. - 90)
    9.1 INTRODUCTION 
           FIGURE 40 MARKET, BY APPLICATION
           FIGURE 41 PARCEL LOCKERS SEGMENT TO REGISTER HIGHEST CAGR FROM 2023 TO 2028
           TABLE 30 MARKET, BY APPLICATION, 2019–2022 (USD MILLION)
           TABLE 31 MARKET, BY APPLICATION, 2023–2028 (USD MILLION)
    9.2 DAY LOCKERS/GENERIC LOCKERS 
           9.2.1 ADOPTION OF DAY LOCKERS/GENERIC LOCKERS FOR TEMPORARY STORAGE PURPOSES TO BOOST MARKET GROWTH
                    TABLE 32 DAY LOCKERS/GENERIC LOCKERS: MARKET, BY END-USE INDUSTRY, 2019–2022 (USD MILLION)
                    TABLE 33 DAY LOCKERS/GENERIC LOCKERS: MARKET, BY END-USE INDUSTRY, 2023–2028 (USD MILLION)
    9.3 PARCEL LOCKERS 
           9.3.1 EXPANDING E-COMMERCE AND LOGISTICS INDUSTRIES TO DRIVE SEGMENTAL GROWTH
                    FIGURE 42 COMMERCIAL SEGMENT TO REGISTER HIGHEST CAGR IN MARKET FOR PARCEL LOCKERS FROM 2023 TO 2028
                    TABLE 34 PARCEL LOCKERS: MARKET, BY END-USE INDUSTRY, 2019–2022 (USD MILLION)
                    TABLE 35 PARCEL LOCKERS: MARKET, BY END-USE INDUSTRY, 2023–2028 (USD MILLION)
    9.4 STAFF/EMPLOYEE LOCKERS 
           9.4.1 INCREASED ADOPTION OF HYBRID WORKING MODEL TO BOOST DEMAND
                    TABLE 36 STAFF/EMPLOYEE LOCKERS: MARKET, BY END-USE INDUSTRY, 2019–2022 (USD MILLION)
                    TABLE 37 STAFF/EMPLOYEE LOCKERS: MARKET, BY END-USE INDUSTRY, 2023–2028 (USD MILLION)
    9.5 ASSET MANAGEMENT LOCKERS 
           9.5.1 GROWING USE OF ASSET MANAGEMENT LOCKERS TO EFFICIENTLY TRACK, MONITOR, AND SECURE VALUABLE ASSETS IN VARIOUS INDUSTRIES TO DRIVE MARKET
                    TABLE 38 ASSET MANAGEMENT LOCKERS: MARKET, BY END-USE INDUSTRY, 2019–2022 (USD MILLION)
                    TABLE 39 ASSET MANAGEMENT LOCKERS: MARKET, BY END-USE INDUSTRY, 2023–2028 (USD MILLION)
 
10 SMART LOCKER MARKET, BY END-USE INDUSTRY (Page No. - 99)
     10.1 INTRODUCTION 
             FIGURE 43 MARKET, BY END-USE INDUSTRY
             FIGURE 44 COMMERCIAL SEGMENT TO HOLD LARGEST MARKET SHARE IN 2028
             TABLE 40 MARKET, BY END-USE INDUSTRY, 2019–2022 (THOUSAND UNITS)
             TABLE 41 MARKET, BY END-USE INDUSTRY, 2023–2028 (THOUSAND UNITS)
             TABLE 42 MARKET, BY END-USE INDUSTRY, 2019–2022 (USD MILLION)
             TABLE 43 MARKET, BY END-USE INDUSTRY, 2023–2028 (USD MILLION)
     10.2 COMMERCIAL 
             10.2.1 EXPANDING E-COMMERCE INDUSTRY AND RISING ADOPTION OF SMART LOCKERS IN RETAIL STORES, HOSPITALITY CENTERS, AND PUBLIC SPACES
                        TABLE 44 COMMERCIAL: MARKET, BY OFFERING, 2019–2022 (USD MILLION)
                        TABLE 45 COMMERCIAL: MARKET, BY OFFERING, 2023–2028 (USD MILLION)
                        TABLE 46 COMMERCIAL: MARKET, BY DEPLOYMENT, 2019–2022 (USD MILLION)
                        TABLE 47 COMMERCIAL: MARKET, BY DEPLOYMENT, 2023–2028 (USD MILLION)
                        TABLE 48 COMMERCIAL: MARKET, BY APPLICATION, 2019–2022 (USD MILLION)
                        TABLE 49 COMMERCIAL: MARKET, BY APPLICATION, 2023–2028 (USD MILLION)
                        FIGURE 45 ASIA PACIFIC TO REGISTER HIGHEST CAGR IN MARKET FOR COMMERCIAL FROM 2023 TO 2028
                        TABLE 50 COMMERCIAL: MARKET, BY REGION, 2019–2022 (USD MILLION)
                        TABLE 51 COMMERCIAL: MARKET, BY REGION, 2023–2028 (USD MILLION)
     10.3 OFFICE 
             10.3.1 GROWING USE OF SMART LOCKERS TO SECURELY STORE SENSITIVE DOCUMENTS, CONFIDENTIAL INFORMATION, AND PERSONAL VALUABLES
                        TABLE 52 OFFICE: MARKET, BY OFFERING, 2019–2022 (USD MILLION)
                        TABLE 53 OFFICE: MARKET, BY OFFERING, 2023–2028 (USD MILLION)
                        TABLE 54 OFFICE: MARKET, BY DEPLOYMENT, 2019–2022 (USD MILLION)
                        TABLE 55 OFFICE: MARKET, BY DEPLOYMENT, 2023–2028 (USD MILLION)
                        TABLE 56 OFFICE: MARKET, BY APPLICATION, 2019–2022 (USD MILLION)
                        TABLE 57 OFFICE: MARKET, BY APPLICATION, 2023–2028 (USD MILLION)
                        TABLE 58 OFFICE: MARKET, BY REGION, 2019–2022 (USD MILLION)
                        TABLE 59 OFFICE: MARKET, BY REGION, 2023–2028 (USD MILLION)
     10.4 LOGISTICS 
             10.4.1 RISING ADOPTION OF SMART LOCKERS IN DISTRIBUTION CENTERS AND WAREHOUSES TO STREAMLINE MANAGEMENT OF PACKAGES AND PARCELS
                        TABLE 60 LOGISTICS: SMART LOCKER MARKET, BY OFFERING, 2019–2022 (USD MILLION)
                        TABLE 61 LOGISTICS: MARKET, BY OFFERING, 2023–2028 (USD MILLION)
                        TABLE 62 LOGISTICS: MARKET, BY DEPLOYMENT, 2019–2022 (USD MILLION)
                        TABLE 63 LOGISTICS: MARKET, BY DEPLOYMENT, 2023–2028 (USD MILLION)
                        TABLE 64 LOGISTICS: MARKET, BY APPLICATION, 2019–2022 (USD MILLION)
                        TABLE 65 LOGISTICS: MARKET, BY APPLICATION, 2023–2028 (USD MILLION)
                        TABLE 66 LOGISTICS: MARKET, BY REGION, 2019–2022 (USD MILLION)
                        TABLE 67 LOGISTICS: MARKET, BY REGION, 2023–2028 (USD MILLION)
     10.5 RESIDENTIAL 
             10.5.1 GROWING NEED FOR MULTIFACETED SOLUTIONS TO MANAGE PACKAGES, DELIVERIES, AND OTHER SERVICES
                        TABLE 68 RESIDENTIAL: SMART LOCKER MARKET, BY OFFERING, 2019–2022 (USD MILLION)
                        TABLE 69 RESIDENTIAL: MARKET, BY OFFERING, 2023–2028 (USD MILLION)
                        TABLE 70 RESIDENTIAL: MARKET, BY DEPLOYMENT, 2019–2022 (USD MILLION)
                        TABLE 71 RESIDENTIAL: MARKET, BY DEPLOYMENT, 2023–2028 (USD MILLION)
                        TABLE 72 RESIDENTIAL: MARKET, BY APPLICATION, 2019–2022 (USD MILLION)
                        TABLE 73 RESIDENTIAL: MARKET, BY APPLICATION, 2023–2028 (USD MILLION)
                        TABLE 74 RESIDENTIAL: MARKET, BY REGION, 2019–2022 (USD MILLION)
                        TABLE 75 RESIDENTIAL: MARKET, BY REGION, 2023–2028 (USD MILLION)
     10.6 EDUCATION 
             10.6.1 INCREASING INSTALLATION OF SMART LOCKERS IN EDUCATION INDUSTRY TO SECURE STORE DOCUMENTS, TEACHING MATERIALS, AND PERSONAL BELONGINGS
                        TABLE 76 EDUCATION: SMART LOCKER MARKET, BY OFFERING, 2019–2022 (USD MILLION)
                        TABLE 77 EDUCATION: MARKET, BY OFFERING, 2023–2028 (USD MILLION)
                        TABLE 78 EDUCATION: MARKET, BY DEPLOYMENT, 2019–2022 (USD MILLION)
                        TABLE 79 EDUCATION: MARKET, BY DEPLOYMENT, 2023–2028 (USD MILLION)
                        TABLE 80 EDUCATION: MARKET, BY APPLICATION, 2019–2022 (USD MILLION)
                        TABLE 81 EDUCATION: MARKET, BY APPLICATION, 2023–2028 (USD MILLION)
                        TABLE 82 EDUCATION: MARKET, BY REGION, 2019–2022 (USD MILLION)
                        TABLE 83 EDUCATION: MARKET, BY REGION, 2023–2028 (USD MILLION)
     10.7 OTHER END-USE INDUSTRIES 
             TABLE 84 OTHER END-USE INDUSTRIES: SMART LOCKER MARKET, BY OFFERING, 2019–2022 (USD MILLION)
             TABLE 85 OTHER END-USE INDUSTRIES: MARKET, BY OFFERING, 2023–2028 (USD MILLION)
             TABLE 86 OTHER END-USE INDUSTRIES: MARKET, BY DEPLOYMENT, 2019–2022 (USD MILLION)
             TABLE 87 OTHER END-USE INDUSTRIES: MARKET, BY DEPLOYMENT, 2023–2028 (USD MILLION)
             TABLE 88 OTHER END-USE INDUSTRIES: MARKET, BY APPLICATION, 2019–2022 (USD MILLION)
             TABLE 89 OTHER END-USE INDUSTRIES: MARKET, BY APPLICATION, 2023–2028 (USD MILLION)
             TABLE 90 OTHER END-USE INDUSTRIES: MARKET, BY REGION, 2019–2022 (USD MILLION)
             TABLE 91 OTHER END-USE INDUSTRIES: MARKET, BY REGION, 2023–2028 (USD MILLION)
 
11 SMART LOCKER MARKET, BY REGION (Page No. - 119)
     11.1 INTRODUCTION 
             FIGURE 46 MARKET, BY REGION
             TABLE 92 MARKET, BY REGION, 2019–2022 (USD MILLION)
             TABLE 93 MARKET, BY REGION, 2023–2028 (USD MILLION)
     11.2 NORTH AMERICA 
             11.2.1 NORTH AMERICAN MARKET: TOP VENDORS
             11.2.2 NORTH AMERICAN MARKET: RECESSION IMPACT
                        FIGURE 47 NORTH AMERICA: MARKET SNAPSHOT
                        TABLE 94 NORTH AMERICA: MARKET, BY COUNTRY, 2019–2022 (USD MILLION)
                        TABLE 95 NORTH AMERICA: MARKET, BY COUNTRY, 2023–2028 (USD MILLION)
                        TABLE 96 NORTH AMERICA: MARKET, BY END-USE INDUSTRY, 2019–2022 (USD MILLION)
                        TABLE 97 NORTH AMERICA: MARKET, BY END-USE INDUSTRY, 2023–2028 (USD MILLION)
             11.2.3 US
                        11.2.3.1 Increase in online shopping and e-commerce activities and focus on adoption of technologically advanced smart lockers
             11.2.4 CANADA
                        11.2.4.1 Growing use of smart lockers in commercial, healthcare, and education industries
             11.2.5 MEXICO
                        11.2.5.1 Increasing manufacturing of electronics components, audio and video equipment, medical devices, apparel and textiles, and consumer goods
     11.3 EUROPE 
             11.3.1 EUROPE SMART LOCKER MARKET: TOP VENDORS
                        FIGURE 48 EUROPE: MARKET SNAPSHOT
                        TABLE 98 EUROPE: MARKET, BY COUNTRY, 2019–2022 (USD MILLION)
                        TABLE 99 EUROPE: MARKET, BY COUNTRY, 2023–2028 (USD MILLION)
                        TABLE 100 EUROPE: MARKET, BY END-USE INDUSTRY, 2019–2022 (USD MILLION)
                        TABLE 101 EUROPE: MARKET, BY END-USE INDUSTRY, 2023–2028 (USD MILLION)
             11.3.2 EUROPEAN MARKET: RECESSION IMPACT
             11.3.3 GERMANY
                        11.3.3.1 Increasing installation of smart lockers in commercial, residential, and healthcare industries
             11.3.4 FRANCE
                        11.3.4.1 Increasing demand and popularity of smart lockers in commercial, office, and residential industries
             11.3.5 UK
                        11.3.5.1 Growing adoption of smart lockers in warehouses, offices, institutions, and retail stores for secure and contactless delivery of items
             11.3.6 REST OF EUROPE
     11.4 ASIA PACIFIC 
             11.4.1 ASIA PACIFIC SMART LOCKER MARKET: TOP VENDORS
                        FIGURE 49 ASIA PACIFIC: MARKET SNAPSHOT
                        TABLE 102 ASIA PACIFIC: MARKET, BY COUNTRY, 2019–2022 (USD MILLION)
                        TABLE 103 ASIA PACIFIC: MARKET, BY COUNTRY, 2023–2028 (USD MILLION)
                        TABLE 104 ASIA PACIFIC: MARKET, BY APPLICATION, 2019–2022 (USD MILLION)
                        TABLE 105 ASIA PACIFIC: MARKET, BY APPLICATION, 2023–2028 (USD MILLION)
             11.4.2 ASIA PACIFIC MARKET: RECESSION IMPACT
             11.4.3 CHINA
                        11.4.3.1 Increased industrialization and growing need for smart storage systems
             11.4.4 JAPAN
                        11.4.4.1 Rising need for smart lockers for secured parcel deliveries
             11.4.5 SOUTH KOREA
                        11.4.5.1 Growing e-commerce industry and rising use of smart lockers in stores and warehouses to improve picking speed and accuracy
             11.4.6 REST OF ASIA PACIFIC
     11.5 ROW 
             11.5.1 ROW SMART LOCKER MARKET: TOP VENDORS
                        TABLE 106 ROW: MARKET, BY REGION, 2019–2022 (USD MILLION)
                        TABLE 107 ROW: MARKET, BY REGION, 2023–2028 (USD MILLION)
                        TABLE 108 ROW: MARKET, BY APPLICATION, 2019–2022 (USD MILLION)
                        TABLE 109 ROW: MARKET, BY APPLICATION, 2023–2028 (USD MILLION)
             11.5.2 ROW MARKET: RECESSION IMPACT
             11.5.3 SOUTH AMERICA
                        11.5.3.1 Rising urbanization and disposable income
             11.5.4 MIDDLE EAST & AFRICA
                        11.5.4.1 Economic growth, urbanization, and expanding middle-class population
 
12 COMPETITIVE LANDSCAPE (Page No. - 139)
     12.1 OVERVIEW 
     12.2 MAJOR STRATEGIES ADOPTED BY KEY PLAYERS 
             TABLE 110 OVERVIEW OF MAJOR STRATEGIES ADOPTED BY KEY PLAYERS, 2022–2023
     12.3 REVENUE ANALYSIS OF TOP FIVE COMPANIES, 2018–2022 
             FIGURE 50 REVENUE ANALYSIS OF TOP FIVE PLAYERS, 2018–2022
     12.4 MARKET SHARE ANALYSIS, 2022 
             TABLE 111 MARKET: DEGREE OF COMPETITION
             FIGURE 51 MARKET SHARE ANALYSIS, 2022
     12.5 COMPETITIVE EVALUATION MATRIX, 2022 
           FIGURE 52 MARKET: COMPANY EVALUATION MATRIX, 2022
             12.5.1 STARS
             12.5.2 EMERGING LEADERS
             12.5.3 PERVASIVE PLAYERS
             12.5.4 PARTICIPANTS
             12.5.5 COMPANY FOOTPRINT
                        TABLE 112 OVERALL COMPANY FOOTPRINT
                        TABLE 113 OFFERING: COMPANY FOOTPRINT
                        TABLE 114 END-USE INDUSTRY: COMPANY FOOTPRINT
                        TABLE 115 REGION: COMPANY FOOTPRINT
     12.6 STARTUPS/SMALL AND MEDIUM-SIZED ENTERPRISES (SMES) EVALUATION MATRIX, 2022 
           FIGURE 53 SMART LOCKER MARKET: STARTUPS/SMES EVALUATION MATRIX, 2022
             12.6.1 PROGRESSIVE COMPANIES
             12.6.2 RESPONSIVE COMPANIES
             12.6.3 DYNAMIC COMPANIES
             12.6.4 STARTING BLOCKS
             12.6.5 COMPETITIVE BENCHMARKING
                        TABLE 116 MARKET: LIST OF STARTUPS/SMES
     12.7 COMPETITIVE SCENARIOS AND TRENDS 
             12.7.1 PRODUCT LAUNCHES
                        TABLE 117 MARKET: PRODUCT LAUNCHES, 2021–2023
             12.7.2 DEALS
                        TABLE 118 MARKET: DEALS, 2021–2023
             12.7.3 OTHERS
                        TABLE 119 MARKET: OTHERS, 2021–2023
 
13 COMPANY PROFILES (Page No. - 154)
(Business Overview, Products/Solutions/Services Offered, Recent Developments, and MnM View (Key strengths/Right to Win, Strategic Choices Made, and Weaknesses and Competitive Threats))*  
     13.1 KEY PLAYERS 
             13.1.1 ASSA ABLOY
                        TABLE 120 ASSA ABLOY: COMPANY OVERVIEW
                        FIGURE 54 ASSA ABLOY: COMPANY SNAPSHOT
                        TABLE 121 ASSA ABLOY: PRODUCTS/SOLUTIONS/SERVICES OFFERED
                        TABLE 122 ASSA ABLOY: DEALS
                        TABLE 123 ASSA ABLOY: OTHERS
             13.1.2 QUADIENT
                        TABLE 124 QUADIENT: COMPANY OVERVIEW
                        FIGURE 55 QUADIENT: COMPANY SNAPSHOT
                        TABLE 125 QUADIENT: PRODUCTS/SOLUTIONS/SERVICES OFFERED
                        TABLE 126 QUADIENT: PRODUCT LAUNCHES
                        TABLE 127 QUADIENT: DEALS
                        TABLE 128 QUADIENT: OTHERS
             13.1.3 PITNEY BOWES INC.
                        TABLE 129 PITNEY BOWES INC.: COMPANY OVERVIEW
                        FIGURE 56 PITNEY BOWES INC.: COMPANY SNAPSHOT
                        TABLE 130 PITNEY BOWES INC.: PRODUCTS/SOLUTIONS/SERVICES OFFERED
                        TABLE 131 PITNEY BOWES INC.: PRODUCT LAUNCHES
             13.1.4 RICOH
                        TABLE 132 RICOH: COMPANY OVERVIEW
                        FIGURE 57 RICOH: COMPANY SNAPSHOT
                        TABLE 133 RICOH: PRODUCTS/SOLUTIONS/SERVICES OFFERED
                        TABLE 134 RICOH: PRODUCT LAUNCHES
                        TABLE 135 RICOH: DEALS
             13.1.5 GIBRALTAR INDUSTRIES
                        TABLE 136 GIBRALTAR INDUSTRIES: COMPANY OVERVIEW
                        FIGURE 58 GIBRALTAR INDUSTRIES: COMPANY SNAPSHOT
                        TABLE 137 GIBRALTAR INDUSTRIES: PRODUCTS/SOLUTIONS/SERVICES OFFERED
             13.1.6 BELL AND HOWELL LLC
                        TABLE 138 BELL AND HOWELL LLC: COMPANY OVERVIEW
                        TABLE 139 BELL AND HOWELL LLC: PRODUCTS/SOLUTIONS/SERVICES OFFERED
                        TABLE 140 BELL AND HOWELL LLC: PRODUCT LAUNCHES
                        TABLE 141 BELL AND HOWELL LLC: DEALS
                        TABLE 142 BELL AND HOWELL LLC: OTHERS
             13.1.7 CLEVERON
                        TABLE 143 CLEVERON: COMPANY OVERVIEW
                        TABLE 144 CLEVERON: PRODUCTS/SOLUTIONS/SERVICES OFFERED
                        TABLE 145 CLEVERON: PRODUCT LAUNCHES
                        TABLE 146 CLEVERON: DEALS
                        TABLE 147 CLEVERON: OTHERS
             13.1.8 KEBA
                        TABLE 148 KEBA: COMPANY OVERVIEW
                        TABLE 149 KEBA: PRODUCTS/SOLUTIONS/SERVICES OFFERED
                        TABLE 150 KEBA: OTHERS
             13.1.9 HOLLMAN, INC.
                        TABLE 151 HOLLMAN, INC.: COMPANY OVERVIEW
                        TABLE 152 HOLLMAN, INC.: PRODUCTS/SOLUTIONS/SERVICES OFFERED
                        TABLE 153 HOLLMAN, INC.: OTHERS
             13.1.10 PACKAGE NEXUS
                        TABLE 154 PACKAGE NEXUS: COMPANY OVERVIEW
                        TABLE 155 PACKAGE NEXUS: PRODUCTS/SOLUTIONS/SERVICES OFFERED
             13.1.11 SHENZHEN ZHILAI SCI AND TECH CO., LTD
                        TABLE 156 SHENZHEN ZHILAI SCI AND TECH CO., LTD: COMPANY OVERVIEW
                        TABLE 157 SHENZHEN ZHILAI SCI AND TECH CO., LTD: PRODUCTS/SOLUTIONS/SERVICES OFFERED
     13.2 OTHER PLAYERS 
             13.2.1 YELLOWBOX CO PTY LTD
             13.2.2 LOQIT B.V.
             13.2.3 METRA INŽENIRING D.O.O.
             13.2.4 MOBIIKEY
             13.2.5 ELOCKER LTD
             13.2.6 PARCELPORT SOLUTIONS, INC.
             13.2.7 DIGILOCK
             13.2.8 SMARTBOX ECOMMERCE SOLUTIONS PRIVATE LTD.
             13.2.9 YOUR WORKSPACE
             13.2.10 MODERN OFFICE SYSTEMS. LLC
             13.2.11 AMERICAN LOCKER
             13.2.12 TZ LIMITED
             13.2.13 LOCKTEC GMBH
             13.2.14 SNAILE INC.
*Details on Business Overview, Products/Solutions/Services Offered, Recent Developments, and MnM View (Key strengths/Right to Win, Strategic Choices Made, and Weaknesses and Competitive Threats) might not be captured in case of unlisted companies.  
 
14 APPENDIX (Page No. - 198)
     14.1 INSIGHTS FROM INDUSTRY EXPERTS 
     14.2 DISCUSSION GUIDE 
     14.3 KNOWLEDGESTORE: MARKETSANDMARKETS’ SUBSCRIPTION PORTAL 
     14.4 CUSTOMIZATION OPTIONS 
     14.5 RELATED REPORTS 
     14.6 AUTHOR DETAILS 


To estimate the size of the smart locker market, the study utilized four major activities. Exhaustive secondary research was conducted to gather information on the market, as well as its peer and parent markets. The next step was to validate these findings, assumptions, and sizing with industry experts across the value chain through primary research. Both top-down and bottom-up approaches were employed to estimate the total market size. Finally, market breakdown and data triangulation methods were utilized to estimate the market size for different segments and subsegments.

Secondary Research

In the secondary research process, various sources have been referred to for identifying and collecting information for this study on the smart locker market. Secondary sources for this research study include corporate filings (such as annual reports, investor presentations, and financial statements); trade, business, and professional associations; white papers; certified publications; articles by recognized authors; directories; and databases. The secondary data was collected and analyzed to determine the overall market size, further validated through primary research.

List of key secondary sources

Source

Web Link

International Trade Centre (ITC)

www.intracen.org

World Economic Forum

https://www.weforum.org/

World Trade Organization

www.wto.gov

Custom Electronic Design & Installation Association

www.cedia.org

The Continental Automated Buildings Association

www.caba.org

European Building Automation and Controls Association

www.eubac.org

The International Society of Automation

www.isa.org

Primary Research

To gather insights on market statistics, revenue data, market breakdowns, size estimations, and forecasting, primary interviews were conducted. Additionally, primary research was used to comprehend the various technology, application, vertical, and regional trends. Interviews with stakeholders from the demand side, including CIOs, CTOs, CSOs, and customer/end-user installation teams using smart locker, were also conducted to understand their perspective on suppliers, products, component providers, and their current and future use of smart locker, which will impact the overall market. Several primary interviews were conducted across major countries of North America, Europe, Asia Pacific, the Middle East & Africa, and Latin America.

Smart Locker Market Size, and Share

To know about the assumptions considered for the study, download the pdf brochure

Market Size Estimation

To estimate and validate the size of the smart locker market and its submarkets, both top-down and bottom-up approaches were utilized. Secondary research was conducted to identify the key players in the market, and primary and secondary research was used to determine their market share in specific regions. The entire process involved studying top players’ annual and financial reports and conducting extensive interviews with industry leaders such as CEOs, VPs, directors, and marketing executives. Secondary sources were used to determine all percentage shares and breakdowns, which were then verified through primary sources. All parameters that could impact the markets covered in this research study were accounted for, analyzed in detail, verified through primary research, and consolidated to obtain the final quantitative and qualitative data.

Global Smart Locker Market Size: Botton Up Approach

  • Identifying various smart locker manufacturers
  • Analyzing the penetration of each component through secondary and primary research
  • Analyzing integration of smart locker in different applications through secondary and primary research
  • Conducting multiple discussions with key opinion leaders to understand the detailed working of smart lockers and their implementation in multiple industries; this helped analyze the break-up of the scope of work carried out by each major company
  • Verifying and cross-checking the estimates at every level with key opinion leaders, including CEOs, directors, operation managers, and finally with the domain experts at MarketsandMarkets
  • Studying various paid and unpaid sources of information, such as annual reports, press releases, white papers, and databases

Smart Locker Market Size, and Botton Up Approach

Global Smart locker Market Size: Top Down Approach

The top-down approach has been used to estimate and validate the total size of the smart locker market.

  • Focusing initially on the R&D investments and expenditures being made in the ecosystem of the smart locker market, further splitting the market on the basis of offering, technology, deployment, application, end-use industry, and region, and listing the key developments
  • Identifying leading players in the smart locker market through secondary research and verifying them through brief discussions with industry experts
  • Analyzing revenue, product mix, geographic presence, and key applications for which products are served by all identified players to estimate and arrive at percentage splits for all key segments
  • Discussing splits with industry experts to validate the information and identify key growth pockets across all key segments
  • Breaking down the total market based on verified splits and key growth pockets across all segments

Smart Locker Market Size, and Top Down Approach

Data Triangulation

Once the overall size of the smart locker market was determined using the methods described above, it was divided into multiple segments and subsegments. Market engineering was performed for each segment and subsegment using market breakdown and data triangulation methods, as applicable, to obtain accurate statistics. To triangulate the data, various factors and trends from the demand and supply sides were studied. The market was validated using both top-down and bottom-up approaches.

Market Definition

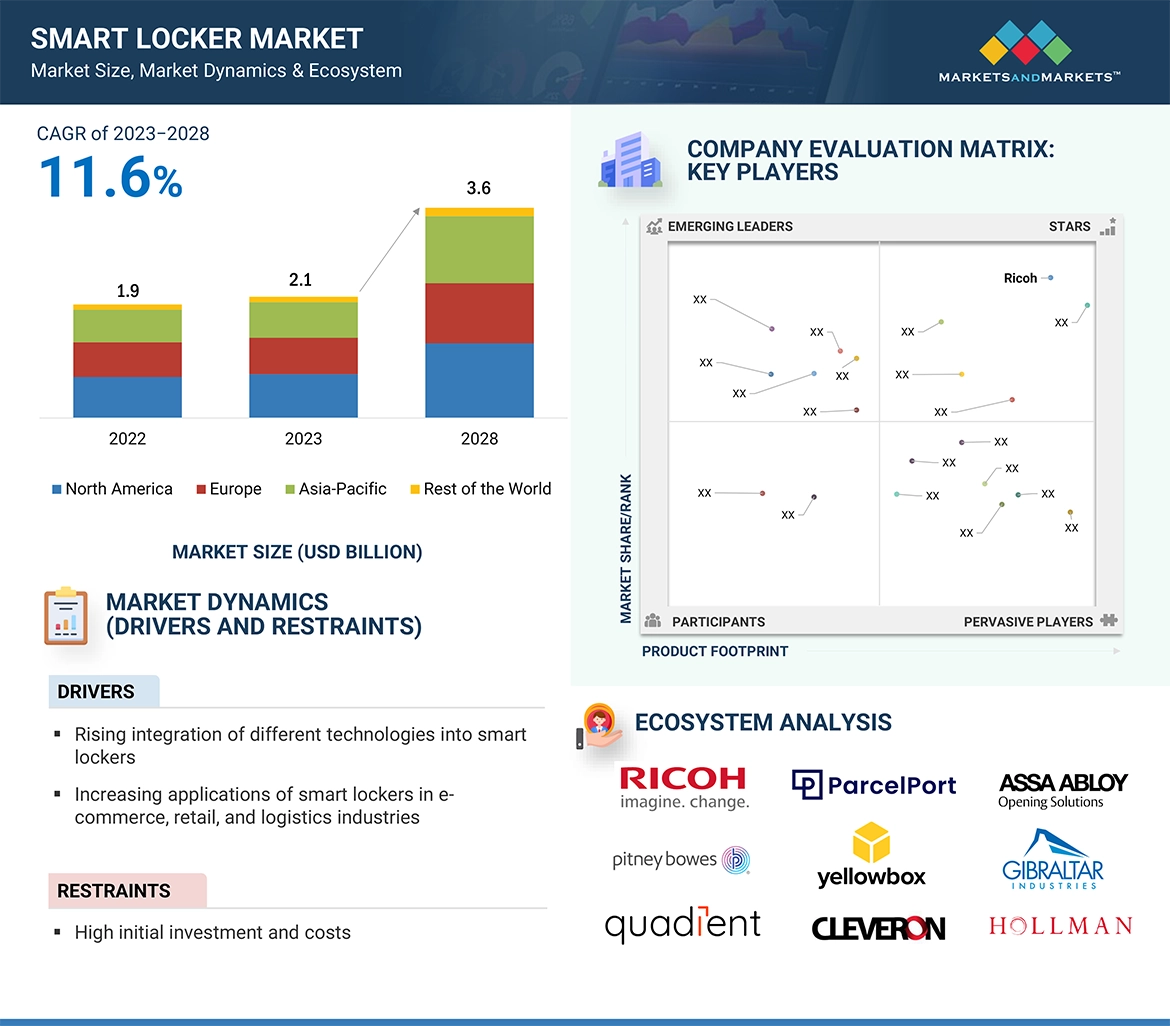
Smart lockers are storage containers that use Internet of Things (IoT) technology to connect to the Internet and provide people with a convenient way to store their belongings or to protect assets in factory and warehouse environments. The ultimate purpose of smart lockers is the usage of smart locker software. These smart locker systems are especially popular in offices, warehouses, retail chains, accounting firms, solicitor’s offices, and public service headquarters. Two main advantages include keeping items safe and secure, but more so, for the administrators gathering insightful data on usage and security via the provided software by these smart locker solutions.
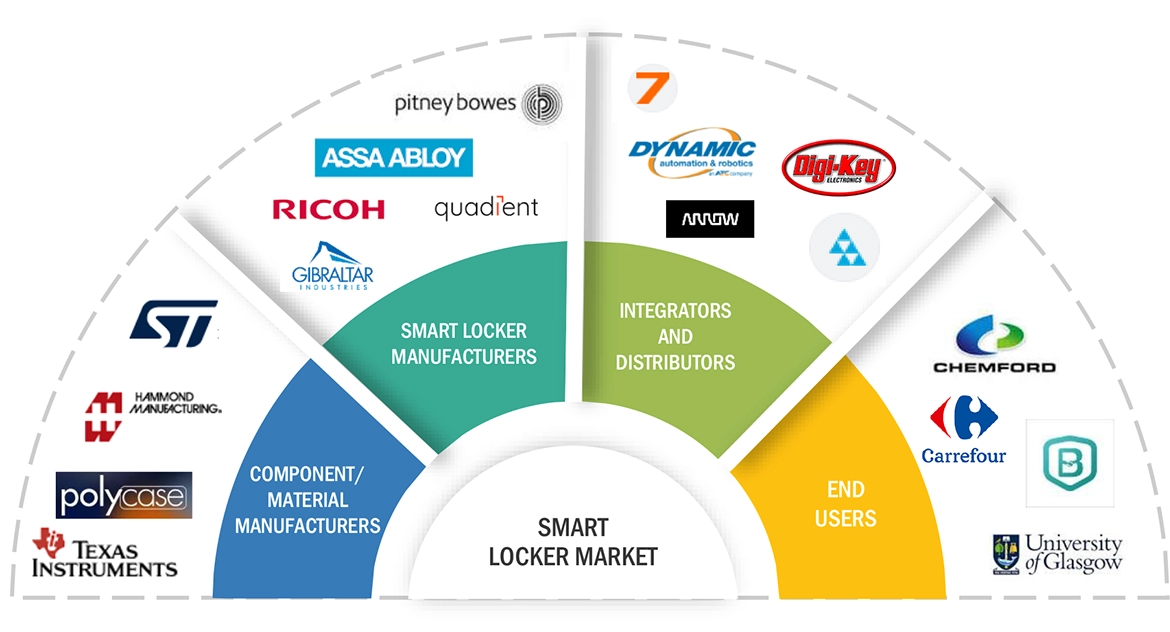
Key Stakeholders

  • Smart locker Manufacturers
  • Smart locker Suppliers
  • Smart locker Integrators
  • Smart locker distributors
  • Smart locker software solution providers
  • Technology investors
  • Research organizations
  • Analysts and strategic business planners
  • Venture capitalists, private equity firms, and startups
  • Educational Institutes and Universities
  • Component Suppliers and Distributors
  • Logistics and shipment companies

Report Objectives

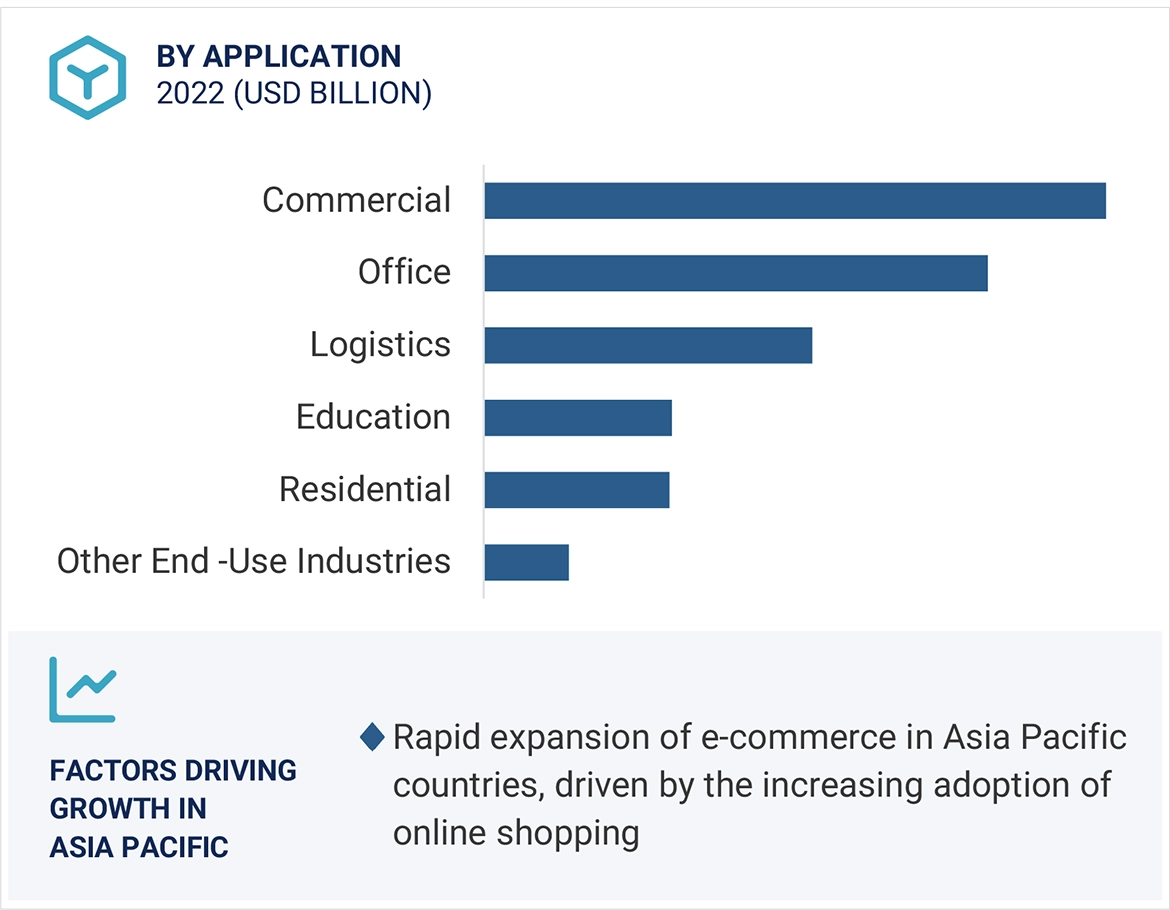
  • To define, describe, and forecast the smart locker market based on offering, technology, deployment, application, end-use industry and region
  • To forecast the size of the market segments for four major regions—North America, Europe, Asia Pacific (APAC), and the Rest of the World (RoW)
  • To provide detailed information regarding the major factors influencing the growth of the market (drivers, restraints, opportunities, and challenges)
  • To strategically analyze micromarkets1 with respect to individual growth trends, prospects, and contributions to the total market
  • To study the complete value chain and allied industry segments and perform a market value chain analysis.
  • To provide ecosystem analysis, case study analysis, patent analysis, technology analysis, pricing analysis, porter’s five forces analysis, key stakeholders and buying criteria, key conferences and events, and regulatory bodies, government agencies, and regulations pertaining to the market
  • To strategically profile the key players and comprehensively analyze their market shares and core competencies2.
  • To analyze the opportunities in the market for stakeholders and describe the competitive landscape of the market.
  • To analyze competitive developments such as collaborations, agreements, contracts, partnerships, mergers & acquisitions, product launches, and research & development (R&D) in the market
  • To analyze the impact of the recession on the smart locker market

Available customizations:

With the given market data, MarketsandMarkets offers customizations according to the specific requirements of companies. The following customization options are available for the report:

  • Detailed analysis and profiling of additional market players (up to 5)
  • Additional country-level analysis of the smart locker market

Product Analysis

  • Product matrix, which provides a detailed comparison of the product portfolio of each company in the smart locker market.
Custom Market Research Services

We will customize the research for you, in case the report listed above does not meet with your exact requirements. Our custom research will comprehensively cover the business information you require to help you arrive at strategic and profitable business decisions.

Request Customization
Report Code
SE 8856
Published ON
Nov, 2023
Choose License Type
BUY NOW
  • SHARE
X
Request Customization
Speak to Analyst
Speak to Analyst
OR FACE-TO-FACE MEETING
PERSONALIZE THIS RESEARCH
  • Triangulate with your Own Data
  • Get Data as per your Format and Definition
  • Gain a Deeper Dive on a Specific Application, Geography, Customer or Competitor
  • Any level of Personalization
REQUEST A FREE CUSTOMIZATION
LET US HELP YOU!
  • What are the Known and Unknown Adjacencies Impacting the Smart Locker Market
  • What will your New Revenue Sources be?
  • Who will be your Top Customer; what will make them switch?
  • Defend your Market Share or Win Competitors
  • Get a Scorecard for Target Partners
CUSTOMIZED WORKSHOP REQUEST
  • Call Us
  • +1-888-600-6441 (Corporate office hours)
  • +1-888-600-6441 (US/Can toll free)
  • +44-800-368-9399 (UK office hours)
CONNECT WITH US
ABOUT TRUST ONLINE
©2024 MarketsandMarkets Research Private Ltd. All rights reserved
DMCA.com Protection Status Website Feedback