
Sodium Perborate Market

Sodium Perborate Market by Type (Sodium Perborate Monohydrate, Sodium Perborate Tetrahydrate), End-use Industry (Household & Industrial Cleaning, Healthcare & Pharmaceutical, Textile), and Region - Global Forecast to 2030


OVERVIEW

Source: Secondary Research, Interviews with Experts, MarketsandMarkets Analysis
The sodium perborate market is expected to reach USD 184.0 million by 2030 from USD 153.3 million in 2025, at a CAGR of 3.7% during the forecast period. The sodium perborate market is experiencing a surge in growth due to increasing demand from sectors such as detergents, bleach agents, and consumer/industrial cleaners. The growth stems from the increasing need for hygiene and environmentally friendly solutions. Sodium perborate is widely used as a bleaching agent and pre-treatment agent for textiles, and it is much more attractive as a stable reagents and environmentally safe oxidizer. The antimicrobial properties of sodium perborate are increasing demand in medical and dental settings. Its use is also increasing in advanced water treatment applications due to its chlorine-free status. The growth is supplemented by urbanization and industrialization trends in developing countries, largely in the sectors of medical, textile, and sanitation sectors, and the combined demand will further spur global demand for sodium perborate.
KEY TAKEAWAYS
-
BY TYPEThe sodium perborate market is primarily segmented into sodium perborate tetrahydrate and sodium perborate monohydrate. Sodium perborate tetrahydrate being the fastest-growing segment due to its stability, cost-effectiveness, and widespread use in detergents and cleaning products, while monohydrate serves specialized applications.
-
BY END-USE INDUSTRYKey end-use industries for sodium perborate include Household & Industrial Cleaning, Personal Care & Cosmetics, Textile Industry, Pulp & Paper Industry, Healthcare & Pharmaceuticals, and Other End-use Industries. Household & Industrial Cleaning is the fastest-growing segment, driven by the rising demand for effective bleaching, eco-friendly cleaning solutions, and enhanced disinfection across consumer and industrial products.
-
BY REGIONAsia Pacific is the fastest-growing region in the sodium perborate market, driven by rising demand in detergents, cleaning products, textiles, and personal care applications.
-
COMPETITIVE LANDSCAPEThe major market players have adopted both organic and inorganic strategies, including partnerships and investments. For instance, Thermo Fisher Scientific Inc., Merck KGaA, Evonik Treibacher GmbH, Belinka Perkemija, d.o.o., and Fengchen Group Co., Ltd. entered into a number of agreements, partnerships, product launches, and expansions to cater to the growing demand for sodium perborate across innovative applications.
The global sodium perborate market is witnessing steady expansion, fueled by its diverse uses in several sectors. Sodium perborate serves as a consistent source of active oxygen, largely employed in laundry detergents, cleaning agents for domestic and industrial usage, and oral hygiene products. Its capacity to release oxygen upon dissolution renders it an efficient bleaching and disinfection agent, corresponding with the rising demand for environmentally friendly and low-toxicity alternatives in consumer products.
TRENDS & DISRUPTIONS IMPACTING CUSTOMERS' CUSTOMERS
The influence on customers' businesses in the sodium perborate market comes from shifting customer preferences and industry changes. Key sectors encompass makers of detergents, cleaning agents, textiles, pulp and paper, and personal care products, whilst target applications include laundry cleaning, bleaching, disinfection, and dental hygiene, representing the end consumers. Fluctuations in end-user demand consequently influence the revenues of hotbeds, ultimately affecting the entire sales and growth of sodium perborate manufacturers.

Source: Secondary Research, Interviews with Experts, MarketsandMarkets Analysis
MARKET DYNAMICS
Level
-
Growing Demand for detergents, bleaching agents, and cleaning products

-
Rising adoption in textile bleaching and pre-treatment processes

Level
-
Stringent environmental and chemical safety regulations

-
High competition from sodium percarbonate, hydrogen peroxide, and other alternatives

Level
-
Potential of sodium perborate in advanced water treatment

-
Rising demand in emerging economies

Level
-
Environmental concerns related to dust and water emissions

-
Supply chain disruptions and volatile raw material prices

Source: Secondary Research, Interviews with Experts, MarketsandMarkets Analysis
Driver: Growing Demand for detergents, bleaching agents, and cleaning products
The sodium perborate market is expanding aggressively due to rising demand for detergents, bleaching agents, and cleaning agents in household, healthcare, and industrial uses. With increasing awareness of cleanliness and hygiene, especially post-COVID-19, sodium perborate has gained attention as an antimicrobial and oxidizing agent. Appreciated for its stability, environmental sustainability, and chlorine-free composition, it is ideal for sustainable cleaning products. In healthcare, where more than 3.5 million healthcare-associated infections occur each year in the EU/EEA, sodium perborate helps in infection prevention through its hydrogen peroxide-releasing mechanism. Its application in laundry is strengthened by increasing household washing frequency, and in conjunction with TAED, it proves effective at energy-efficient temperatures. Its adaptability encompasses surface sanitizers and disinfectants, affirming its significance in contemporary hygiene.
Restraint: Stringent environmental and chemical safety regulations
The sodium perborate market is under increased scrutiny due to environmental and chemical safety regulations in various regions. Used as a bleaching and oxidizing ingredient in detergents, cleaning agents, and personal care products, it faces scrutiny due to reproductive toxicity, aquatic toxicity, and boron buildup in water. It is a Substance of Very High Concern (SVHC) in the EU REACH Regulation for reproductive hazards Category 1B, as well as having extra compliance under Regulation (EU) 2020/878, CLP Regulation, and EU Detergent Regulation with boron content restrictions. Under TSCA in the US, it could result in restrictions. These regulations have induced reformulation and replacement with safer chemicals, such as sodium percarbonate, which could have reduced demand in household cleaners, dental health products, and cosmetics.
Opportunity: Potential of sodium perborate in advanced water treatment
Sodium perborate is a good disinfectant in water treatment that eliminates bacteria and other pathogens to make the water clean and safe. It also supplies oxygen to the bioremediation process, which stimulates microbial activity to break down the pollutants in the polluted water and soil. Sodium perborate monohydrate (approximately 16% active oxygen) and sodium perborate tetrahydrate (approximately 10%) allow for controlled release of oxygen, maintaining a high oxidation potential, making them useful for disinfection and pollutant degradation. As only 3% of water on Earth is freshwater, and the rest comprises saline water of seas and oceans, wastewater treatment, therefore, has become quite significant for the health of people and the protection of the environment.
Challenges: Environmental concerns related to dust and water emissions
The sodium perborate industry is subject to increasing pressure from tough environmental regulation, especially dust and water emission. Drying, handling, and packaging dust continues to present a problem, with industry norms of 5–20 mg/m³, while the smaller or older plants find it difficult to live within the 20 mg/Nm³ constraint, adding costs to production and making it less competitive. Water emissions also pose an issue by way of boron discharge, which is environmentally persistent and plant toxic, from 13 g to 5 kg of product per ton. Regulations, for example Austria's 0.35 kg/t boron limit, require expensive water treatment outlays. Sodium perborate's degradation to hydrogen peroxide and boric acid poses ecological problems, with the industry responding to move towards greener technologies and possibly restraining market expansion.
Sodium Perborate Market: COMMERCIAL USE CASES ACROSS INDUSTRIES
| COMPANY | USE CASE DESCRIPTION | BENEFITS |
|---|---|---|
 |
Henkel utilizes sodium perborate in Persil laundry detergents to enhance stain removal and whitening effects. | Sodium perborate releases hydrogen peroxide upon contact with water, providing effective bleaching at lower temperatures and reducing the need for chlorine-based bleaches. |
 |
Evonik employs sodium perborate in home cleaning products, including all-purpose cleaners and dishwashing detergents. | It serves as a sustainable bleaching agent, effectively removing stains and odors while being gentle on surfaces. |
 |
A case report described the treatment of a darkened primary tooth in a 4-year-old child using the walking bleach technique with sodium perborate. | Achieved significant esthetic improvement without adverse clinical or radiographic effects over a one-year follow-up period. |
 |
Sodium perborate tetrahydrate – Used in laboratory and industrial cleaning products, including the Extran line of cleaning agents. | Oxidative stain removal; efficient surface cleaning; reliable for lab and industrial environments |
Logos and trademarks shown above are the property of their respective owners. Their use here is for informational and illustrative purposes only.
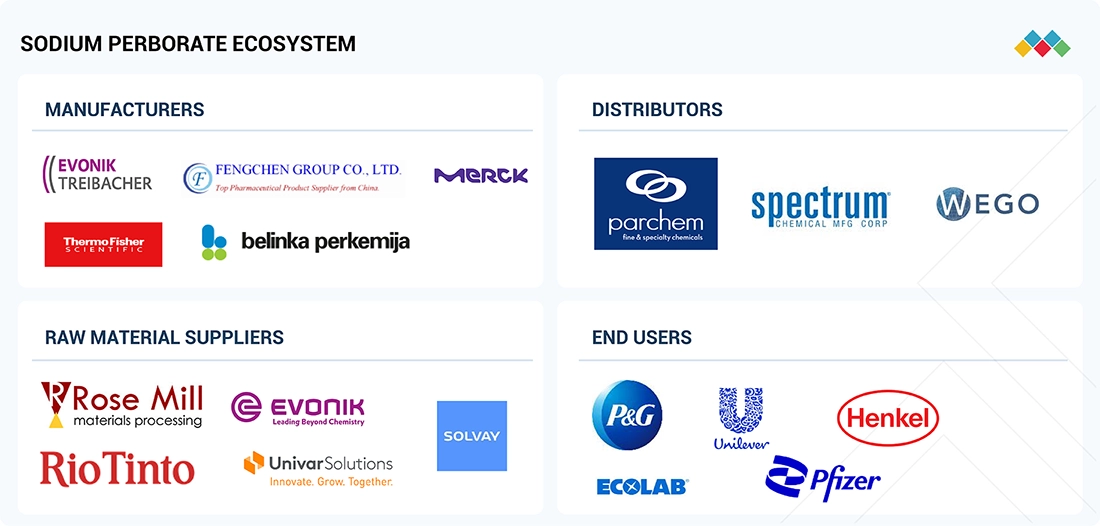
MARKET ECOSYSTEM
The sodium perborate market ecosystem includes raw material suppliers, sodium perborate manufacturers, distributors, and end users. Raw material suppliers offer major components, such as borax/boric acid, hydrogen peroxide, sodium hydroxide, and pH additives. Sodium perborate manufacturers produce sodium perborate of different grades to meet the needs of numerous end-use industries without compromising on regulatory requirements. Distributors bring market access through a proper supply chain. The household & industrial cleaning, healthcare & pharmaceutical, textile, personal care & cosmetics, and paper & pulp industries employ sodium perborate to deliver specific bleaching, disinfecting, and oxidizing properties in their applications.
Logos and trademarks shown above are the property of their respective owners. Their use here is for informational and illustrative purposes only.
MARKET SEGMENTS

Source: Secondary Research, Interviews with Experts, MarketsandMarkets Analysis
Sodium Perborate Market, By Type
Sodium perborate tetrahydrate, whose molecular weight is 153.86 g/mol, dominated the world market for sodium perborate in 2024 due to its affordability, solubility, and versatile uses. It consists of four water molecules (~47% of the weight) and decomposes at approximately 60°C to leave active oxygen and borates. Its quick solubility also makes it well-suited for laundry detergents, denture cleaners, and other oxygen-based cleaning products, even with lower humidity stability. It decomposes to produce hydrogen peroxide and an alkaline solution that can bleach, disinfect, and/or create harmless residues. Its efficiency and price make it highly sought after, particularly in the Asia-Pacific.
Sodium Perborate Market, By End-use Industry
The sodium perborate market was largely driven by the household & industrial cleaning segment in 2024 with the increase in consumer awareness of hygiene and the demand for safe, effective, and environmentally friendly cleaning agents. Sodium perborate has several applications in household cleaning products, because the chemical is recognized for several characteristics, including stable release of active oxygen, non-chlorine bleaching, and powerful disinfectant properties, and is used in cleaners, bleach, and multi-surface disinfectants. The COVID-19 pandemic also increased consumer attention on hygiene, while healthcare-associated infections reinforce the need for effective disinfectants.
REGION
Asia Pacific to be the fastest-growing region in the global sodium perborate market during the forecast period
The Asia Pacific region is expected to become the fastest-growing segment in the worldwide sodium perborate market in the next few years. This is mainly fueled by the industrialization of the region, the growing population, and the rising demand for cleaning and personal care products. Additionally, the application of sodium perborate in the textile and paper sectors, both of which are growing very fast in the Asia Pacific, further supports the upward trend in the market. In countries like China, India, and Vietnam, where textile exports are the key driver of economic development, there is a significant tendency towards adopting cost-efficient and eco-friendly bleaching chemicals such as sodium perborate. This increasing demand is driven primarily by tightening environmental regulations, skyrocketing energy prices, and mounting international pressure for environmentally friendly textiles manufacturing.

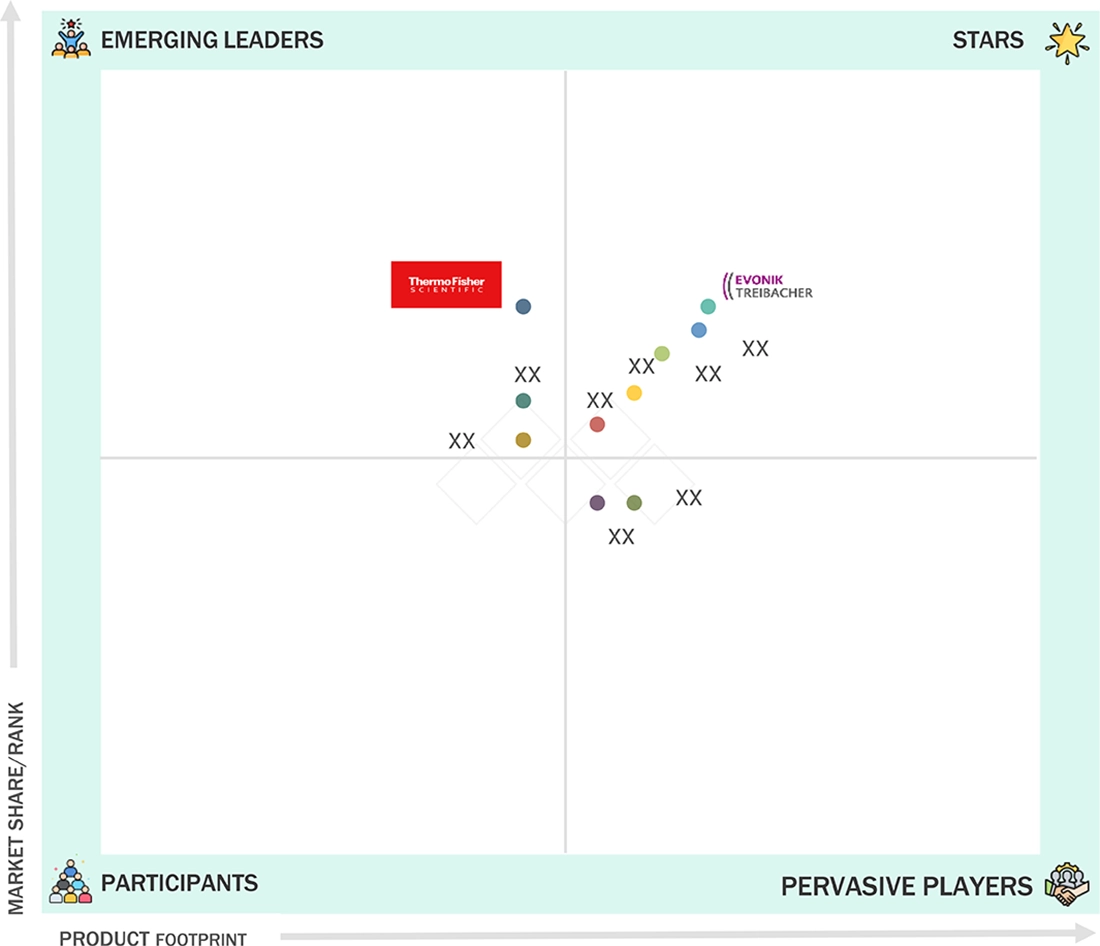
Sodium Perborate Market: COMPANY EVALUATION MATRIX
Evonik Treibacher GmbH (Star) leads the sodium perborate market with its global presence, wide product portfolio, and R&D competences that encourage multiple industries to expand the application of sodium perborate into detergents, cleaning, personal care and industrial applications. Thermo Fisher Scientific Inc. (Emerging Leader) who aims to differentiate itself by developing and providing innovative solutions for sodium perborate in healthcare, laboratory, and specialty industrial applications, is gaining footing within the leader quadrant, expanding its focus on quality, safety, and tailored offer based solutions.
Source: Secondary Research, Interviews with Experts, MarketsandMarkets Analysis
KEY MARKET PLAYERS
MARKET SCOPE
| REPORT METRIC | DETAILS |
|---|---|
| Market Size in 2024 (Value) | USD 147.9 MN |
| Market Forecast in 2030 (Value) | USD 184.0 MN |
| CAGR | 3.7% |
| Years Considered | 2023–2030 |
| Base Year | 2024 |
| Forecast Period | 2025–2030 |
| Units Considered | Value (USD MN), Volume (Tons) |
| Report Coverage | Revenue forecast, company ranking, competitive landscape, growth factors, and trends |
| Segments Covered | • Type: Sodium Perborate Monohydrate and Sodium Perborate Tetrahydrate • End-use Industry: Household & Industrial Cleaning, Personal Care & Cosmetics, Textile Industry, Pulp & Paper Industry, Healthcare & Pharmaceuticals, and Other End-use Industries |
| Regions Covered | North America, Europe, Asia Pacific, Middle East & Africa, and South America |
WHAT IS IN IT FOR YOU: Sodium Perborate Market REPORT CONTENT GUIDE

DELIVERED CUSTOMIZATIONS
We have successfully delivered the following deep-dive customizations:
| CLIENT REQUEST | CUSTOMIZATION DELIVERED | VALUE ADDS |
|---|---|---|
| U.S.-based Sodium Perborate Manufacturer | • Detailed profiles of key sodium perborate producers (financials, product range, key strategies, developments) • Segment-wise demand mapping • Analysis of partnership & distribution networks | • Identified & profiled 20+ sodium perborate manufacturing companies • Identify regional market gaps and supply chain vulnerabilities • Target and prioritize high-value customer segments for business development • Detect sector-specific growth inflection points |
| Sodium Perborate Tetrahydrate Manufacturer | • Comparative benchmarking of sodium perborate tetrahydrate manufacturers and technology trends • Mapping of leading detergent, cleaning and textile end users • Evaluation of switching costs, performance trends, and regulatory risk by application | • Identify and forecast migration trends • Insights on emerging value pockets in high-performance laundry and cleaning chemicals • Focus on regulatory-driven opportunities for product differentiation |
| Sodium Perborate Monohydrate Manufacturer | • Producer benchmarking (capacity, cost structure, technology licensing) • Analysis of end-use diversification (personal care, healthcare, advanced textiles) • Regulatory and sustainability assessment (hazard, labeling, export controls) | • Mapping of specialized and value-added niche applications (oral care, food hygiene, pharma) • Guidance on untapped market channels and demand in emerging economies • Positioning for sustainability-linked procurement and R&D incentives |
RECENT DEVELOPMENTS
- June 2024 : Merck expanded its Schnelldorf Distribution Centre by USD 195.4 million, adding 25,000 square meters and almost doubling its size. The center now features new down-filling capacity and increased distribution space to support Life Science customers.
- May 2024 : Thermo Fisher Scientific signed a strategic distribution deal with Bio-Techne Corporation to improve the availability of Bio-Techne's life sciences products throughout Europe.
- April 2024 : Thermo Fisher Scientific will strengthen its presence in Indonesia by opening its first official office in Jakarta. The growth is set to enhance healthcare, environmental solutions, and food safety.
- December 2023 : Catalynt acquired American Chemie, Inc., a TX-based specialty chemical distributor.
- March 2022 : Junsei Chemical Co., Ltd. finished the third phase of expansion in its Ibaraki Plant. Its Construction included building the fourth synthesis building, which improved the facility's production capacity.
Table of Contents
 Exclusive indicates content/data unique to MarketsandMarkets and not available with any competitors.
Methodology
The study comprised four key activities aimed at quantifying the current global sodium perborate market. Initially, an extensive secondary research phase was undertaken to gather data on the market dynamics, related product markets, and the overarching parent product group. Following this, primary research was conducted to validate the findings, assumptions, and market size estimates with industry experts across the sodium perborate value chain. Both top-down and bottom-up methodologies were utilized to derive the overall market size, ensuring a comprehensive perspective. Subsequently, market segmentation analysis and data triangulation techniques were applied to accurately set the sizes of various market segments and sub-segments.
Secondary Research
The market size of the companies offering sodium perborate was arrived at by secondary data available through paid and unpaid sources, analyzing the product portfolios of the major companies in the ecosystem, and rating the companies by their performance and quality. Various secondary sources, such as Business Standard, Bloomberg, World Bank, and Factiva, were referred to identify and collect information for this study on the sodium perborate market. In the secondary research process, various secondary sources were referred to identify and collect information related to the study. Secondary sources included annual reports, press releases, and investor presentations of sodium perborate vendors, forums, certified publications, and whitepapers. The secondary research was used to obtain critical information on the industry’s value chain, the total pool of key players, market classification, and segmentation from the market and technology-oriented perspectives.
Primary Research
In the primary research process, various primary sources from both the supply and demand sides were interviewed to obtain qualitative and quantitative information for this report. The primary sources from the supply side included industry experts, such as Chief Executive Officers (CEOs), Vice Presidents (VPs), marketing directors, technology and innovation directors, and related key executives from several key companies and organizations operating in the sodium perborate market. After the complete market engineering (calculations for market statistics, market breakdown, market size estimations, market forecasting, and data triangulation), extensive primary research was conducted to gather information and verify and validate the critical numbers arrived at. Primary research was also conducted to identify the segmentation types, industry trends, competitive landscape of sodium perborate offered by various market players, and key market dynamics, such as drivers, restraints, opportunities, challenges, industry trends, and key player strategies. In the complete market engineering process, the top-down and bottom-up approaches and several data triangulation methods were extensively used to perform the market estimation and market forecasting for the overall market segments and subsegments listed in this report. Extensive qualitative and quantitative analysis was performed on the complete market engineering process to list the key information/insights throughout the report.
Following is the breakdown of primary respondents:

Notes: Other designations include sales, marketing, and product managers.
Tier 1: >USD 1 Billion; Tier 2: USD 500 million–1 Billion; and Tier 3: < USD 500 million.
To know about the assumptions considered for the study, download the pdf brochure
Market Size Estimation
The top-down and bottom-up approaches were used to estimate and validate the size of the global sodium perborate market. These approaches were also used extensively to estimate the size of various dependent market segments.

Data Triangulation
After arriving at the overall market size using the market size estimation processes, the market was split into several segments and subsegments. The data triangulation and market breakup procedures were employed, wherever applicable, to complete the overall market engineering process and arrive at the exact statistics of each market segment and subsegment. The data was triangulated by studying various factors and trends from both the demand and supply sides.
Market Definition
Sodium perborate is a white, odorless, crystalline substance with the formula NaBO3-nH2O (usually present as a monohydrate (n=1) or tetrahydrate (n=4). It is used as a bleaching agent, disinfectant, and oxidizing agent. In an aqueous solution, it decomposes to release hydrogen peroxide, which imparts it with strong cleaning and antimicrobial activity. It is easier to handle and store in its solid state as it is more stable than liquid hydrogen peroxide. As sodium perborate has an oxygen-based bleaching and disinfecting action, it is widely used in laundry detergents, industrial cleaners, mouthwashes, toothpaste, and some cosmetic and pharmaceutical applications.
Stakeholders
- Sodium perborate manufacturers
- Raw material suppliers
- Converters & processors
- Distributors and traders
- Industry associations and regulatory bodies
- End users
Report Objectives
- To define, describe, and forecast the size of the global sodium perborate market based on type, end-use industry, and region in terms of value and volume
- To provide detailed information on the significant drivers, restraints, opportunities, and challenges influencing the market
- To strategically analyze micromarkets concerning individual growth trends, prospects, and their contribution to the market
- To assess the growth opportunities in the market for stakeholders and provide details on the competitive landscape for market leaders
- To forecast the market size of segments and subsegments for North America, Europe, Asia Pacific, South America, and the Middle East & Africa
- To strategically profile key players and comprehensively analyze their market shares and core competencies
- To analyze competitive developments such as acquisitions, expansions, and agreements in the sodium perborate market
- To provide the impact of AI/Gen AI on the market
Key Questions Addressed by the Report
Need a Tailored Report?
Customize this report to your needs
Get 10% FREE Customization
Customize This ReportPersonalize This Research
- Triangulate with your Own Data
- Get Data as per your Format and Definition
- Gain a Deeper Dive on a Specific Application, Geography, Customer or Competitor
- Any level of Personalization
Let Us Help You
- What are the Known and Unknown Adjacencies Impacting the Sodium Perborate Market
- What will your New Revenue Sources be?
- Who will be your Top Customer; what will make them switch?
- Defend your Market Share or Win Competitors
- Get a Scorecard for Target Partners

Custom Market Research Services
We Will Customise The Research For You, In Case The Report Listed Above Does Not Meet With Your Requirements
Get 10% Free CustomisationTESTIMONIALS

We at Nissan Chemicals Corporation have been clients of MarketsandMarkets for more than a year now. We recently consulted MarketsandMarkets for a study, the team at MarketsandMarkets was extremely professional and organized. The business insights were very detailed and aligned well with our expectations that really helped us formulate the Business Plans and device new strategies for development themes. MarketsandMarkets offers a unique combination of expertise and dedicated engagement model. Their research findings have helped us in designing our Pricing Strategy which will make it easier for us to predict the future sales and profits for the next ten years. We look forward to working with MarketsandMarkets in the future.
VP of Strategy & New Business Development
Leading Specialty Chemical Company
The MarketsandMarkets Engagement Model, composed of both the Knowledge Store and advisory custom research, has greatly helped us in understanding our markets and making strategic decisions. The Knowledge Store is a fast way to allow everyone in our organization to understand more about most any market they are interested in. The ability to then get custom research done and get answers to specific strategic questions and market insight has been spectacular. The Markets and Markets team feel more like colleagues than vendors and their services have helped us change our culture where statements of things like growth opportunities and competitive position are always backed by industry research.

Rich Gibson,
Director, Corporate Strategy
Milliken & Company,
Leading Industrial Manufacturer of specialty chemical, floor covering, performance and protective textile materials, and healthcaremilliken.com
MarketsandMarkets is a trusted resource that helps us to better understand markets that are near-adjacencies-whether its technology, value chain or geography. Their Knowledge Store platform provides a dashboard of markets and their characteristics which is easy to use and saves us time.
Adam Shaw,
Market Development and Strategy Manager
AdvanSix Inc. USA,
An American Leader in Chemicalswww.advansix.com
The Knowledge Store from MarketsandMarkets is a valuable tool which has helped my team acquire greater insight in to the end markets that our business serves. This has enabled us to help our company build stronger strategies throughout our planning process.
TOSHIO KINOSHITA
Senior Chif Consultion Research & Consulting Division
Mitsubishi Chemical Research Corporation,
Leading Manufacturer of Chemical Productswww.mitsubishichem-res.co.jp/en/

We recently engaged with MarketsandMarkets for a study, the team not only clearly understood our business objectives but was also extremely professional in the way they handled the entire project. The study was efficiently conducted in a phase-wise manner, and the engagement model furnished us with high-quality business insights that far exceeded our expectations at each phase. We were especially happy that MarketsandMarkets could provide us with both, an English as well as a Japanese version of the study. A special thanks to the Analyst Team and Client Services Team, whose fluency in Japanese enhanced our comfort level, as we could converse with them in our preferred language.
Independent entrepreneurs
Arrow Precision
We approached MarketsandMarkets for study on Proppants Market, and their work exceeded our expectations. The study conducted was comprehensive and enabled us to view the market through the various dimensions. In addition, the team was extraordinarily responsive throughout the process and resolved our queries on time. I strongly recommend MarketsandMarkets and will certainly consider them for additional market assessments we will need in the future.
Global engineering company, Japan
Deputy Manager,
Strategic Planning OfficeThe high-quality insights shared by the MarketsandMarkets team helped us understand the pharmaceutical plant designers in a specific geography. It also captured the risks that we may likely face in communicating with our potential partners. The study would enable us identify partners, which would impact our future growth.


Growth opportunities and latent adjacency in Sodium Perborate Market