Steel Wire Rope Market by Lay Type (Regular, Lang), Material Type (Carbon Steel, Galvanized Steel, Stainless Steel), Coating, Diameter, Application (Construction, Mining, Marine & Fishing, Industrial & Crane, Oil & Gas), and Region - Global Forecast to 2030

Updated on : November 27, 2025

icon1
USD USD 13.88 Billion
MARKET SIZE, 2030
icon2
CAGR 5.8%
(2025-2030)
icon3
250
REPORT PAGES
icon4
200
MARKET TABLES

STEEL WIRE ROPE MARKET OVERVIEW

Source: Secondary Research, Interviews with Experts, MarketsandMarkets Analysis

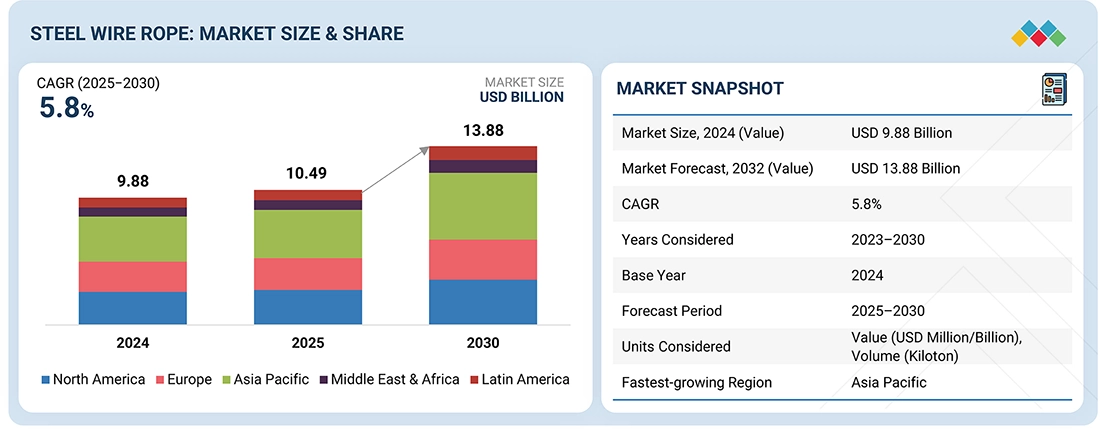
The steel wire rope market is projected to reach USD 13.88 billion by 2030 from USD 10.49 billion in 2025, at a CAGR of 5.8%. The global steel wire rope market is primarily driven by increasing global infrastructure and construction activities, especially in emerging economies where urban development is rapidly advancing. Demand is notably strong in sectors such as construction, mining, oil & gas, and marine, where steel wire ropes are essential for lifting, hoisting, and rigging heavy materials. The material’s high tensile strength, durability, and resistance to corrosion make it indispensable in these applications. Government initiatives, such as national infrastructure programs and large-scale industrial projects, further stimulate demand.

KEY TAKEAWAYS

  • BY LAY TYPE
    The steel wire rope market mainly consists of two types of lay: regular lay and lang lay. The regular lay type is estimated to account for the largest share in the market in terms of value because this configuration offers strong all-around performance and is the default choice for the bulk of standard industrial and construction applications.
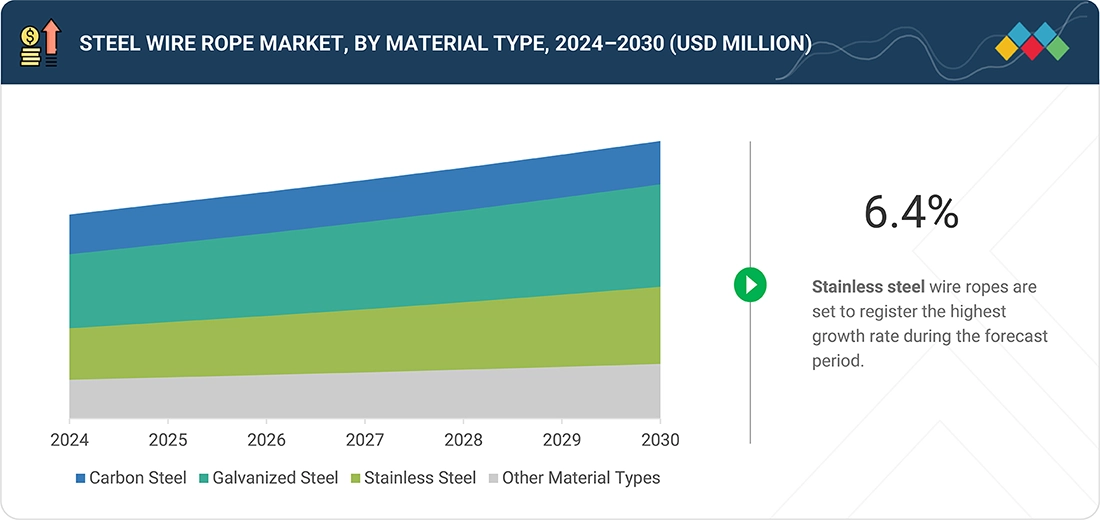
  • BY MATERIAL TYPE
    The steel wire rope market is segmented based on material type into carbon steel, galvanized steel, stainless steel, and other material types. Carbon steel accounted for the largest market share in 2024, while the stainless steel segment is projected to register the highest CAGR during the forecast period.
  • BY COATING
    The steel wire rope market is characterized into two types of coatings: non-plastic-coated and plastic-coated. Plastic-coated steel wire ropes are estimated to register the highest CAGR, in terms of value, during the forecast period due to their superior protection against corrosion, abrasion, and environmental damage offered by coatings such as PVC, PE, and nylon.
  • BY DIAMETER
    The steel wire ropes are bifurcated based on the diameter: ≤1/4 inch and >1/4 inch. The ≤1/4 inch segment accounted for the largest market share in 2024 due to its widespread use across various industries where flexibility, light weight, and cost-efficiency are essential.
  • BY APPLICATION
    Major applications of steel wire ropes include construction, mining, marine & fishing, industrial & crane, oil & gas, and other applications. The construction segment is projected to register the highest CAGR during the forecast period, due to the need for high-strength, durable, and reliable materials to support heavy loads and ensure safety in critical operations.
  • BY REGION
    The steel wire rope market covers Europe, North America, Asia Pacific, Latin America, and the Middle East & Africa. Asia Pacific is estimated to be the largest market for steel wire rope. The region is also projected to register the highest CAGR during the forecast period.
  • COMPETITIVE LANDSCAPE
    Major market players have adopted both organic and inorganic strategies, including partnerships and investments. Bekaert (Belgium), WireCo (US), and Kiswire Ltd. (South Korea) have entered into a number of agreements and partnerships to cater to the growing demand for steelwire ropes across innovative applications.

The steel wire rope market is experiencing significant growth driven by a surge in construction, mining, and marine applications worldwide. Advanced manufacturing techniques and the adoption of high-strength, lightweight wire ropes are enhancing product performance, safety, and efficiency, which is fueling market expansion. Industrial automation and infrastructure development, particularly in the Asia Pacific region, are principal factors boosting demand as countries like China and India invest heavily in large-scale projects. The integration of advanced rope monitoring technologies has helped steel wire rope manufacturers improve operational safety and longevity.

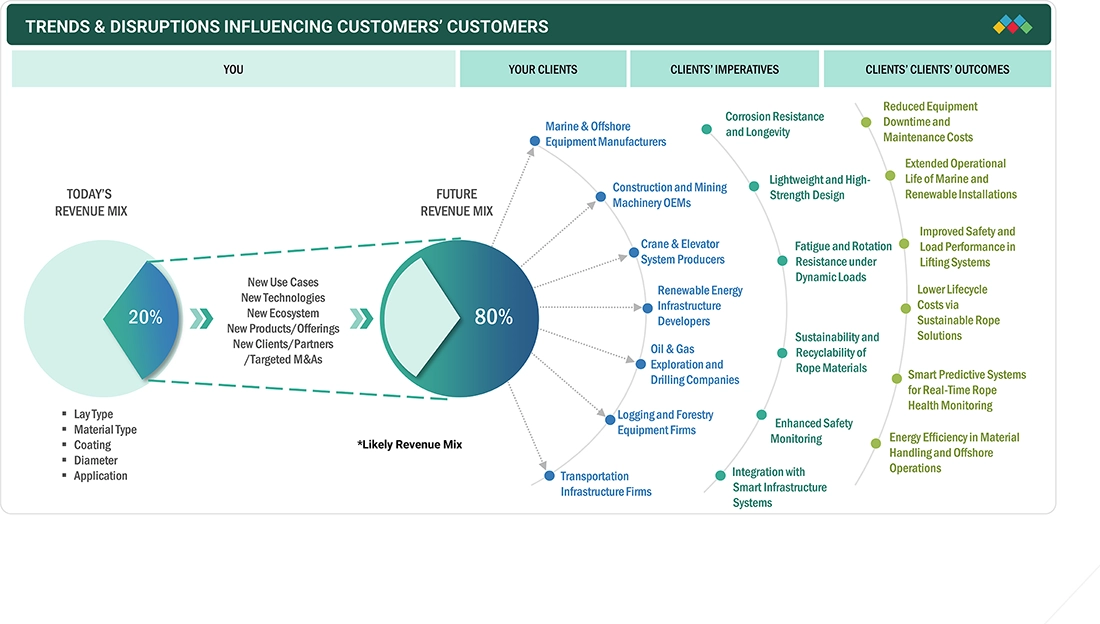
TRENDS & DISRUPTIONS IMPACTING CUSTOMERS' CUSTOMERS

Changes in customer trends or disruptions impact consumers’ businesses, which in turn affects the revenues of end users. Consequently, the revenue impact on end users is expected to affect the revenues of steel wire rope suppliers, which in turn impacts the revenues of steel wire rope manufacturers. Corrosion resistance, sustainability, and recyclability are key to improved safety, lower lifecycle costs, and reduced equipment downtime. Energy efficiency and smart monitoring of rope safety are key outcomes that vendors are aiming for.

Source: Secondary Research, Interviews with Experts, MarketsandMarkets Analysis

STEEL WIRE ROPE MARKET DYNAMICS

Drivers
Impact
Level
  • Rising demand from construction and infrastructure development
  • Expansion of mining operations and industrial activities
RESTRAINTS
Impact
Level
  • Fluctuating raw material prices
  • High competition from synthetic ropes
OPPORTUNITIES
Impact
Level
  • Growing expansion in renewable energy & marine applications
  • Integrating automation with smart rope technologies
CHALLENGES
Impact
Level
  • Intense market competition
  • Fatigue & breakage risk

Source: Secondary Research, Interviews with Experts, MarketsandMarkets Analysis

Driver: Rising demand from construction and infrastructure development

Global infrastructure expansion is driving strong demand for steel wire ropes, which are essential for lifting, hoisting, and structural applications in construction. As governments and private sectors invest in major projects such as bridges, tunnels, metros, wind farms, and high-rise buildings, the need for durable, high-tensile wire ropes continues to grow. This demand is closely linked to infrastructure spending, particularly in rapidly urbanizing and industrializing economies. Programs like India’s USD 4.5 trillion National Infrastructure Pipeline exemplify this trend. Beyond lifting, steel wire ropes play a critical role in ensuring safety and stability in modern construction, with their use expanding across megaprojects including airports, metro systems, and renewable energy installations.

Restraint: Fluctuating raw material prices

A key restraint in the steel wire rope market is the high volatility of raw material prices, especially steel and related alloys. Fluctuations in the costs of iron ore, coking coal, and scrap steel, driven by global supply chain issues, energy prices, trade policies, and geopolitical tensions, create unstable production expenses and pricing. This volatility makes it difficult for manufacturers to forecast costs, manage contracts, and maintain profitability. Smaller producers are particularly vulnerable to price shocks, reducing their competitiveness. Inconsistent material availability also disrupts production and delivery schedules, weakening supply chain reliability and hindering long-term industry growth.

Opportunity: Growing expansion in renewable energy & marine applications

The global steel wire rope market is poised for strong growth driven by the rapid expansion of renewable energy projects and marine industries. Increasing investments in offshore wind, tidal, and solar installations are boosting demand for durable, high-performance materials used in lifting, mooring, and cable management. Steel wire ropes, valued for their tensile strength, corrosion resistance, and load-bearing capacity, are vital in offshore wind farms for turbine installation, anchoring, and subsea operations. With global offshore wind capacity expected to exceed 100 GW in the EU alone by 2030, the need for corrosion-resistant ropes is set to surge. Similarly, marine sectors such as shipping, oil & gas, and port operations continue to demand advanced, long-lasting wire rope solutions. This growing focus on renewable and offshore applications presents major opportunities for manufacturers to innovate with lightweight, corrosion-resistant, and high-fatigue-life products to meet evolving industry needs.

Challenge: Intense market competition

The steel wire rope market is highly competitive due to numerous global and regional players offering largely standardized products, leading to intense price-based competition. Low-cost manufacturers, especially from countries with cheaper labor and materials, have escalated this pressure. To stay competitive, companies must cut costs, boost efficiency, and innovate through advanced technologies and R&D to meet growing demand for high-performance, durable ropes in industries like construction, mining, oil and gas, and marine. Additionally, strict regulatory standards add compliance costs. Success in this market depends on differentiation through innovation, quality, strong distribution, and after-sales support.

Steel Wire Rope Market: COMMERCIAL USE CASES ACROSS INDUSTRIES

COMPANY USE CASE DESCRIPTION BENEFITS
Uses steel wire ropes in bridge cable systems, tower cranes, and hoisting assemblies for heavy-lift operations on large building sites Enhances site safety, allows for high-capacity lifts, essential for large-scale infrastructure works
Employs steel wire ropes in mine hoists, draglines, and bulk material conveyors in both surface and underground mining Supports extremely heavy loads, withstands abrasion, and improves operational uptime in rugged settings
Utilizes wire ropes for ship mooring, cargo winches, and offshore support vessels, where corrosion resistance is key Facilitates safe and efficient docking, cargo handling, and supports offshore rig deployment
Applies steel wire ropes in offshore crane installation, deepwater mooring, and subsea construction Delivers high fatigue resistance, secure anchoring, and long service life in harsh marine environments

Logos and trademarks shown above are the property of their respective owners. Their use here is for informational and illustrative purposes only.

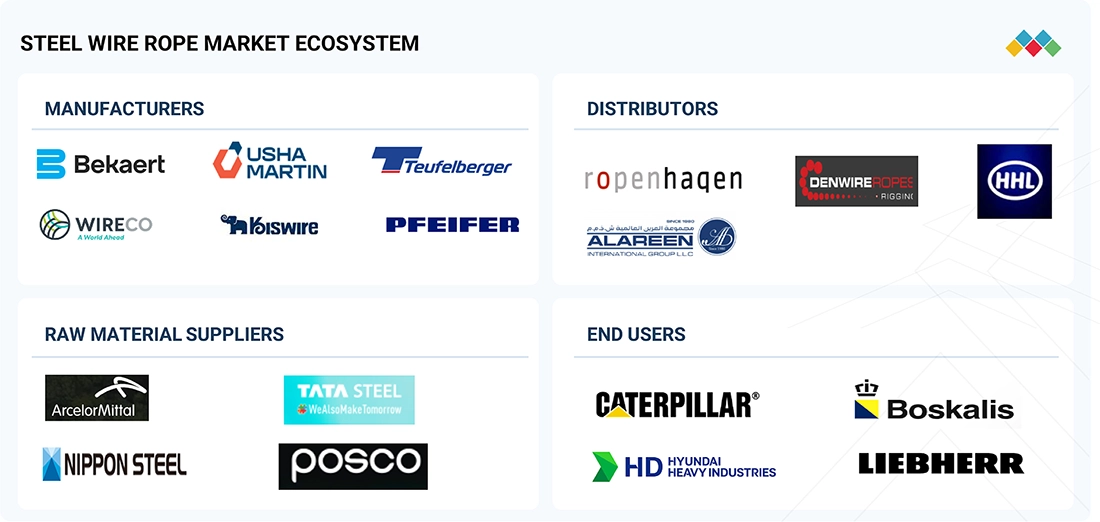
STEEL WIRE ROPE MARKET ECOSYSTEM

The steel wire rope ecosystem includes manufacturers, suppliers, distributors, and end-users across industries like construction, mining, oil and gas, shipping, and elevators. It relies on raw materials such as high-carbon steel, machinery for stranding and closing ropes, and quality control systems to ensure durability and safety. The ecosystem is also supported by maintenance services, testing laboratories, and standards organizations that regulate performance and safety requirements.

Logos and trademarks shown above are the property of their respective owners. Their use here is for informational and illustrative purposes only.

STEEL WIRE ROPE MARKET SEGMENTS

Source: Secondary Research, Interviews with Experts, MarketsandMarkets Analysis

Steel Wire Rope Market, by Lay Type

Regular lay type led the steel wire rope market because it offers very good structural stability due to the opposing stranding of wires and strands, making it more resistant to external twist and easier to evaluate for wire breaks. Its design results in lower rope torque compared to lang lay ropes, making it widely applicable, especially in construction, mining, and other heavy-duty industries. Regular lay ropes are more cost-effective and commonly used unless there's a specific design need for lang lay ropes, contributing to their dominance in global infrastructure projects. This broad applicability and balance of durability and performance have established regular lay ropes as the market leader.

Steel Wire Rope Market, by Material Type

The carbon steel segment dominated the steel wire rope market due to its high tensile strength, cost-effectiveness, and excellent wear resistance, making it suitable for heavy-duty applications. Its durability and fatigue resistance allow steel wire ropes made from carbon steel to withstand high pressure, load, and frequent stress cycles, extending service life and ensuring safety. The carbon steel's availability and adaptability in construction, industrial, and infrastructure sectors reinforce its widespread use, especially when combined with coatings like galvanization to enhance corrosion resistance.

Steel Wire Rope Market, by Coating

The non-plastic-coated steel wire ropes holds the largest share in the steel wire rope market because they offer cost efficiency and strong mechanical properties suitable for heavy-duty industrial and infrastructural applications. Their zinc (galvanized) coating provides effective corrosion resistance, making them highly durable in harsh environments such as marine, construction, and mining sectors. The uncoated ropes avoid the higher costs and temperature limitations associated with plastic-coated ropes, which can be a critical factor in price-sensitive projects. These characteristics make non-plastic-coated steel wire ropes the preferred choice for long-term, rugged use where performance and budget considerations are important.

Steel Wire Rope Market, by Diameter

The > 1/4 inch diameter holds the largest share in the steel wire rope market due to its superior strength and durability, which are essential for heavy-duty applications in construction, mining, oil & gas, and industrial machinery sectors. These ropes can endure higher tensile loads, mechanical stress, and abrasion, making them ideal for lifting, hauling, and rigging in large-scale infrastructure and industrial projects. The growing infrastructure development and industrialization, especially in regions like Asia Pacific, drive demand for larger diameter wire ropes that offer enhanced safety and longevity under tough environmental conditions.

Steel Wire Rope Market, by Application

The construction application led the steel wire rope market because steel wire ropes are essential for critical construction activities like lifting heavy materials, suspending scaffolding, supporting cranes, and building bridges. Their high tensile strength, corrosion resistance, and durability make them ideal for demanding structural and lifting functions in residential, commercial, and infrastructure projects. The global growth in urbanization, infrastructure investments, and industrial construction further drives the strong demand for steel wire ropes in construction. The growing government-led initiatives and the need for reliable lifting systems in projects such as high-rise buildings and bridges contribute significantly to the demand for these ropes.

REGION

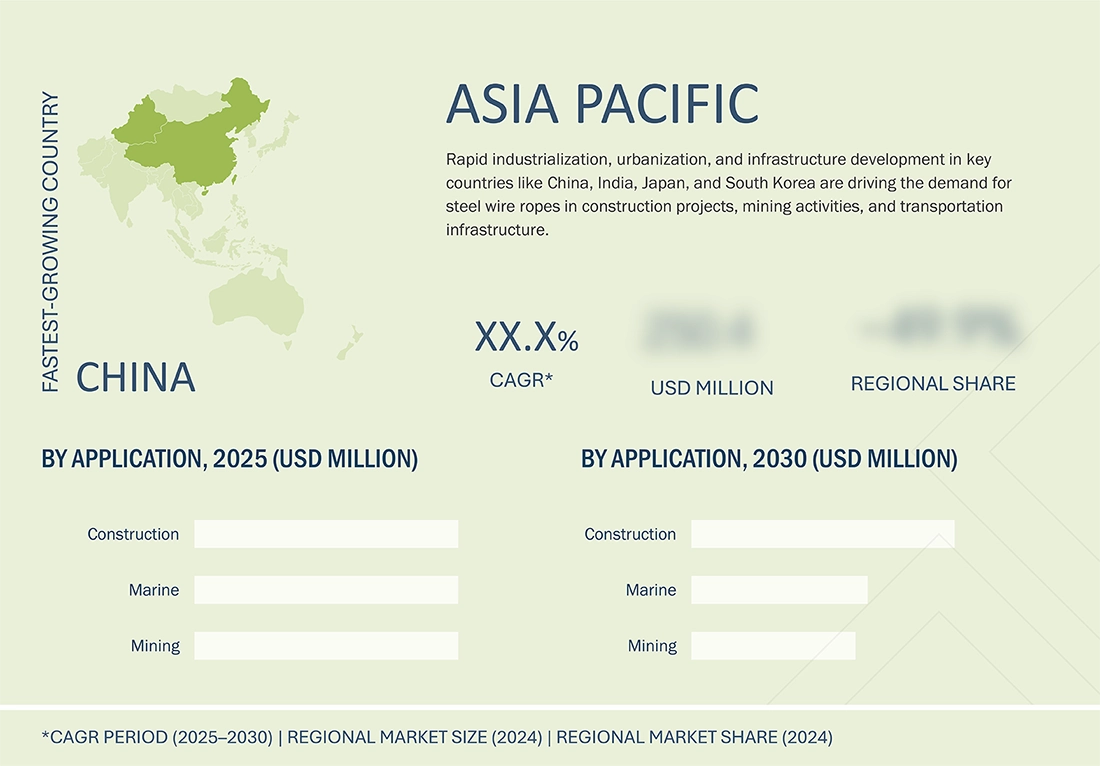
Asia Pacific to be fastest-growing market for steel wire rope during forecast period

Asia Pacific is projected to be the fastest-growing market for steel wire rope during the forecast period due to rapid industrialization, extensive infrastructure development, and increasing investments in construction and mining sectors across countries like China, India, Japan, and South Korea. The region's urbanization and large-scale government-backed projects, including smart cities and port infrastructure, fuel strong demand for steel wire ropes. Additionally, Asia Pacific's dominance in steel production ensures a steady supply of raw materials, supporting cost-effective manufacturing and market growth. The push for advanced, corrosion-resistant, and high-strength wire rope solutions in heavy-duty applications also drives the market expansion in this region.

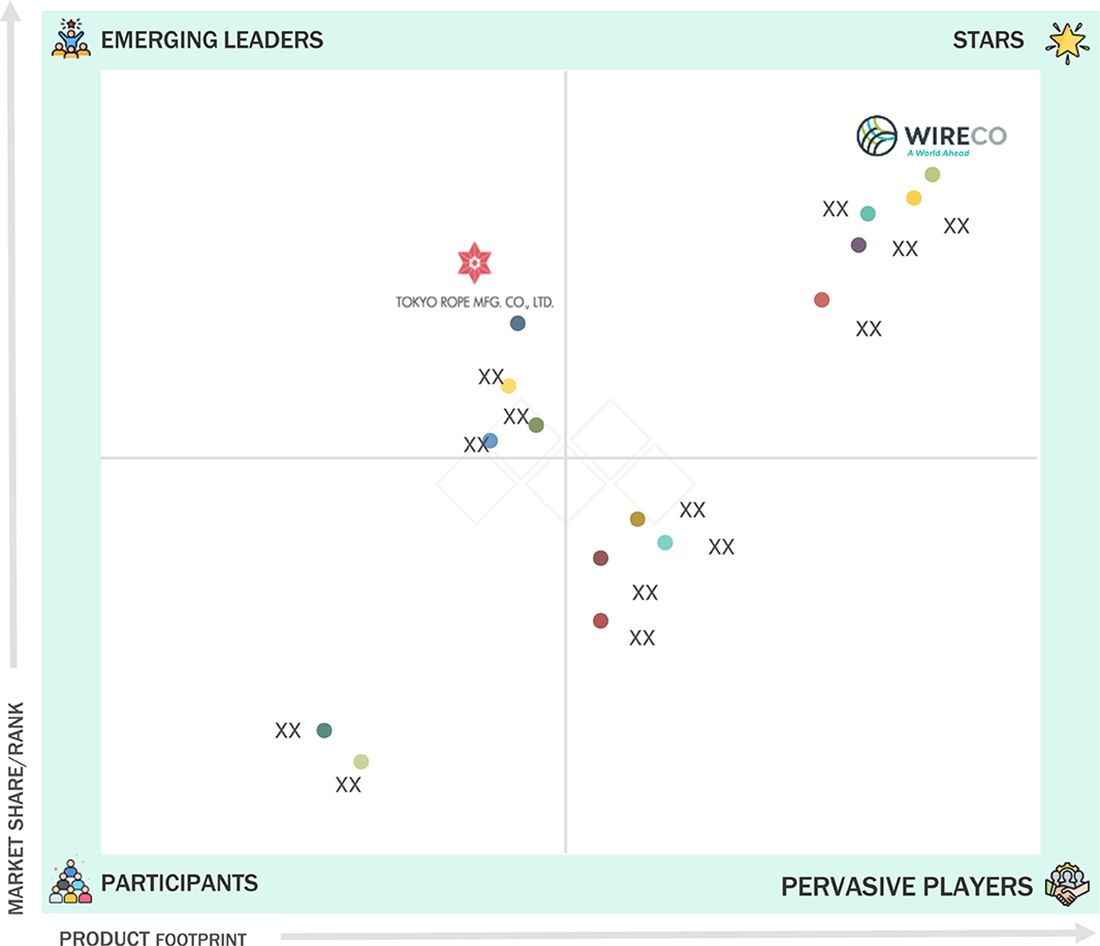
Steel Wire Rope Market: COMPANY EVALUATION MATRIX

In the steel wire rope market, WireCo (Star) leads with a strong global presence, a broad product portfolio, and a robust distribution network across mining, oil & gas, and construction sectors. Tokyo Rope Mfg. Co., Ltd. (Emerging Leader) is gaining prominence through technological innovation and sustainable manufacturing, showing rising potential to join the leaders’ quadrant as demand grows for precision and eco-efficient steel wire ropes.

Source: Secondary Research, Interviews with Experts, MarketsandMarkets Analysis

MARKET SCOPE

REPORT METRIC DETAILS
Market Size, 2024 (Value) USD 9.88 Billion
Market Forecast, 2030 (Value) USD 13.88 Billion
Growth Rate CAGR of 5.8% from 2025 to 2030
Years Considered 2023–2030
Base Year 2024
Forecast Period 2025–2030
Units Considered Value (USD Million/Billion), Volume (Kiloton)
Report Coverage Revenue Forecast, Company Ranking, Competitive Landscape, Growth Factors, and Trends
Segments Covered
  • By Lay Type:
    • Regular Lay
    • Lang Lay
  • By Material Type:
    • Carbon Steel
    • Galvanized Steel
    • Stainless Steel
    • Other Material Types
  • By Coating:
    • Non-plastic-coated
    • Plastic-coated
  • By Diameter:
    • ≤1/4 Inch
    • >1/4 Inch
  • By Application:
    • Construction
    • Mining
    • Marine & Fishing
    • Industrial & Crane
    • Oil & Gas
    • Other Applications
Regions Covered North America, Asia Pacific, Europe, Latin America, Middle East & Africa

WHAT IS IN IT FOR YOU: Steel Wire Rope Market REPORT CONTENT GUIDE

DELIVERED CUSTOMIZATIONS

We have successfully delivered the following deep-dive customizations:

CLIENT REQUEST CUSTOMIZATION DELIVERED VALUE ADDS
Raw Material Suppliers
  • Competitive profiling of high-carbon steel, stainless steel, and specialty alloy suppliers (capacity, certifications, wire-drawing capabilities)
  • Benchmarking raw material pricing trends (carbon steel, alloy steel, galvanized coatings)
  • Mapping global supply chains for wire rods and lubricants used in rope manufacturing
  • Analysis of trade flows and tariff impacts
  • Identify reliable suppliers and minimize raw material cost fluctuations
  • Detect steel rod and coating supply gaps
  • Support procurement and long-term supply agreements
Steel Wire Rope Manufacturers
  • Analysis of manufacturing technologies (stranding machines, closing machines, compacted rope tech, plastic-filled ropes)
  • Cost-performance benchmarking of galvanized vs ungalvanized, stainless vs carbon steel ropes
  • Mapping partnerships with OEMs (crane makers, construction, mining firms)
  • R&D tracking for advanced coatings, anti-rotation designs, plastic-impregnated and synthetic hybrid ropes
  • Optimize product mix and positioning in high-growth segments (construction, ports, mining)
  • Improve yield and reduce wastage in rope-drawing and closing process
  • Identify growth in specialty segments like high-tensile, anti-corrosion ropes for offshore & marine
OEMs & Equipment Manufacturers
  • Assessment of technical and lifecycle benefits of advanced steel wire ropes (rotation-resistant, high-tensile, compacted, plastic-coated)
  • Forecast demand for wire ropes across sectors till 2030
  • Technology benchmarking vs synthetic ropes and high-performance fiber ropes
  • Price & margin benchmarking for OEM-supplied vs aftermarket ropes
  • Strengthen market share in lifting, mining, and offshore applications
  • Identify long-term opportunities in high-strength, fatigue-resistant ropes
  • Optimize aftermarket and service-based revenue streams
End Users
  • Adoption benchmarking of steel wire ropes across applications
  • Switching cost analysis vs synthetic fiber ropes, chains, or hydraulic lifts
  • Failure rate and safety risk assessment
  • Substitution risk and lifecycle cost models (steel vs synthetic, galvanized vs stainless)
  • Reveal end-user demand trends and safety compliance needs
  • Support lightweighting and corrosion-resistant initiatives
  • Enable targeting of growth segments like offshore wind, deep-sea mining, high-rise elevators

RECENT DEVELOPMENTS

  • May 2025 : WireCo launched Boomfit, a plastic-coated steel wire rope, utilizing CASAR’s renowned Plast rope technology. It was specifically designed for use as an adjustment rope in telescopic cranes, crawler cranes, and large tower cranes.
  • May 2025 : Usha Martin’s UK arm, Brunton Shaw Ltd, manufactured and delivered a 102 mm, 3,300 m long OCEANMAX35 steel wire rope weighing 187 tons for a 250-tone crane on a construction vessel. The rope and socket were supplied with third-party certifications, showcasing the company’s advanced manufacturing capability and strong position in the global offshore and heavy-crane rope market.
  • February 2025 : Bekaert announced that it reached an agreement on the sale of its Steel Wire Solutions businesses in Costa Rica, Ecuador, and Venezuela to Grupo AG. This transaction valued the underlying entities at a consolidated enterprise value of approximately USD 73 million and is expected to result in net proceeds for Bekaert of approximately USD 37 million.


Table of Contents

Exclusive indicates content/data unique to MarketsandMarkets and not available with any competitors.

TITLE
PAGE NO
1
INTRODUCTION


24
2
RESEARCH METHODOLOGY


29
3
EXECUTIVE SUMMARY


38
4
PREMIUM INSIGHTS


43
5
MARKET OVERVIEW
Rising construction demand and smart rope tech fuel growth amid intense competition and price volatility.


48
 
5.1
INTRODUCTION


5.2
MARKET DYNAMICS


5.2.1
DRIVERS


5.2.1.1
RISING DEMAND FROM CONSTRUCTION AND INFRASTRUCTURE DEVELOPMENT


5.2.1.2
EXPANSION OF MINING OPERATIONS AND INDUSTRIAL ACTIVITIES


5.2.2
RESTRAINTS


5.2.2.1
FLUCTUATING RAW MATERIAL PRICES


5.2.2.2
HIGH COMPETITION FROM SYNTHETIC ROPES


5.2.3
OPPORTUNITIES


5.2.3.1
GROWING EXPANSION IN RENEWABLE ENERGY & MARINE APPLICATIONS


5.2.3.2
INTEGRATING AUTOMATION WITH SMART ROPE TECHNOLOGIES


5.2.4
CHALLENGES


5.2.4.1
INTENSE MARKET COMPETITION


5.2.4.2
FATIGUE & BREAKAGE RISK
 
 
5.3
PORTER’S FIVE FORCES ANALYSIS


5.3.1
THREAT OF NEW ENTRANTS


5.3.2
THREAT OF SUBSTITUTES


5.3.3
BARGAINING POWER OF SUPPLIERS


5.3.4
BARGAINING POWER OF BUYERS


5.3.5
INTENSITY OF COMPETITIVE RIVALRY


5.4
KEY STAKEHOLDERS AND BUYING CRITERIA


5.4.1
KEY STAKEHOLDERS IN BUYING PROCESS


5.4.2
BUYING CRITERIA


5.5
PRICING ANALYSIS


5.5.1
AVERAGE SELLING PRICE TREND AMONG KEY PLAYERS, BY APPLICATION


5.5.2
AVERAGE SELLING PRICE TREND, BY REGION


5.6
MACROECONOMIC OUTLOOK


5.6.1
INTRODUCTION


5.6.2
GDP TRENDS AND FORECAST


5.6.3
TRENDS IN GLOBAL STEEL WIRE ROPE INDUSTRY


5.7
SUPPLY CHAIN ANALYSIS


5.8
ECOSYSTEM ANALYSIS


5.9
TRADE ANALYSIS


5.9.1
EXPORT SCENARIO (HS CODE 731210)


5.9.2
IMPORT SCENARIO (HS CODE 731210)


5.10
TECHNOLOGY ANALYSIS


5.10.1
KEY TECHNOLOGIES


5.10.1.1
WIRE DRAWING AND STRANDING


5.10.1.2
SPECIALIZED COATING AND SURFACE TREATMENTS


5.10.1.3
ROPE CLOSING


5.10.2
COMPLEMENTARY TECHNOLOGIES


5.10.2.1
X-RAY AND ULTRASONIC NON-DESTRUCTIVE TESTING
 
 
5.11
PATENT ANALYSIS


5.11.1
INTRODUCTION


5.11.2
METHODOLOGY


5.11.3
DOCUMENT TYPES


5.11.4
INSIGHTS


5.11.5
LEGAL STATUS


5.11.6
JURISDICTION ANALYSIS


5.11.7
TOP APPLICANT ANALYSIS


5.11.8
TOP US PATENT OWNERS, 2015–2024


5.12
REGULATORY LANDSCAPE


5.12.1
REGULATORY BODIES, GOVERNMENT AGENCIES, AND OTHER ORGANIZATIONS


5.13
KEY CONFERENCES AND EVENTS


5.14
CASE STUDY ANALYSIS


5.14.1
INNOVATIVE STEEL WIRE ROPE SOLUTION FOR GALWAY’S PEDESTRIAN AND CYCLE SAFETY


5.14.2
SHADEMAKERS’ PARTNERSHIP WITH SWR DELIVERS PREMIUM STEEL WIRE ROPE FOR YACHTS


5.14.3
STREAMLINING WAKEBOARD LIFT OPERATIONS WITH HIGH-PERFORMANCE STEEL WIRE ROPES


5.15
TRENDS AND DISRUPTIONS IMPACTING CUSTOMER BUSINESS


5.16
IMPACT OF AI/GEN AI


5.17
INVESTMENT AND FUNDING SCENARIO


5.18
IMPACT OF 2025 US TARIFF ON STEEL WIRE ROPE MARKET


5.18.1
INTRODUCTION


5.18.2
KEY TARIFF RATES


5.18.3
PRICE IMPACT ANALYSIS


5.18.4
KEY IMPACT ON MAJOR COUNTRIES/REGIONS


5.18.4.1
US


5.18.4.2
EUROPE


5.18.4.3
ASIA PACIFIC


5.18.5
IMPACT ON END USERS
 
 
6
STEEL WIRE ROPE MARKET, BY LAY TYPE
Market Size & Growth Rate Forecast Analysis to 2030 in USD Million and Kilotons | 6 Data Tables


86
 
6.1
INTRODUCTION


6.2
REGULAR LAY


6.2.1
GROWING USE IN CONSTRUCTION, HOISTING, AND GENERAL LIFTING APPLICATIONS


6.3
LANG LAY


6.3.1
RISING ADOPTION IN DYNAMIC AND HEAVY-DUTY INDUSTRIAL APPLICATIONS
 
 
7
STEEL WIRE ROPE MARKET, BY DIAMETER
Market Size & Growth Rate Forecast Analysis to 2030 in USD Million and Kilotons | 6 Data Tables


91
 
7.1
INTRODUCTION


7.2
≤1/4 INCH


7.2.1
RISING DEMAND FOR FLEXIBLE AND LIGHTWEIGHT ROPES


7.3
>1/4 INCH


7.3.1
EXPANDING HEAVY-DUTY APPLICATIONS ACROSS CORE INDUSTRIES
 
 
8
STEEL WIRE ROPE MARKET, BY COATING TYPE
Market Size & Growth Rate Forecast Analysis to 2030 in USD Million and Kilotons | 6 Data Tables


95
 
8.1
INTRODUCTION


8.2
PLASTIC-COATED


8.2.1
RISING DEMAND FOR ENHANCED DURABILITY AND CORROSION RESISTANCE


8.3
NON-PLASTIC COATED


8.3.1
EXPANDING USE IN HEAVY-DUTY INDUSTRIAL AND CONSTRUCTION APPLICATIONS
 
 
9
STEEL WIRE ROPE MARKET, BY APPLICATION
Market Size & Growth Rate Forecast Analysis to 2030 in USD Million and Kilotons | 14 Data Tables


100
 
9.1
INTRODUCTION


9.2
CONSTRUCTION


9.2.1
RISING ADOPTION OF ADVANCED CONSTRUCTION EQUIPMENT AND SAFETY STANDARDS


9.3
MINING


9.3.1
INCREASING DEPTH AND SCALE OF MINING OPERATIONS


9.4
MARINE & FISHING


9.4.1
GROWING MODERNIZATION OF PORT INFRASTRUCTURE AND FISHING FLEETS


9.5
INDUSTRIAL & CRANE


9.5.1
RISING INDUSTRIAL AUTOMATION AND MATERIAL HANDLING DEMAND


9.6
OIL & GAS


9.6.1
INCREASING GLOBAL ENERGY DEMAND AND OFFSHORE PRODUCTION EXPANSION


9.7
OTHER APPLICATIONS


10
STEEL WIRE ROPE MARKET, BY MATERIAL TYPE
Market Size & Growth Rate Forecast Analysis to 2030 in USD Million and Kilotons | 10 Data Tables


109
 
10.1
INTRODUCTION


10.2
CARBON STEEL


10.2.1
HIGH STRENGTH AND COST-EFFECTIVENESS FOR HEAVY-DUTY APPLICATIONS


10.3
GALVANIZED STEEL


10.3.1
GROWING DEMAND FOR CORROSION-RESISTANT SOLUTIONS IN OUTDOOR APPLICATIONS


10.4
STAINLESS STEEL


10.4.1
EXPANDING USE IN HEAVY-DUTY INDUSTRIAL AND CONSTRUCTION APPLICATIONS


10.5
OTHER MATERIAL TYPES


11
STEEL WIRE ROPE MARKET, BY REGION
Comprehensive coverage of 8 Regions with country-level deep-dive of 16 Countries | 104 Data Tables.


116
 
11.1
INTRODUCTION


11.2
NORTH AMERICA


11.2.1
NORTH AMERICA: STEEL WIRE ROPE MARKET, BY COATING TYPE


11.2.2
NORTH AMERICA: STEEL WIRE ROPE MARKET, BY LAY TYPE


11.2.3
NORTH AMERICA: STEEL WIRE ROPE MARKET, BY DIAMETER


11.2.4
NORTH AMERICA: STEEL WIRE ROPE MARKET, BY MATERIAL TYPE


11.2.5
NORTH AMERICA: STEEL WIRE ROPE MARKET, BY APPLICATION


11.2.6
NORTH AMERICA: STEEL WIRE ROPE MARKET, BY COUNTRY


11.2.6.1
US


11.2.6.2
CANADA
 
 
11.3
ASIA PACIFIC


11.3.1
ASIA PACIFIC: STEEL WIRE ROPE MARKET, BY COATING TYPE


11.3.2
ASIA PACIFIC: STEEL WIRE ROPE MARKET, BY LAY TYPE


11.3.3
ASIA PACIFIC: STEEL WIRE ROPE MARKET, BY DIAMETER


11.3.4
ASIA PACIFIC: STEEL WIRE ROPE MARKET, BY MATERIAL TYPE


11.3.5
ASIA PACIFIC: STEEL WIRE ROPE MARKET, BY APPLICATION


11.3.6
ASIA PACIFIC: STEEL WIRE ROPE MARKET, BY COUNTRY


11.3.6.1
CHINA


11.3.6.2
SOUTH KOREA


11.3.6.3
INDIA


11.3.6.4
JAPAN


11.3.6.5
REST OF ASIA PACIFIC
 
 
11.4
EUROPE


11.4.1
EUROPE: STEEL WIRE ROPE MARKET, BY COATING TYPE


11.4.2
EUROPE: STEEL WIRE ROPE MARKET, BY LAY TYPE


11.4.3
EUROPE: STEEL WIRE ROPE MARKET, BY DIAMETER


11.4.4
EUROPE: STEEL WIRE ROPE MARKET, BY MATERIAL TYPE


11.4.5
EUROPE: STEEL WIRE ROPE MARKET, BY APPLICATION


11.4.6
EUROPE: STEEL WIRE ROPE MARKET, BY COUNTRY


11.4.6.1
GERMANY


11.4.6.2
FRANCE


11.4.6.3
UK


11.4.6.4
ITALY


11.4.6.5
SPAIN


11.4.6.6
REST OF EUROPE
 
 
11.5
LATIN AMERICA


11.5.1
LATIN AMERICA: STEEL WIRE ROPE MARKET, BY COATING TYPE


11.5.2
LATIN AMERICA: STEEL WIRE ROPE MARKET, BY LAY TYPE


11.5.3
LATIN AMERICA: STEEL WIRE ROPE MARKET, BY DIAMETER


11.5.4
LATIN AMERICA: STEEL WIRE ROPE MARKET, BY MATERIAL TYPE


11.5.5
LATIN AMERICA: STEEL WIRE ROPE MARKET, BY APPLICATION


11.5.6
LATIN AMERICA: STEEL WIRE ROPE MARKET, BY COUNTRY


11.5.6.1
MEXICO


11.5.6.2
BRAZIL


11.5.6.3
REST OF LATIN AMERICA
 
 
11.6
MIDDLE EAST & AFRICA


11.6.1
MIDDLE EAST & AFRICA: STEEL WIRE ROPE MARKET, BY COATING TYPE


11.6.2
MIDDLE EAST & AFRICA: STEEL WIRE ROPE MARKET, BY LAY TYPE


11.6.3
MIDDLE EAST & AFRICA: STEEL WIRE ROPE MARKET, BY DIAMETER


11.6.4
MIDDLE EAST & AFRICA: STEEL WIRE ROPE MARKET, BY MATERIAL TYPE


11.6.5
MIDDLE EAST & AFRICA: STEEL WIRE ROPE MARKET, BY APPLICATION


11.6.6
MIDDLE EAST & AFRICA: STEEL WIRE ROPE MARKET, BY COUNTRY


11.6.6.1
GCC COUNTRIES


11.6.6.2
SOUTH AFRICA


11.6.6.3
REST OF MIDDLE EAST & AFRICA
 
12
COMPETITIVE LANDSCAPE
Uncover strategic moves and market dominance of key players and emerging leaders in the industry.


164
 
12.1
INTRODUCTION


12.2
KEY PLAYERS’ STRATEGIES/RIGHT TO WIN, 2020–2025


12.3
REVENUE ANALYSIS, 2020–2024


12.4
MARKET SHARE ANALYSIS, 2024


12.5
BRAND/PRODUCT COMPARISON


12.6
COMPANY EVALUATION MATRIX: KEY PLAYERS, 2024


12.6.1
STARS


12.6.2
EMERGING LEADERS


12.6.3
PERVASIVE PLAYERS


12.6.4
PARTICIPANTS


12.6.5
COMPANY FOOTPRINT


12.6.5.1
COMPANY FOOTPRINT


12.6.5.2
REGION FOOTPRINT


12.6.5.3
LAY TYPE FOOTPRINT


12.6.5.4
MATERIAL TYPE FOOTPRINT


12.6.5.5
COATING TYPE FOOTPRINT


12.6.5.6
DIAMETER FOOTPRINT


12.6.5.7
APPLICATION FOOTPRINT
 
 
12.7
COMPANY EVALUATION MATRIX: START-UPS/SMES, 2024


12.7.1
PROGRESSIVE COMPANIES


12.7.2
RESPONSIVE COMPANIES


12.7.3
DYNAMIC COMPANIES


12.7.4
STARTING BLOCKS


12.7.5
COMPETITIVE BENCHMARKING


12.7.5.1
DETAILED LIST OF KEY START-UPS/SMES


12.7.5.2
COMPETITIVE BENCHMARKING OF KEY START-UPS/SMES
 
 
12.8
COMPANY VALUATION AND FINANCIAL METRICS


12.9
COMPETITIVE SCENARIO


12.9.1
DEALS


12.9.2
PRODUCT LAUNCHES


12.9.3
EXPANSIONS
 
 
13
COMPANY PROFILES
In-depth Company Profiles of Leading Market Players with detailed Business Overview, Product and Service Portfolio, Recent Developments, and Unique Analyst Perspective (MnM View)


185
 
13.1
KEY PLAYERS


13.1.1
BEKAERT


13.1.1.1
BUSINESS OVERVIEW


13.1.1.2
PRODUCTS/SOLUTIONS/SERVICES OFFERED


13.1.1.3
RECENT DEVELOPMENTS


13.1.1.4
MNM VIEW


13.1.2
WIRECO


13.1.3
KISWIRE LTD.


13.1.4
USHA MARTIN LIMITED


13.1.5
TEUFELBERGER


13.1.6
LOOS & CO. INC.


13.1.7
PFEIFER GROUP


13.1.8
TOKYO ROPE MFG. CO., LTD.


13.1.9
JIANGSU LANGSHAN WIRE ROPE CO., LTD.


13.1.10
BILCO GROUP


13.1.11
SWR LTD.


13.1.12
LEXCO CABLE


13.1.13
JIANGYIN JIAHUA ROPES CO., LTD.


13.1.14
NANTONG SHENWEI STEEL WIRE ROPE CO., LTD.


13.1.15
BHARAT WIRE ROPES LTD.


13.2
OTHER PLAYERS


13.2.1
HANGZHOU ZHEZHONG CHAIN CO., LTD.


13.2.2
TYLER MADISON, INC.


13.2.3
ORION ROPES PRIVATE LIMITED


13.2.4
ASAHI ROPES


13.2.5
DAVANGERE WIRE ROPE INDUSTRY PVT. LTD


13.2.6
SHREE STEEL WIRE ROPES LTD.


13.2.7
J D WIRE ROPES


13.2.8
SURASHA WIREROPES


13.2.9
JIANGYIN TUOXIN STEEL ROPE CO., LTD.


13.2.10
SHREE VARDHAMAN WIRE ROPES
 
 
14
APPENDIX


254
 
14.1
DISCUSSION GUIDE


14.2
KNOWLEDGESTORE: MARKETSANDMARKETS’ SUBSCRIPTION PORTAL


14.3
CUSTOMIZATION OPTIONS


14.4
RELATED REPORTS


14.5
AUTHOR DETAILS


LIST OF TABLES


TABLE 1
STEEL WIRE ROPE MARKET: PORTER’S FIVE FORCES ANALYSIS


TABLE 2
INFLUENCE OF STAKEHOLDERS ON BUYING PROCESS FOR TOP THREE APPLICATIONS


TABLE 3
KEY BUYING CRITERIA FOR TOP THREE APPLICATIONS


TABLE 4
AVERAGE SELLING PRICE TREND OF KEY PLAYERS IN STEEL WIRE ROPE MARKET, BY APPLICATION, 2024 (USD/KG)


TABLE 5
AVERAGE SELLING PRICE TREND OF STEEL WIRE ROPE, BY REGION, 2023–2024 (USD/KG)


TABLE 6
GDP PERCENTAGE CHANGE, BY COUNTRY, 2021–2029 (%)


TABLE 7
ROLE OF COMPANIES IN STEEL WIRE ROPE ECOSYSTEM


TABLE 8
TOP 10 EXPORTING COUNTRIES OF STEEL WIRE ROPES, 2020–2024 (USD THOUSAND)


TABLE 9
TOP 10 IMPORTING COUNTRIES OF STEEL WIRE ROPES, 2020–2024 (USD THOUSAND)


TABLE 10
TOTAL NUMBER OF PATENTS, 2015–2024


TABLE 11
PATENTS BY UNIV CHINA MINING, 2021–2024


TABLE 12
PATENTS BY JIANGSU SAFETY STEEL WIRE ROPE, 2023


TABLE 13
NORTH AMERICA: REGULATORY BODIES, GOVERNMENT AGENCIES, AND OTHER ORGANIZATIONS


TABLE 14
EUROPE: REGULATORY BODIES, GOVERNMENT AGENCIES, AND OTHER ORGANIZATIONS


TABLE 15
ASIA PACIFIC: REGULATORY BODIES, GOVERNMENT AGENCIES, AND OTHER ORGANIZATIONS


TABLE 16
REST OF THE WORLD: REGULATORY BODIES, GOVERNMENT AGENCIES, AND OTHER ORGANIZATIONS


TABLE 17
KEY CONFERENCES AND EVENTS, 2025–2026


TABLE 18
TOP USE CASES AND MARKET POTENTIAL


TABLE 19
AI IMPLEMENTATION IN STEEL WIRE ROPE MARKET


TABLE 20
US ADJUSTED RECIPROCAL TARIFF RATES


TABLE 21
KEY PRODUCT-RELATED TARIFF EFFECTIVE FOR STEEL WIRE ROPE, 2024 VS. 2025


TABLE 22
EXPECTED CHANGE IN PRICES AND LIKELY IMPACT ON END-USE MARKETS DUE TO TARIFF IMPACT


TABLE 23
STEEL WIRE ROPE MARKET, BY LAY TYPE, 2023–2030 (USD MILLION)


TABLE 24
STEEL WIRE ROPE MARKET, BY LAY TYPE, 2023–2030 (KILOTON)


TABLE 25
REGULAR LAY: STEEL WIRE ROPE MARKET, BY REGION, 2023–2030 (USD MILLION)


TABLE 26
REGULAR LAY: STEEL WIRE ROPE MARKET, BY REGION, 2023–2030 (KILOTON)


TABLE 27
LANG LAY: STEEL WIRE ROPE MARKET, BY REGION, 2023–2030 (USD MILLION)


TABLE 28
LANG LAY: STEEL WIRE ROPE MARKET, BY REGION, 2023–2030 (KILOTON)


TABLE 29
STEEL WIRE ROPE MARKET, BY DIAMETER, 2023–2030 (USD MILLION)


TABLE 30
STEEL WIRE ROPE MARKET, BY DIAMETER, 2023–2030 (KILOTON)


TABLE 31
≤1/4 INCH: STEEL WIRE ROPE MARKET, BY REGION, 2023–2030 (USD MILLION)


TABLE 32
≤1/4 INCH: STEEL WIRE ROPE MARKET, BY REGION, 2023–2030 (KILOTON)


TABLE 33
>1/4 INCH: STEEL WIRE ROPE MARKET, BY REGION, 2023–2030 (USD MILLION)


TABLE 34
>1/4 INCH: STEEL WIRE ROPE MARKET, BY REGION, 2023–2030 (KILOTON)


TABLE 35
STEEL WIRE ROPE MARKET, BY COATING TYPE, 2023–2030 (USD MILLION)


TABLE 36
STEEL WIRE ROPE MARKET, BY COATING TYPE, 2023–2030 (KILOTON)


TABLE 37
PLASTIC-COATED: STEEL WIRE ROPE MARKET, BY REGION, 2023–2030 (USD MILLION)


TABLE 38
PLASTIC-COATED: STEEL WIRE ROPE MARKET, BY REGION, 2023–2030 (KILOTON)


TABLE 39
NON-PLASTIC COATED: STEEL WIRE ROPE MARKET, BY REGION, 2023–2030 (USD MILLION)


TABLE 40
NON-PLASTIC COATED: STEEL WIRE ROPE MARKET, BY REGION, 2023–2030 (KILOTON)


TABLE 41
STEEL WIRE ROPE MARKET, BY APPLICATION, 2023–2030 (USD MILLION)


TABLE 42
STEEL WIRE ROPE MARKET, BY APPLICATION, 2023–2030 (KILOTON)


TABLE 43
CONSTRUCTION: STEEL WIRE ROPE MARKET, BY REGION, 2023–2030 (USD MILLION)


TABLE 44
CONSTRUCTION: STEEL WIRE ROPE MARKET, BY REGION, 2023–2030 (KILOTON)


TABLE 45
MINING: STEEL WIRE ROPE MARKET, BY REGION, 2023–2030 (USD MILLION)


TABLE 46
MINING: STEEL WIRE ROPE MARKET, BY REGION, 2023–2030 (KILOTON)


TABLE 47
MARINE & FISHING: STEEL WIRE ROPE MARKET, BY REGION, 2023–2030 (USD MILLION)


TABLE 48
MARINE & FISHING: STEEL WIRE ROPE MARKET, BY REGION, 2023–2030 (KILOTON)


TABLE 49
INDUSTRIAL & CRANE: STEEL WIRE ROPE MARKET, BY REGION, 2023–2030 (USD MILLION)


TABLE 50
INDUSTRIAL & CRANE: STEEL WIRE ROPE MARKET, BY REGION, 2023–2030 (KILOTON)


TABLE 51
OIL & GAS: STEEL WIRE ROPE MARKET, BY REGION, 2023–2030 (USD MILLION)


TABLE 52
OIL & GAS: STEEL WIRE ROPE MARKET, BY REGION, 2023–2030 (KILOTON)


TABLE 53
OTHER APPLICATIONS: STEEL WIRE ROPE MARKET, BY REGION, 2023–2030 (USD MILLION)


TABLE 54
OTHER APPLICATIONS: STEEL WIRE ROPE MARKET, BY REGION, 2023–2030 (KILOTON)


TABLE 55
STEEL WIRE ROPE MARKET, BY MATERIAL TYPE, 2023–2030 (USD MILLION)


TABLE 56
STEEL WIRE ROPE MARKET, BY MATERIAL TYPE, 2023–2030 (KILOTON)


TABLE 57
CARBON STEEL: STEEL WIRE ROPE MARKET, BY REGION, 2023–2030 (USD MILLION)


TABLE 58
CARBON STEEL: STEEL WIRE ROPE MARKET, BY REGION, 2023–2030 (KILOTON)


TABLE 59
GALVANIZED STEEL: STEEL WIRE ROPE MARKET, BY REGION, 2023–2030 (USD MILLION)


TABLE 60
GALVANIZED STEEL: STEEL WIRE ROPE MARKET, BY REGION, 2023–2030 (KILOTON)


TABLE 61
STAINLESS STEEL: STEEL WIRE ROPE MARKET, BY REGION, 2023–2030 (USD MILLION)


TABLE 62
STAINLESS STEEL: STEEL WIRE ROPE MARKET, BY REGION, 2023–2030 (KILOTON)


TABLE 63
OTHER MATERIAL TYPES: STEEL WIRE ROPE MARKET, BY REGION, 2023–2030 (USD MILLION)


TABLE 64
OTHER MATERIAL TYPES: STEEL WIRE ROPE MARKET, BY REGION, 2023–2030 (KILOTON)


TABLE 65
STEEL WIRE ROPE MARKET, BY REGION, 2023–2030 (USD MILLION)


TABLE 66
STEEL WIRE ROPE MARKET, BY REGION, 2023–2030 (KILOTON)


TABLE 67
NORTH AMERICA: STEEL WIRE ROPE MARKET, BY COATING TYPE, 2023–2030 (USD MILLION)


TABLE 68
NORTH AMERICA: STEEL WIRE ROPE MARKET, BY COATING TYPE, 2023–2030 (KILOTON)


TABLE 69
NORTH AMERICA: STEEL WIRE ROPE MARKET, BY LAY TYPE, 2023–2030 (USD MILLION)


TABLE 70
NORTH AMERICA: STEEL WIRE ROPE MARKET, BY LAY TYPE, 2023–2030 (KILOTON)


TABLE 71
NORTH AMERICA: STEEL WIRE ROPE MARKET, BY DIAMETER, 2023–2030 (USD MILLION)


TABLE 72
NORTH AMERICA: STEEL WIRE ROPE MARKET, BY DIAMETER, 2023–2030 (KILOTON)


TABLE 73
NORTH AMERICA: STEEL WIRE ROPE MARKET, BY MATERIAL TYPE, 2023–2030 (USD MILLION)


TABLE 74
NORTH AMERICA: STEEL WIRE ROPE MARKET, BY MATERIAL TYPE, 2023–2030 (KILOTON)


TABLE 75
NORTH AMERICA: STEEL WIRE ROPE MARKET, BY APPLICATION, 2023–2030 (USD MILLION)


TABLE 76
NORTH AMERICA: STEEL WIRE ROPE MARKET, BY APPLICATION, 2023–2030 (KILOTON)


TABLE 77
NORTH AMERICA: STEEL WIRE ROPE MARKET, BY COUNTRY, 2023–2030 (USD MILLION)


TABLE 78
NORTH AMERICA: STEEL WIRE ROPE MARKET, BY COUNTRY, 2023–2030 (KILOTON)


TABLE 79
US: STEEL WIRE ROPE MARKET, BY APPLICATION, 2023–2030 (USD MILLION)


TABLE 80
US: STEEL WIRE ROPE MARKET, BY APPLICATION, 2023–2030 (KILOTON)


TABLE 81
CANADA: STEEL WIRE ROPE MARKET, BY APPLICATION, 2023–2030 (USD MILLION)


TABLE 82
CANADA: STEEL WIRE ROPE MARKET, BY APPLICATION, 2023–2030 (KILOTON)


TABLE 83
ASIA PACIFIC: STEEL WIRE ROPE MARKET, BY COATING TYPE, 2023–2030 (USD MILLION)


TABLE 84
ASIA PACIFIC: STEEL WIRE ROPE MARKET, BY COATING TYPE, 2023–2030 (KILOTON)


TABLE 85
ASIA PACIFIC: STEEL WIRE ROPE MARKET, BY LAY TYPE, 2023–2030 (USD MILLION)


TABLE 86
ASIA PACIFIC: STEEL WIRE ROPE MARKET, BY LAY TYPE, 2023–2030 (KILOTON)


TABLE 87
ASIA PACIFIC: STEEL WIRE ROPE MARKET, BY DIAMETER, 2023–2030 (USD MILLION)


TABLE 88
ASIA PACIFIC: STEEL WIRE ROPE MARKET, BY DIAMETER, 2023–2030 (KILOTON)


TABLE 89
ASIA PACIFIC: STEEL WIRE ROPE MARKET, BY MATERIAL TYPE, 2023–2030 (USD MILLION)


TABLE 90
ASIA PACIFIC: STEEL WIRE ROPE MARKET, BY MATERIAL TYPE, 2023–2030 (KILOTON)


TABLE 91
ASIA PACIFIC: STEEL WIRE ROPE MARKET, BY APPLICATION, 2023–2030 (USD MILLION)


TABLE 92
ASIA PACIFIC: STEEL WIRE ROPE MARKET, BY APPLICATION, 2023–2030 (KILOTON)


TABLE 93
ASIA PACIFIC: STEEL WIRE ROPE MARKET, BY COUNTRY, 2023–2030 (USD MILLION)


TABLE 94
ASIA PACIFIC: STEEL WIRE ROPE MARKET, BY COUNTRY, 2023–2030 (KILOTON)


TABLE 95
CHINA: STEEL WIRE ROPE MARKET, BY APPLICATION, 2023–2030 (USD MILLION)


TABLE 96
CHINA: STEEL WIRE ROPE MARKET, BY APPLICATION, 2023–2030 (KILOTON)


TABLE 97
SOUTH KOREA: STEEL WIRE ROPE MARKET, BY APPLICATION, 2023–2030 (USD MILLION)


TABLE 98
SOUTH KOREA: STEEL WIRE ROPE MARKET, BY APPLICATION, 2023–2030 (KILOTON)


TABLE 99
INDIA: STEEL WIRE ROPE MARKET, BY APPLICATION, 2023–2030 (USD MILLION)


TABLE 100
INDIA: STEEL WIRE ROPE MARKET, BY APPLICATION, 2023–2030 (KILOTON)


TABLE 101
JAPAN: STEEL WIRE ROPE MARKET, BY APPLICATION, 2023–2030 (USD MILLION)


TABLE 102
JAPAN: STEEL WIRE ROPE MARKET, BY APPLICATION, 2023–2030 (KILOTON)


TABLE 103
REST OF ASIA PACIFIC: STEEL WIRE ROPE MARKET, BY APPLICATION, 2023–2030 (USD MILLION)


TABLE 104
REST OF ASIA PACIFIC: STEEL WIRE ROPE MARKET, BY APPLICATION, 2023–2030 (KILOTON)


TABLE 105
EUROPE: STEEL WIRE ROPE MARKET, BY COATING TYPE, 2023–2030 (USD MILLION)


TABLE 106
EUROPE: STEEL WIRE ROPE MARKET, BY COATING TYPE, 2023–2030 (KILOTON)


TABLE 107
EUROPE: STEEL WIRE ROPE MARKET, BY LAY TYPE, 2023–2030 (USD MILLION)


TABLE 108
EUROPE: STEEL WIRE ROPE MARKET, BY LAY TYPE, 2023–2030 (KILOTON)


TABLE 109
EUROPE: STEEL WIRE ROPE MARKET, BY DIAMETER, 2023–2030 (USD MILLION)


TABLE 110
EUROPE: STEEL WIRE ROPE MARKET, BY DIAMETER, 2023–2030 (KILOTON)


TABLE 111
EUROPE: STEEL WIRE ROPE MARKET, BY MATERIAL TYPE, 2023–2030 (USD MILLION)


TABLE 112
EUROPE: STEEL WIRE ROPE MARKET, BY MATERIAL TYPE, 2023–2030 (KILOTON)


TABLE 113
EUROPE: STEEL WIRE ROPE MARKET, BY APPLICATION, 2023–2030 (USD MILLION)


TABLE 114
EUROPE: STEEL WIRE ROPE MARKET, BY APPLICATION, 2023–2030 (KILOTON)


TABLE 115
EUROPE: STEEL WIRE ROPE MARKET, BY COUNTRY, 2023–2030 (USD MILLION)


TABLE 116
EUROPE: STEEL WIRE ROPE MARKET, BY COUNTRY, 2023–2030 (KILOTON)


TABLE 117
GERMANY: STEEL WIRE ROPE MARKET, BY APPLICATION, 2023–2030 (USD MILLION)


TABLE 118
GERMANY: STEEL WIRE ROPE MARKET, BY APPLICATION, 2023–2030 (KILOTON)


TABLE 119
FRANCE: STEEL WIRE ROPE MARKET, BY APPLICATION, 2023–2030 (USD MILLION)


TABLE 120
FRANCE: STEEL WIRE ROPE MARKET, BY APPLICATION, 2023–2030 (KILOTON)


TABLE 121
UK: STEEL WIRE ROPE MARKET, BY APPLICATION, 2023–2030 (USD MILLION)


TABLE 122
UK: STEEL WIRE ROPE MARKET, BY APPLICATION, 2023–2030 (KILOTON)


TABLE 123
ITALY: STEEL WIRE ROPE MARKET, BY APPLICATION, 2023–2030 (USD MILLION)


TABLE 124
ITALY: STEEL WIRE ROPE MARKET, BY APPLICATION, 2023–2030 (KILOTON)


TABLE 125
SPAIN: STEEL WIRE ROPE MARKET, BY APPLICATION, 2023–2030 (USD MILLION)


TABLE 126
SPAIN: STEEL WIRE ROPE MARKET, BY APPLICATION, 2023–2030 (KILOTON)


TABLE 127
REST OF EUROPE: STEEL WIRE ROPE MARKET, BY APPLICATION, 2023–2030 (USD MILLION)


TABLE 128
REST OF EUROPE: STEEL WIRE ROPE MARKET, BY APPLICATION, 2023–2030 (KILOTON)


TABLE 129
LATIN AMERICA: STEEL WIRE ROPE MARKET, BY COATING TYPE, 2023–2030 (USD MILLION)


TABLE 130
LATIN AMERICA: STEEL WIRE ROPE MARKET, BY COATING TYPE, 2023–2030 (KILOTON)


TABLE 131
LATIN AMERICA: STEEL WIRE ROPE MARKET, BY LAY TYPE, 2023–2030 (USD MILLION)


TABLE 132
LATIN AMERICA: STEEL WIRE ROPE MARKET, BY LAY TYPE, 2023–2030 (KILOTON)


TABLE 133
LATIN AMERICA: STEEL WIRE ROPE MARKET, BY DIAMETER, 2023–2030 (USD MILLION)


TABLE 134
LATIN AMERICA: STEEL WIRE ROPE MARKET, BY DIAMETER, 2023–2030 (KILOTON)


TABLE 135
LATIN AMERICA: STEEL WIRE ROPE MARKET, BY MATERIAL TYPE, 2023–2030 (USD MILLION)


TABLE 136
LATIN AMERICA: STEEL WIRE ROPE MARKET, BY MATERIAL TYPE, 2023–2030 (KILOTON)


TABLE 137
LATIN AMERICA: STEEL WIRE ROPE MARKET, BY APPLICATION, 2023–2030 (USD MILLION)


TABLE 138
LATIN AMERICA: STEEL WIRE ROPE MARKET, BY APPLICATION, 2023–2030 (KILOTON)


TABLE 139
LATIN AMERICA: STEEL WIRE ROPE MARKET, BY COUNTRY, 2023–2030 (USD MILLION)


TABLE 140
LATIN AMERICA: STEEL WIRE ROPE MARKET, BY COUNTRY, 2023–2030 (KILOTON)


TABLE 141
MEXICO: STEEL WIRE ROPE MARKET, BY APPLICATION, 2023–2030 (USD MILLION)


TABLE 142
MEXICO: STEEL WIRE ROPE MARKET, BY APPLICATION, 2023–2030 (KILOTON)


TABLE 143
BRAZIL: STEEL WIRE ROPE MARKET, BY APPLICATION, 2023–2030 (USD MILLION)


TABLE 144
BRAZIL: STEEL WIRE ROPE MARKET, BY APPLICATION, 2023–2030 (KILOTON)


TABLE 145
REST OF LATIN AMERICA: STEEL WIRE ROPE MARKET, BY APPLICATION, 2023–2030 (USD MILLION)


TABLE 146
REST OF LATIN AMERICA: STEEL WIRE ROPE MARKET, BY APPLICATION, 2023–2030 (KILOTON)


TABLE 147
MIDDLE EAST & AFRICA: STEEL WIRE ROPE MARKET, BY COATING TYPE, 2023–2030 (USD MILLION)


TABLE 148
MIDDLE EAST & AFRICA: STEEL WIRE ROPE MARKET, BY COATING TYPE, 2023–2030 (KILOTON)


TABLE 149
MIDDLE EAST & AFRICA: STEEL WIRE ROPE MARKET, BY LAY TYPE, 2023–2030 (USD MILLION)


TABLE 150
MIDDLE EAST & AFRICA: STEEL WIRE ROPE MARKET, BY LAY TYPE, 2023–2030 (KILOTON)


TABLE 151
MIDDLE EAST & AFRICA: STEEL WIRE ROPE MARKET, BY DIAMETER, 2023–2030 (USD MILLION)


TABLE 152
MIDDLE EAST & AFRICA: STEEL WIRE ROPE MARKET, BY DIAMETER, 2023–2030 (KILOTON)


TABLE 153
MIDDLE EAST & AFRICA: STEEL WIRE ROPE MARKET, BY MATERIAL TYPE, 2023–2030 (USD MILLION)


TABLE 154
MIDDLE EAST & AFRICA: STEEL WIRE ROPE MARKET, BY MATERIAL TYPE, 2023–2030 (KILOTON)


TABLE 155
MIDDLE EAST & AFRICA: STEEL WIRE ROPE MARKET, BY APPLICATION, 2023–2030 (USD MILLION)


TABLE 156
MIDDLE EAST & AFRICA: STEEL WIRE ROPE MARKET, BY APPLICATION, 2023–2030 (KILOTON)


TABLE 157
MIDDLE EAST & AFRICA: STEEL WIRE ROPE MARKET, BY COUNTRY, 2023–2030 (USD MILLION)


TABLE 158
MIDDLE EAST & AFRICA: STEEL WIRE ROPE MARKET, BY COUNTRY, 2023–2030 (KILOTON)


TABLE 159
UAE: STEEL WIRE ROPE MARKET, BY APPLICATION, 2023–2030 (USD MILLION)


TABLE 160
UAE: STEEL WIRE ROPE MARKET, BY APPLICATION, 2023–2030 (KILOTON)


TABLE 161
SAUDI ARABIA: STEEL WIRE ROPE MARKET, BY APPLICATION, 2023–2030 (USD MILLION)


TABLE 162
SAUDI ARABIA: STEEL WIRE ROPE MARKET, BY APPLICATION, 2023–2030 (KILOTON)


TABLE 163
REST OF GCC COUNTRIES: STEEL WIRE ROPE MARKET, BY APPLICATION, 2023–2030 (USD MILLION)


TABLE 164
REST OF GCC COUNTRIES: STEEL WIRE ROPE MARKET, BY APPLICATION, 2023–2030 (KILOTON)


TABLE 165
SOUTH AFRICA: STEEL WIRE ROPE MARKET, BY APPLICATION, 2023–2030 (USD MILLION)


TABLE 166
SOUTH AFRICA: STEEL WIRE ROPE MARKET, BY APPLICATION, 2023–2030 (KILOTON)


TABLE 167
REST OF MIDDLE EAST & AFRICA: STEEL WIRE ROPE MARKET, BY APPLICATION, 2023–2030 (USD MILLION)


TABLE 168
REST OF MIDDLE EAST & AFRICA: STEEL WIRE ROPE MARKET, BY APPLICATION, 2023–2030 (KILOTON)


TABLE 169
KEY PLAYERS’ STRATEGIES/RIGHT TO WIN, 2020–2025


TABLE 170
STEEL WIRE ROPE MARKET: DEGREE OF COMPETITION, 2024


TABLE 171
STEEL WIRE ROPE MARKET: REGION FOOTPRINT


TABLE 172
STEEL WIRE ROPE MARKET: LAY TYPE FOOTPRINT


TABLE 173
STEEL WIRE ROPE MARKET: MATERIAL TYPE FOOTPRINT


TABLE 174
STEEL WIRE ROPE MARKET: COATING TYPE FOOTPRINT


TABLE 175
STEEL WIRE ROPE MARKET: DIAMETER FOOTPRINT


TABLE 176
STEEL WIRE ROPE MARKET: APPLICATION FOOTPRINT


TABLE 177
STEEL WIRE ROPE MARKET: DETAILED LIST OF KEY START-UPS/SMES


TABLE 178
STEEL WIRE ROPE MARKET: COMPETITIVE BENCHMARKING OF KEY START-UPS/SMES (1/2)


TABLE 179
STEEL WIRE ROPE MARKET: COMPETITIVE BENCHMARKING OF KEY START-UPS/SMES (2/2)


TABLE 180
STEEL WIRE ROPE MARKET: DEALS, JANUARY 2020–OCTOBER 2025


TABLE 181
STEEL WIRE ROPE MARKET: PRODUCT LAUNCHES, JANUARY 2020–OCTOBER 2025


TABLE 182
STEEL WIRE ROPE MARKET: EXPANSIONS, JANUARY 2020–OCTOBER 2025


TABLE 183
BEKAERT: COMPANY OVERVIEW


TABLE 184
BEKAERT: PRODUCTS/SOLUTIONS/SERVICES OFFERED


TABLE 185
BEKAERT: DEALS


TABLE 186
WIRECO: COMPANY OVERVIEW


TABLE 187
WIRECO: PRODUCTS/SOLUTIONS/SERVICES OFFERED


TABLE 188
WIRECO: PRODUCT LAUNCHES


TABLE 189
WIRECO: EXPANSIONS


TABLE 190
KISWIRE LTD.: COMPANY OVERVIEW


TABLE 191
KISWIRE LTD.: PRODUCTS/SOLUTIONS/SERVICES OFFERED


TABLE 192
USHA MARTIN LIMITED: COMPANY OVERVIEW


TABLE 193
USHA MARTIN LIMITED: PRODUCTS/SOLUTIONS/SERVICES OFFERED


TABLE 194
USHA MARTIN LIMITED: PRODUCT LAUNCHES


TABLE 195
TEUFELBERGER: COMPANY OVERVIEW


TABLE 196
TEUFELBERGER: PRODUCTS/SOLUTIONS/SERVICES OFFERED


TABLE 197
LOOS & CO.INC.: COMPANY OVERVIEW


TABLE 198
LOOS & CO. INC.: PRODUCTS/SOLUTIONS/SERVICES OFFERED


TABLE 199
PFEIFER GROUP: COMPANY OVERVIEW


TABLE 200
PFEIFER GROUP: PRODUCTS/SOLUTIONS/SERVICES OFFERED


TABLE 201
PFEIFER GROUP: DEALS


TABLE 202
TOKYO ROPE MFG. CO., LTD.: COMPANY OVERVIEW


TABLE 203
TOKYO ROPE MFG. CO., LTD.: PRODUCTS/SOLUTIONS/SERVICES OFFERED


TABLE 204
JIANGSU LANGSHAN WIRE ROPE CO., LTD.: COMPANY OVERVIEW


TABLE 205
JIANGSU LANGSHAN WIRE ROPE CO., LTD.: PRODUCTS/SOLUTIONS/ SERVICES OFFERED


TABLE 206
BILCO GROUP: COMPANY OVERVIEW


TABLE 207
BILCO GROUP: PRODUCTS/SOLUTIONS/SERVICES OFFERED


TABLE 208
SWR LTD.: COMPANY OVERVIEW


TABLE 209
SWR LTD.: PRODUCTS/SOLUTIONS/SERVICES OFFERED


TABLE 210
LEXCO CABLE: COMPANY OVERVIEW


TABLE 211
LEXCO CABLE: PRODUCTS/SOLUTIONS/SERVICES OFFERED


TABLE 212
JIANGYIN JIAHUA ROPES CO., LTD.: COMPANY OVERVIEW


TABLE 213
JIANGYIN JIAHUA ROPES CO., LTD.: PRODUCTS/SOLUTIONS/SERVICES OFFERED


TABLE 214
NANTONG SHENWEI STEEL WIRE ROPE CO., LTD.: COMPANY OVERVIEW


TABLE 215
NANTONG SHENWEI STEEL WIRE ROPE CO., LTD.: PRODUCTS/SOLUTIONS/SERVICES OFFERED


TABLE 216
BHARAT WIRE ROPES LTD.: COMPANY OVERVIEW


TABLE 217
BHARAT WIRE ROPES LTD.: PRODUCTS/SOLUTIONS/SERVICES OFFERED


TABLE 218
HANGZHOU ZHEZHONG CHAIN CO., LTD.: COMPANY OVERVIEW


TABLE 219
TYLER MADISON, INC.: COMPANY OVERVIEW


TABLE 220
ORION ROPES PRIVATE LIMITED: COMPANY OVERVIEW


TABLE 221
ASAHI ROPES: COMPANY OVERVIEW


TABLE 222
DAVANGERE WIRE ROPE INDUSTRY PVT. LTD: COMPANY OVERVIEW


TABLE 223
SHREE STEEL WIRE ROPES LTD.: COMPANY OVERVIEW


TABLE 224
J D WIRE ROPES: COMPANY OVERVIEW


TABLE 225
SURASHA WIREROPES: COMPANY OVERVIEW


TABLE 226
JIANGYIN TUOXIN STEEL ROPE CO., LTD.: COMPANY OVERVIEW


TABLE 227
SHREE VARDHAMAN WIRE ROPES: COMPANY OVERVIEW


LIST OF FIGURES


FIGURE 1
STEEL WIRE ROPE MARKET: SEGMENTATION AND REGIONAL SCOPE


FIGURE 2
STEEL WIRE ROPE MARKET: RESEARCH DESIGN


FIGURE 3
MARKET SIZE ESTIMATION METHODOLOGY: BOTTOM-UP APPROACH


FIGURE 4
MARKET SIZE ESTIMATION: TOP-DOWN APPROACH


FIGURE 5
STEEL WIRE ROPE MARKET: DATA TRIANGULATION


FIGURE 6
REGULAR LAY TYPE TO ACCOUNT FOR LARGER MARKET SHARE IN 2030


FIGURE 7
STAINLESS STEEL SEGMENT TO LEAD MARKET IN 2030


FIGURE 8
NON-PLASTIC COATED SEGMENT TO DOMINATE MARKET IN 2030


FIGURE 9
>1/4 INCH SEGMENT TO ACCOUNT FOR LARGER SHARE IN 2030


FIGURE 10
CONSTRUCTION APPLICATION TO LEAD MARKET IN 2030


FIGURE 11
ASIA PACIFIC TO REGISTER HIGHEST GROWTH DURING FORECAST PERIOD


FIGURE 12
INCREASING DEMAND FROM CONSTRUCTION APPLICATION TO CREATE LUCRATIVE OPPORTUNITIES FOR MARKET PLAYERS


FIGURE 13
CONSTRUCTION SEGMENT AND ASIA PACIFIC LED STEEL WIRE ROPE MARKET IN 2024


FIGURE 14
LANG LAY TYPE TO EXHIBIT HIGHER CAGR DURING FORECAST PERIOD


FIGURE 15
STAINLESS STEEL TO REGISTER HIGHEST CAGR DURING FORECAST PERIOD


FIGURE 16
PLASTIC COATED SEGMENT TO RECORD HIGHER CAGR DURING FORECAST PERIOD


FIGURE 17
≤1/4 INCH SEGMENT TO RECORD HIGHER CAGR DURING FORECAST PERIOD


FIGURE 18
CONSTRUCTION APPLICATION TO GROW AT HIGHEST CAGR DURING FORECAST PERIOD


FIGURE 19
CHINA TO REGISTER HIGHEST CAGR IN STEEL WIRE ROPE MARKET DURING FORECAST PERIOD


FIGURE 20
DRIVERS, RESTRAINTS, OPPORTUNITIES, AND CHALLENGES IN STEEL WIRE ROPE MARKET


FIGURE 21
PORTER’S FIVE FORCES ANALYSIS


FIGURE 22
INFLUENCE OF STAKEHOLDERS ON BUYING PROCESS FOR TOP THREE APPLICATIONS


FIGURE 23
BUYING CRITERIA FOR TOP THREE APPLICATIONS


FIGURE 24
STEEL WIRE ROPE MARKET: SUPPLY CHAIN ANALYSIS


FIGURE 25
STEEL WIRE ROPE MARKET: ECOSYSTEM ANALYSIS


FIGURE 26
EXPORT DATA FOR HS CODE 731210-COMPLIANT PRODUCTS, BY COUNTRY, 2020–2024 (USD THOUSAND)


FIGURE 27
IMPORT DATA FOR HS CODE 731210-COMPLIANT PRODUCTS, BY COUNTRY, 2020–2024 (USD THOUSAND)


FIGURE 28
PATENT ANALYSIS, BY DOCUMENT TYPE, 2015–2024


FIGURE 29
PATENT PUBLICATION TRENDS, 2015−2024


FIGURE 30
LEGAL STATUS OF PATENTS, 2015–2024


FIGURE 31
CHINA REGISTERED HIGHEST PERCENTAGE OF PATENTS BETWEEN 2015 AND 2024


FIGURE 32
TOP 10 PATENT APPLICANTS, 2015–2024


FIGURE 33
TRENDS AND DISRUPTIONS IMPACTING CUSTOMER BUSINESS


FIGURE 34
INVESTMENT AND FUNDING SCENARIO, 2021–2024 (USD MILLION)


FIGURE 35
LANG LAY SEGMENT TO REGISTER HIGHER CAGR DURING FORECAST PERIOD


FIGURE 36
≤1/4 INCH DIAMETER SEGMENT TO REGISTER HIGHER CAGR DURING FORECAST PERIOD


FIGURE 37
PLASTIC-COATED SEGMENT TO REGISTER HIGHEST CAGR DURING FORECAST PERIOD


FIGURE 38
CONSTRUCTION SEGMENT TO REGISTER HIGHEST CAGR DURING FORECAST PERIOD


FIGURE 39
STAINLESS STEEL SEGMENT TO REGISTER HIGHEST CAGR DURING FORECAST PERIOD


FIGURE 40
CHINA TO REGISTER HIGHEST GROWTH IN STEEL WIRE ROPE MARKET DURING FORECAST PERIOD


FIGURE 41
NORTH AMERICA: STEEL WIRE ROPE MARKET SNAPSHOT


FIGURE 42
ASIA PACIFIC: STEEL WIRE ROPE MARKET SNAPSHOT


FIGURE 43
EUROPE: STEEL WIRE ROPE MARKET SNAPSHOT


FIGURE 44
REVENUE ANALYSIS OF KEY PLAYERS, 2020–2024 (USD MILLION)


FIGURE 45
MARKET SHARE ANALYSIS OF KEY PLAYERS, 2024


FIGURE 46
TOP TRENDING BRANDS/PRODUCTS


FIGURE 47
BRAND/PRODUCT COMPARISON


FIGURE 48
STEEL WIRE ROPE MARKET: COMPANY EVALUATION MATRIX (KEY PLAYERS), 2024


FIGURE 49
STEEL WIRE ROPE MARKET: COMPANY FOOTPRINT


FIGURE 50
STEEL WIRE ROPE MARKET: COMPANY EVALUATION MATRIX (START-UPS/SMES), 2024


FIGURE 51
STEEL WIRE ROPE MARKET: COMPANY VALUATION


FIGURE 52
STEEL WIRE ROPE MARKET: FINANCIAL METRICS (EV/EBITDA)


FIGURE 53
YEAR-TO-DATE (YTD) PRICE TOTAL RETURN AND FIVE-YEAR STOCK BETA


FIGURE 54
BEKAERT: COMPANY SNAPSHOT


FIGURE 55
KISWIRE LTD.: COMPANY SNAPSHOT


FIGURE 56
USHA MARTIN LIMITED: COMPANY SNAPSHOT


FIGURE 57
TOKYO ROPE MFG. CO., LTD.: COMPANY SNAPSHOT


FIGURE 58
BHARAT WIRE ROPES LTD.: COMPANY SNAPSHOT


Methodology

The study involves two major activities in estimating the current market size for the steel wire rope market. Exhaustive secondary research was done to collect information on the market, peer market, and parent market. The next step was to validate these findings, assumptions, and sizing with industry experts across the value chain through primary research. Both top-down and bottom-up approaches were employed to estimate the complete market size. After that, market breakdown and data triangulation were used to estimate the market size of segments and subsegments.

Secondary Research

Secondary sources referred to for this research study include financial statements of companies offering steel wire rope and information from various trade, business, and professional associations. Secondary research has been used to obtain critical information about the industry’s value chain, the total pool of key players, market classification, and segmentation according to industry trends, to the bottom-most level, and regional markets. Secondary data was collected and analyzed to arrive at the overall size of the steel wire rope market, which was validated by primary respondents.

Primary Research

Extensive primary research was conducted after obtaining information regarding the steel wire rope market scenario through secondary research. Several primary interviews were conducted with market experts from both the demand and supply sides across major countries of North America, Europe, Asia Pacific, the Middle East & Africa, and Latin America. Primary data was collected through questionnaires, emails, and telephonic interviews. The primary sources from the supply side included various industry experts, such as chief experience officers (CXOs), vice presidents (VPs), business development/marketing directors, product development/innovation teams, related key executives from the steel wire rope industry, system integrators, component providers, distributors, and key opinion leaders. Primary interviews were conducted to gather insights such as market statistics, data on revenue collected from the products and services, market breakdowns, market size estimations, market forecasting, and data triangulation. Primary research also helped in understanding the various trends related to lay type, material type, coating, diameter, application, and region. Stakeholders from the demand side, including CIOs, CTOs, CSOs, and installation teams of customers/end users for steel wire rope services, were interviewed to understand the buyer’s perspective on the suppliers, products, component providers, and their current usage of steel wire rope and future outlook of their business, which will affect the overall market.

Breakup of Primary Research:

Steel Wire Rope Market

To know about the assumptions considered for the study, download the pdf brochure

Market Size Estimation

The research methodology used to estimate the size of the steel wire rope market includes the following details. The market size was determined from the demand side. The market was upsized based on the demand for steel wire rope in different applications at the regional level. Such procurements provide information on the demand aspects of the steel wire rope industry for each application. For each application, all possible segments of the steel wire rope market were integrated and mapped.

Steel Wire Rope Market

Data Triangulation

After arriving at the overall size from the market size estimation process explained above, the total market was split into several segments and subsegments. The data triangulation and market breakdown procedures explained below were implemented, wherever applicable, to complete the overall market engineering process and arrive at the exact statistics for various market segments and subsegments. The data was triangulated by studying various factors and trends from the demand and supply sides. Along with this, the market size was validated using both the top-down and bottom-up approaches.

Market Definition

The steel wire rope market comprises manufacturers, suppliers, and distributors involved in the production and commercialization of steel wire ropes. These ropes are primarily used for lifting, hoisting, towing, and anchoring applications across various industries, such as construction, mining, oil & gas, marine, cranes, elevators, and infrastructure.

The market encompasses a wide range of product types, including galvanized, stainless steel, plastic-coated, and uncoated ropes, available in different diameters and configurations based on industry-specific requirements.

Stakeholders

  • Steel wire rope manufacturers
  • Steel wire rope distributors and suppliers
  • Universities, governments, and research organizations
  • Associations and industrial bodies
  • R&D institutes
  • Environmental support agencies
  • Investment banks and private equity firms
  • Research and consulting firms

Report Objectives

  • To define, describe, and forecast the steel wire rope market size in terms of volume and value
  • To provide detailed information regarding the key factors, such as drivers, restraints, opportunities, and challenges influencing the market growth
  • To analyze and project the global steel wire rope market by lay type, material type, coating, diameter, application, and region
  • To forecast the market size concerning five main regions (along with country-level data), namely, North America, Europe, Asia Pacific, Middle East & Africa, and Latin America, and analyze the significant region-specific trends
  • To strategically analyze micromarkets with respect to individual growth trends, prospects, and contributions of the submarkets to the overall market
  • To analyze the market opportunities and the competitive landscape for stakeholders and market leaders
  • To assess recent market developments and competitive strategies, such as agreements, contracts, acquisitions, and product developments/product launches, to draw the competitive landscape
  • To strategically profile the key market players and comprehensively analyze their core competencies


Personalize This Research

  • Triangulate with your Own Data
  • Get Data as per your Format and Definition
  • Gain a Deeper Dive on a Specific Application, Geography, Customer or Competitor
  • Any level of Personalization
Request A Free Customisation

Let Us Help You

  • What are the Known and Unknown Adjacencies Impacting the Steel Wire Rope Market
  • What will your New Revenue Sources be?
  • Who will be your Top Customer; what will make them switch?
  • Defend your Market Share or Win Competitors
  • Get a Scorecard for Target Partners
Customized Workshop Request

Custom Market Research Services

We Will Customise The Research For You, In Case The Report Listed Above Does Not Meet With Your Requirements

Get 10% Free Customisation

Growth opportunities and latent adjacency in Steel Wire Rope Market

DMCA.com Protection Status