The study involved four major activities in estimating the size of the structural health monitoring market. Exhaustive secondary research has been carried out to collect information on the market, the peer markets, and the parent market. Both top-down and bottom-up approaches have been employed to estimate the total market size. Market breakdown and data triangulation methods have also been used to estimate the market for segments and subsegments.
Secondary Research
Revenues of companies offering structural health monitoring systems have been obtained from the secondary data available through paid and unpaid sources. The revenues have also been derived by analyzing the product portfolio of key companies, and these companies have been rated according to the performance and quality of their products.
In the secondary research process, various sources have been referred to for identifying and collecting information for this study on the structural health monitoring market. Secondary sources considered for this research study include government sources, corporate filings, and trade, business, and professional associations. Secondary data has been collected and analyzed to arrive at the overall market size, which has been further validated through primary research.
Secondary research has been mainly used to obtain key information about the supply chain of Structural health monitoring systems to identify key players based on their products and prevailing industry trends in the Structural health monitoring market by offering, type, panel size, location, vertical, and region. Secondary research also helped obtain market information- and technology-oriented key developments undertaken by market players to expand their presence and increase their market share.
Primary Research
Extensive primary research has been conducted after understanding and analyzing the current scenario of the Structural health monitoring market through secondary research. Several primary interviews have been conducted with the key opinion leaders from the demand and supply sides across four main regions-North America, Europe, Asia Pacific, and the Rest of Europe. Approximately 25% of the primary interviews were conducted with the demand-side respondents, while approximately 75% were conducted with the supply-side respondents. The primary data has been collected through questionnaires, emails, and telephone interviews.
After interacting with industry experts, brief sessions were conducted with highly experienced independent consultants to reinforce the findings from our primary. This, along with the in-house subject matter experts’ opinions, has led us to the findings as described in the remainder of this report. The breakdown of primary respondents is as follows:

To know about the assumptions considered for the study, download the pdf brochure
Market Size Estimation
The bottom-up procedure has been employed to arrive at the overall size of the structural health monitoring market.
-
Analyzing the size of the structural health monitoring market in each country by identifying segmental revenues of players in this market
-
Identifying the total number of structures in the country that require structural health monitoring
-
Estimating the prices of hardware and software solutions needed for the project
-
Estimating the size of the structural health monitoring market in each country (total number of structures that require monitoring in the country * total cost of hardware, software, and services)
-
Estimating the market size in each region by the summation of the country-wise market data
-
Identifying the upcoming structural health monitoring projects by various companies in different regions and forecasting the market size based on these development and other important parameters
-
Estimating the global market by the summation of region-wise data

The top-down approach has been used to estimate and validate the total size of the Structural health monitoring market.
-
Initially, the focus was on top-line investments and spending in the ecosystems. Further, the segment level splits and major developments in the market have been considered.
-
Information related to the market revenue generated by key players in the structural health monitoring market has been obtained.
-
Multiple discussions have been conducted with key opinion leaders from major companies that develop structural health monitoring instruments and software and provide monitoring and supply-related services.
-
Geographic splits have been estimated using secondary sources based on factors such as the number of players in a specific region, types of services or the instruments manufactured, and various end users related to the market.

Data Triangulation
After arriving at the overall market size-using the market size estimation processes as explained above-the market has been split into several segments and subsegments. To complete the entire market engineering process and arrive at the exact statistics of each market segment and subsegment, data triangulation and market breakdown procedures have been employed, wherever applicable. The data has been triangulated by studying various factors and trends from the demand and supply sides in the structural health monitoring market.
Market Definition
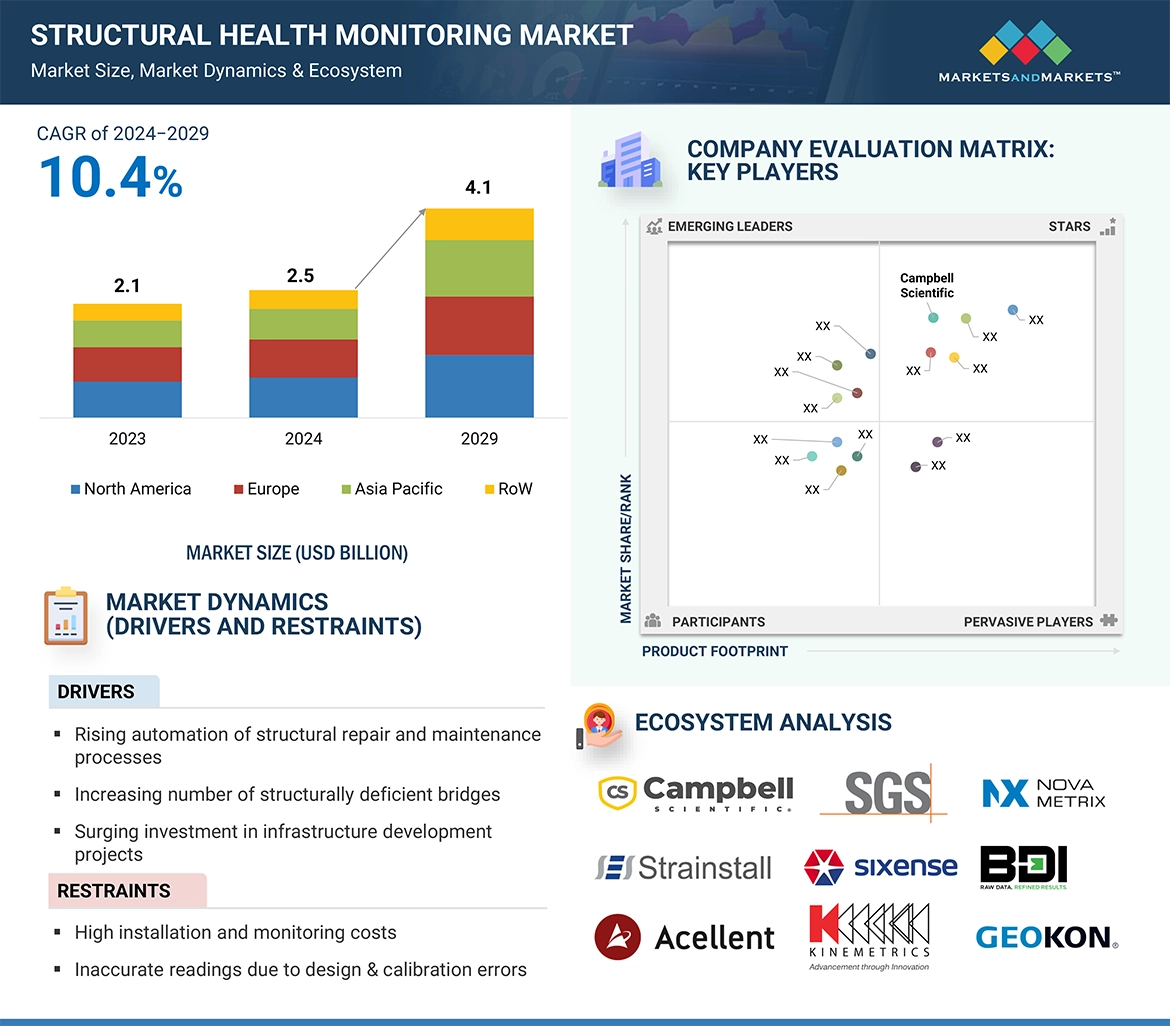
Structural health monitoring is the process of implementing a damage detection strategy for any civil and mechanical engineering structures or components. Its goal is to identify structural changes and damages at the earliest so that corrective actions can be taken to reduce the risk of catastrophic failure, injury, or even loss of life, as well as minimize downtime and operational and maintenance costs. Structural health monitoring is required not only in pre-construction, under-construction, post-construction phases but also in the dilapidation stage. Structural health monitoring systems are crucial for the successful completion of infrastructural projects. Applications of structural health monitoring systems and services vary according to the complexity of the structure.
At present, structural health monitoring systems are adopted globally to monitor civil infrastructures such as dams, tunnels, bridges, buildings and stadiums. They find applications in aerospace & defense, energy, mining, industrial machinery, automotive & transportation, and marine markets. Structural health monitoring combines advanced sensor technologies with intelligent algorithms to infer the health condition of structures, enabling improved reliability and safety and enhanced structural performance.
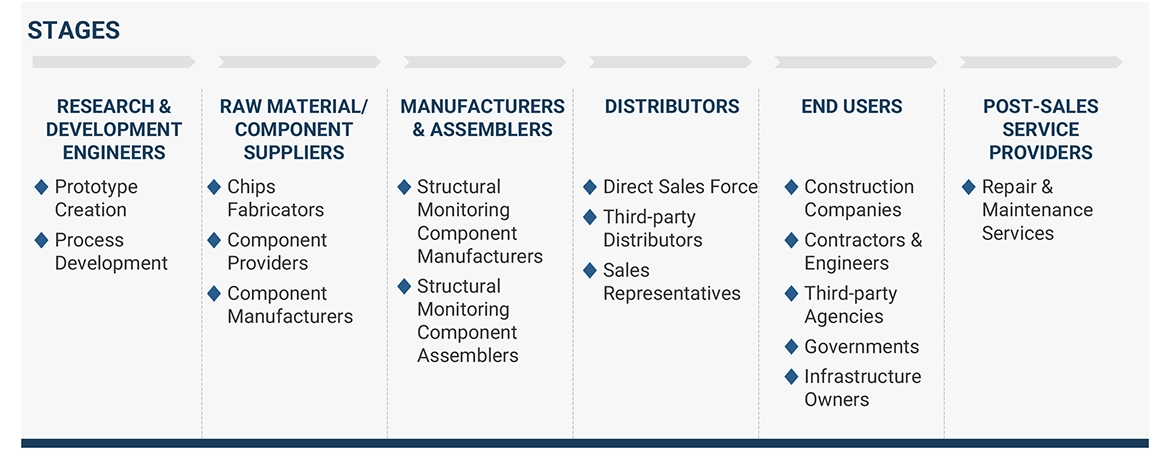
Key Stakeholders
-
Semiconductor and electronic component manufacturers and distributors
-
Sensor manufacturers and distributors
-
Raw material and manufacturing equipment suppliers
-
Original equipment manufacturers (OEMs)
-
ODM and OEM technology solution providers
-
Technology standards organizations, forums, alliances, and associations
-
Government bodies, venture capitalists, and private equity firms
-
System integrators
-
Construction and infrastructure service providers
-
Green-field and brown-field project development companies
-
Research organizations
-
Technology investors
Report Objectives
-
To define, describe, segment, and forecast the structural health monitoring market, by offering, technology, and vertical, in terms of value
-
To forecast the market for sensors, which is the subsegment of hardware offerings, in terms of volume
-
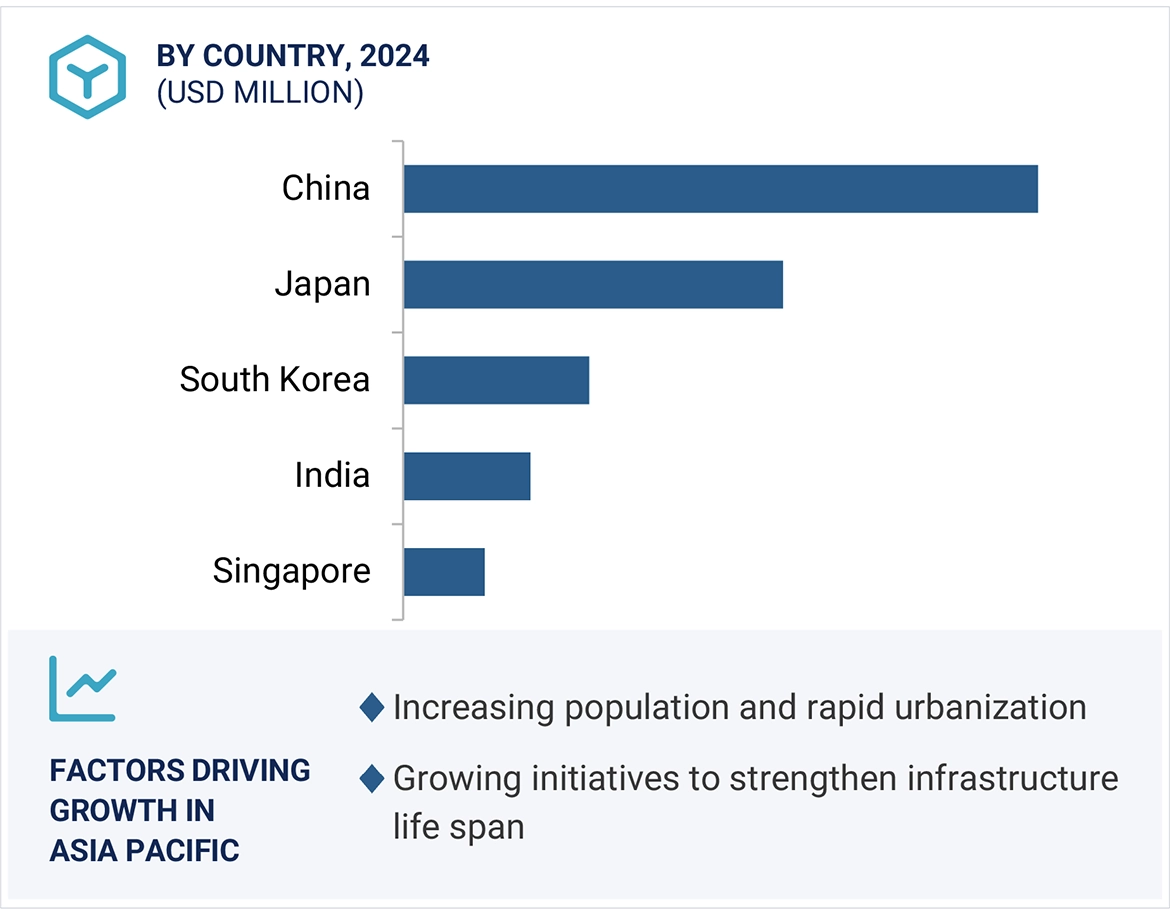
To describe and forecast the market for various segments, with respect to four main regions, namely, the North America, Europe, Asia Pacific, and the RoW(South America, and MEA), in terms of value
-
To provide detailed information regarding drivers, restraints, opportunities, and challenges influencing the growth of the structural health monitoring market
-
To define and describe implementation methods and applications of structural health monitoring systems
-
To understand and analyze the impact of evolving technologies on the overall value chain of the structural health monitoring market and upcoming trends in the ecosystem
-
To forecast and compare the market size of pre-recession with that of the post-recession at the regional level
-
To provide a detailed overview of the structural health monitoring market’s value chain, along with the ecosystem, technology trends, use cases, regulatory environment, and Porter’s five forces analysis for the market
-
To analyze industry trends, pricing data, patents and innovations, and trade data (export and import data) related to the structural health monitoring systems
-
To strategically analyze the micromarkets with respect to individual growth trends, prospects, and contributions to the total market
-
To strategically profile the key players and comprehensively analyze their market share and core competencies
-
To analyze opportunities for stakeholders and provide a detailed competitive landscape of the market
-
To analyze competitive developments such as product launches/developments, contracts, collaborations, partnerships, agreements, acquisitions, expansions, and research and development (R&D) activities carried out by players in the structural health monitoring market
Available customizations:
With the given market data, MarketsandMarkets offers customizations according to the specific requirements of companies. The following customization options are available for the report:
-
Detailed analysis and profiling of additional market players based on various blocks of the supply chain


User
Sep, 2019
I've seen that catastrophic failures of the civil structures led to severe losses. SHM is best solution to overcome it. I am researching various aspects of structural health monitoring and this document looks to be of interest. It is possible that extracts from this may be quoted and the reference cited in a forthcoming publication by Construction Industry Research and Information Association (CIRIA). .
User
Sep, 2019
Because of my new role, I would like to read your analysis and adapt to German and scandinavian markets. It could be useful to find out new market segment to develop in the next years. Can you share sectional infromation? What is the price for that?.
User
Sep, 2019
I am writing my Master's Thesis on business model innovation through Industry 4.0. The proposed new business models are especially for Structural Health Monitoring divisions. Does the report provide any specific information about how infrastructural developments and investments could create oppportunities for SHM? .
User
Nov, 2019
I am currently doing research on the sensors and data analytics for structural health monitoring. Does your report include information about recent launcches in the sensors and software for SHM? I am interested in understanding the current and upcoming market potential for the sensors in SHM? Can you provide such information? .
User
Mar, 2019
We have a structural monitoring project in Istanbul, turkey, and we want to learn global market details to improve our systems. Does the report include all the emerging trends, technological changes, projects in the SHM space? .