
Sustainability Certification Market Size, Share & Trends, 2025 To 2030

Sustainability Certification Market Size, Share, Growth & Trends by Climate Impact, Material Sustainability, Energy & Emissions Management (Hydrogen, Carbon & Greenhouse Gas Management), Green Buildings, Electric Vehicle (EV) Batteries, Circular Economy - Global Forecast to 2030


SUSTAINABILITY CERTIFICATION MARKET SIZE, SHARE & TRENDS
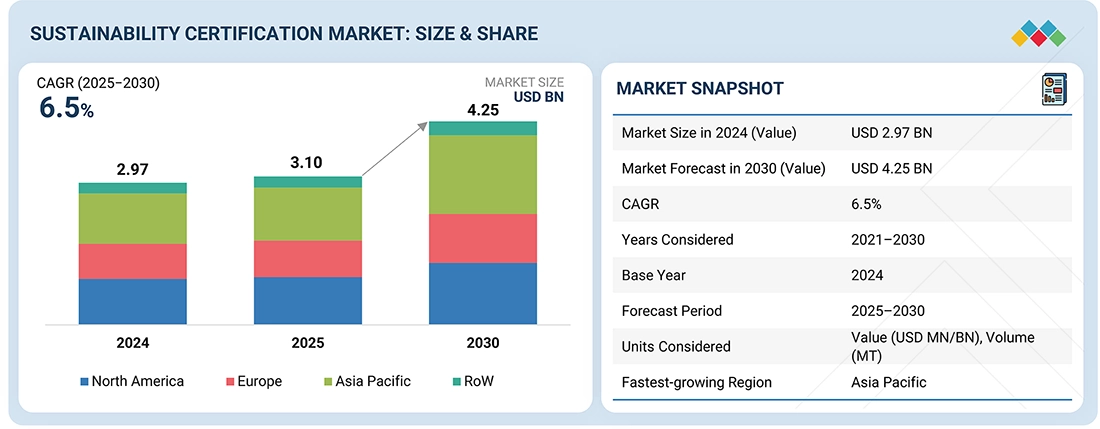
According to Marketsandmarkets, the global sustainability certification market size was valued at USD 3.10 billion in 2025 and is projected to reach USD 4.25 billion by 2030, growing at a CAGR of 6.5% from 2025 to 2030. The growth of the sustainability certification market is driven by the rising need for verified environmental performance, ethical sourcing, and regulatory compliance across industries to ensure responsible and transparent business operations.
MARKET SNAPSHOT TABLE
| REPORT METRIC | DETAILS |
|---|---|
| Market Size in 2025 (Value) | USD 3.10 Billion |
| Market Forecast in 2030 (Value) | USD 4.25 Billion |
| Growth Rate | CAGR of 6.5% from 2025-2030 |
| Years Considered | 2021-2030 |
| Base Year | 2024 |
| Forecast Period | 2025-2030 |
| Units Considered | Value (USD Million/Billion), Volume (MT) |
| Report Coverage | Revenue forecast, company ranking, competitive landscape, growth factors, and trends |
| Top Companies |
|
| Growth Drivers |
|
| Segments Covered |
|
| Regions Covered | North America, Asia Pacific, Europe, South America, Rest of the World (RoW) |
Market Size & Forecast
KEY TAKEAWAYS
-
BY APPLICATIONKey applications include energy & emissions management, mobility & transportation, infrastructure, and circular economy practices. Energy & emissions management represents the largest segment, driven by the growing adoption of renewable energy, carbon management initiatives, and strict environmental regulations.
-
BY VERTICALIndustrial, residential, and commercial sectors constitute the main verticals. The industrial segment is the largest and exhibits the highest CAGR, as manufacturers increasingly adopt sustainability certifications to ensure regulatory compliance, operational efficiency, and ESG alignment across processes.
-
BY SUSTAINABILITY FOCUSClimate impact, energy efficiency, material sustainability, and supply chain sustainability are the primary focus areas. Climate impact is the largest segment, driven by global initiatives on carbon reduction and environmental accountability.
-
BY REGIONThe market spans North America, Europe, Asia Pacific, and the Rest of the World (ROW). The Asia Pacific is expected to record the highest CAGR, supported by stricter sustainability regulations, rapid industrial growth, and increasing adoption of renewable energy and green infrastructure projects.
-
COMPETITIVE LANDSCAPEKey players are focusing on digital traceability, partnerships, and expanding certification services to enhance adoption and credibility. Major companies include Société Générale de Surveillance SA (SGS SA) (Switzerland), UL LLC (US), TÜV SÜD (Germany), TÜV Rheinland (Germany), and Bureau Veritas (France), which provide comprehensive sustainability certification services across various industries and applications.
The sustainability certification industry is witnessing steady growth, driven by the rising demand for verified standards in environmental sustainability, social responsibility, and product- and process-specific compliance to enhance operational transparency and corporate credibility. New deals and developments, including strategic partnerships between certification bodies and industries, investments in digital traceability and ESG reporting platforms, and innovations in renewable energy, green buildings, and circular economy practices, are reshaping the market landscape.
Source: Secondary Research, Interviews with Experts, MarketsandMarkets Analysis
TRENDS & DISRUPTIONS IMPACTING CUSTOMERS' CUSTOMERS
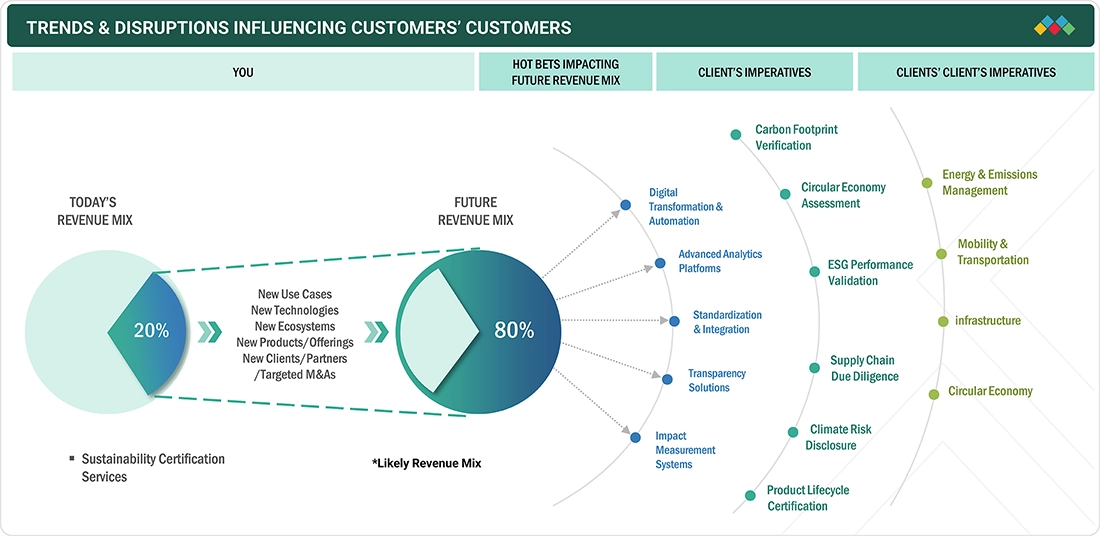
The impact on consumers' businesses stems from customer trends or disruptions. It shows how companies' revenue mix is likely to change over the next 4-5 years, shifting from current offerings to new use cases, technologies, and markets. The market for sustainability certification is influenced by evolving customer preferences and regulatory changes, resulting in a shift of company revenue from traditional services to digital platforms, integrated assessments, and advanced analytics. Major trends include digital transformation and automation in certification processes, which enable real-time monitoring and ESG validation, as well as the use of analytics for verifying carbon footprints, assessing the circular economy, and disclosing climate risks—overall improving transparency and operational efficiency across industries.
Source: Secondary Research, Interviews with Experts, MarketsandMarkets Analysis
SUSTAINABILITY CERTIFICATION MARKET DYNAMICS
Level
-
Consumer demand for sustainability certified products

-
Increasing regulatory pressure

Level
-
High costs of obtaining and maintaining multiple certifications

-
Complexity and fragmentation in sustainability certification standards

Level
-
Advancements in green energy and carbon markets

-
Increasing focus on circular economy certifications

Level
-
Managing greenwashing concerns and ensuring credibility

-
Evolving sustainability metrics and regulatory standards

Source: Secondary Research, Interviews with Experts, MarketsandMarkets Analysis
Driver: Consumer demand for sustainability certified products
Rising consumer demand for eco-friendly and ethically produced products is driving the sustainability certification market size. Certifications provide credibility for claims such as low carbon footprint, fair trade, and environmentally responsible production. Adoption of digital traceability, blockchain, and AI-enabled verification enhances transparency, enabling companies to meet consumer expectations and strengthen brand trust.
Restraint: High costs of obtaining and maintaining multiple certifications
The high costs of obtaining and maintaining multiple sustainability certifications pose a major restraint, especially for SMEs. Expenses include audit and reporting fees, third-party assessments, compliance with evolving regulations, employee training, and the implementation of sustainable practices. These financial and administrative burdens can limit adoption, slow industry expansion, and hinder cross-sector penetration.
Opportunity: Advancements in green energy and carbon markets
Rising adoption of renewable energy, carbon credits, and net-zero initiatives is driving the demand for sustainability certifications. Innovations in blockchain and digital tracking enhance transparency and compliance, while infrastructure, mobility, and energy sectors increasingly leverage certifications to meet regulatory requirements and ESG commitments, creating significant market growth opportunities.
Challenge: Managing greenwashing concerns and ensuring credibility
The sustainability certification market growth faces challenges in combating greenwashing and maintaining credibility as demand for certifications grows. Inconsistent standards, self-declared eco-labels, and rising consumer scrutiny require certifiers to adopt rigorous verification, third-party audits, and globally recognized benchmarks, supported by digital tools like AI and blockchain, to ensure transparency and trust.
Sustainability Certification Market Trends: COMMERCIAL USE CASES ACROSS INDUSTRIES
| COMPANY | USE CASE DESCRIPTION | BENEFITS |
|---|---|---|
 |
ISCC PLUS certification for entire production chain validating chemical-free farming, efficient resource use, and responsible supply chain management | Enhanced credibility across automotive, construction, and food sectors | Positioned as industry leader in sustainable hemp production | Gained competitive edge as sustainability compliance became key market requirement |
 |
Planet Mark certification for net-zero roadmap; implemented digital printing, LED lighting, 100% renewable energy, and employee engagement programs | Reduction in carbon emissions | Decrease in energy consumption | Reduction in natural gas use | Employee engagement increased |
 |
Life Cycle Assessment (LCA) certification with SGS SA compliant with EN 15804 and Dutch NMD for fiber gypsum boards; included data collection, impact assessment, and third-party verification | Increased product visibility in Dutch market | Enhanced appeal to eco-conscious customers | Established foundation for future LCAs on Fermacell-branded products |
 |
ISO 14064 carbon footprint certification for Gigafactories; battery recycling certifications (R2, e-Stewards); renewable energy certifications for solar installations and energy storage systems | Verified carbon-neutral manufacturing operations | Battery material recovery rate | Enhanced credibility in EV market | Improved investor confidence in sustainability commitments. |
 |
LEED certification for fulfillment centers and data centers; Green-e renewable energy certifications for wind and solar projects; sustainable packaging certifications (FSC, How2Recycle) | LEED-certified buildings globally | Accelerated renewable energy goal | Reduction in packaging weight | Enhanced corporate reputation | Cost savings through energy efficiency |
Logos and trademarks shown above are the property of their respective owners. Their use here is for informational and illustrative purposes only.
SUSTAINABILITY CERTIFICATION MARKET ECOSYSTEM
The sustainability certification market growth ecosystem consists of standards and regulatory bodies (ISO, LEED, FSC), certification service providers (SGS, Bureau Veritas), auditing and consulting firms (DNV, ERM), and end users across industrial, commercial, and residential sectors. Standards define requirements, service providers and auditors validate compliance, and end users drive demand for transparency and ESG alignment. Collaboration across the ecosystem is key to credibility, innovation, and market growth.
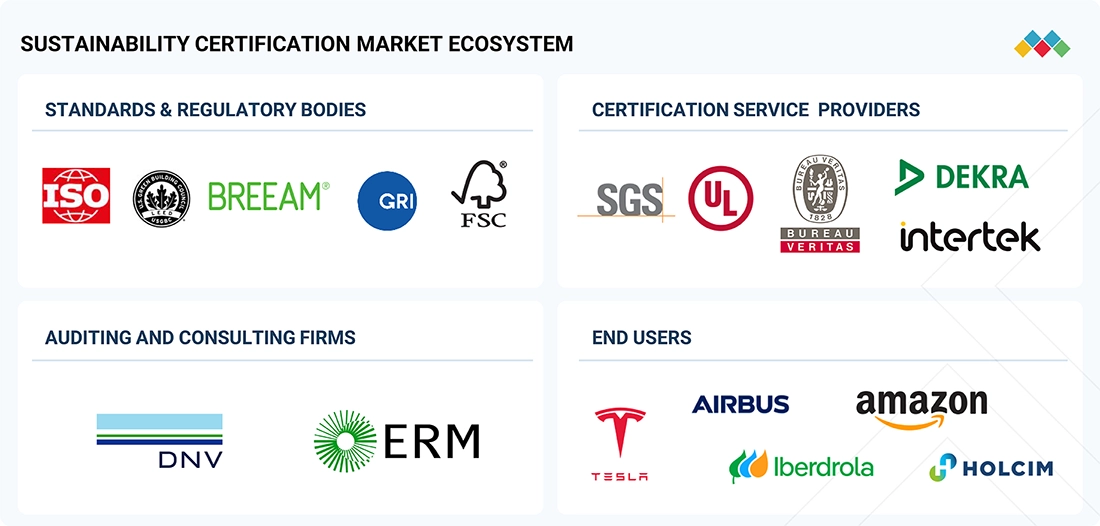
Logos and trademarks shown above are the property of their respective owners. Their use here is for informational and illustrative purposes only.
SUSTAINABILITY CERTIFICATION MARKET SEGMENTS
Source: Secondary Research, Interviews with Experts, MarketsandMarkets Analysis
Sustainability Certification Market Trends, By Application
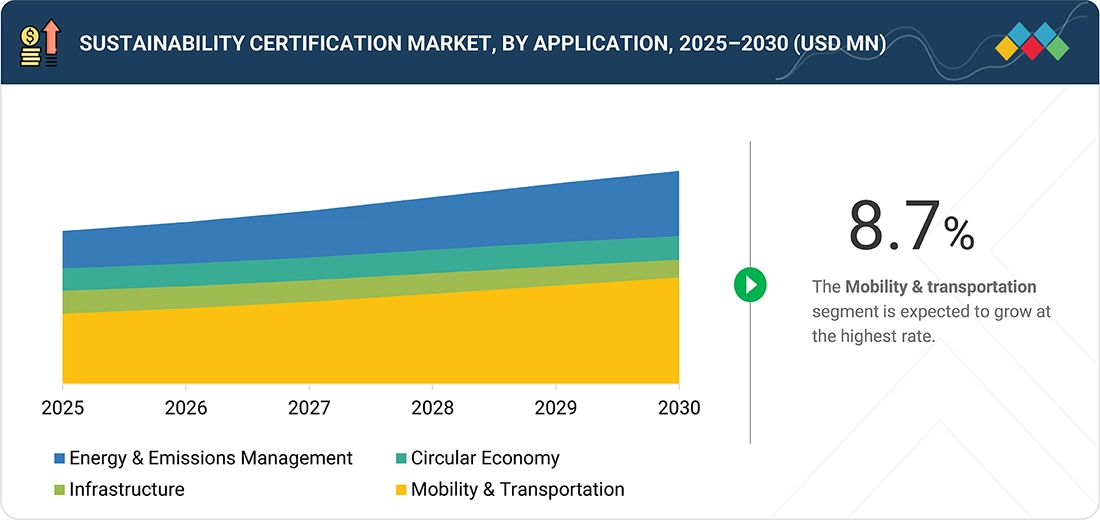
Energy and emissions management is projected to hold the largest share of the sustainability certification market from 2025 to 2030. Certifications in renewable energy (solar, wind, hydrogen) and carbon and greenhouse gas management are essential for compliance with environmental regulations and for meeting corporate sustainability objectives. Increasing adoption of ESG reporting, along with strict government mandates on carbon reduction, is spurring market growth. Additionally, advances in digital monitoring and real-time reporting tools are improving efficiency and transparency, strengthening energy and emissions management as the leading application segment. The mobility and transportation sector, especially EV batteries and vehicle emission standards, is experiencing the fastest growth, driven by electrification trends and rising emission compliance demands.
Sustainability Certification Market, By Vertical
The industrial sector is projected to account for the largest market share by 2030 and is expected to record the highest CAGR. Manufacturers across discrete and process industries are increasingly seeking certifications to ensure compliance with environmental, social, and governance (ESG) standards, enhance operational efficiency, and demonstrate accountability. The growing emphasis on sustainable supply chains, renewable energy integration, and process optimization is accelerating certification adoption. Certifications help industrial companies mitigate risks, meet regulatory mandates, and strengthen stakeholder trust, making this sector the primary driver of market growth.
Sustainability Certification Market, By Sustainability Focus
Climate impact is expected to hold the largest share of the sustainability certification market during 2025–2030, as organizations aim to measure and reduce carbon footprints, implement climate risk management, and comply with global carbon reduction initiatives. Supply chain sustainability is growing at the fastest rate, driven by increasing demand for responsible sourcing, transparency, and ethical practices across global supply networks. Digital tools, third-party audits, and standardized assessment frameworks are enabling companies to validate sustainability claims, improve accountability, and integrate ESG considerations into operations.
SUSTAINABILITY CERTIFICATION MARKET BY REGION
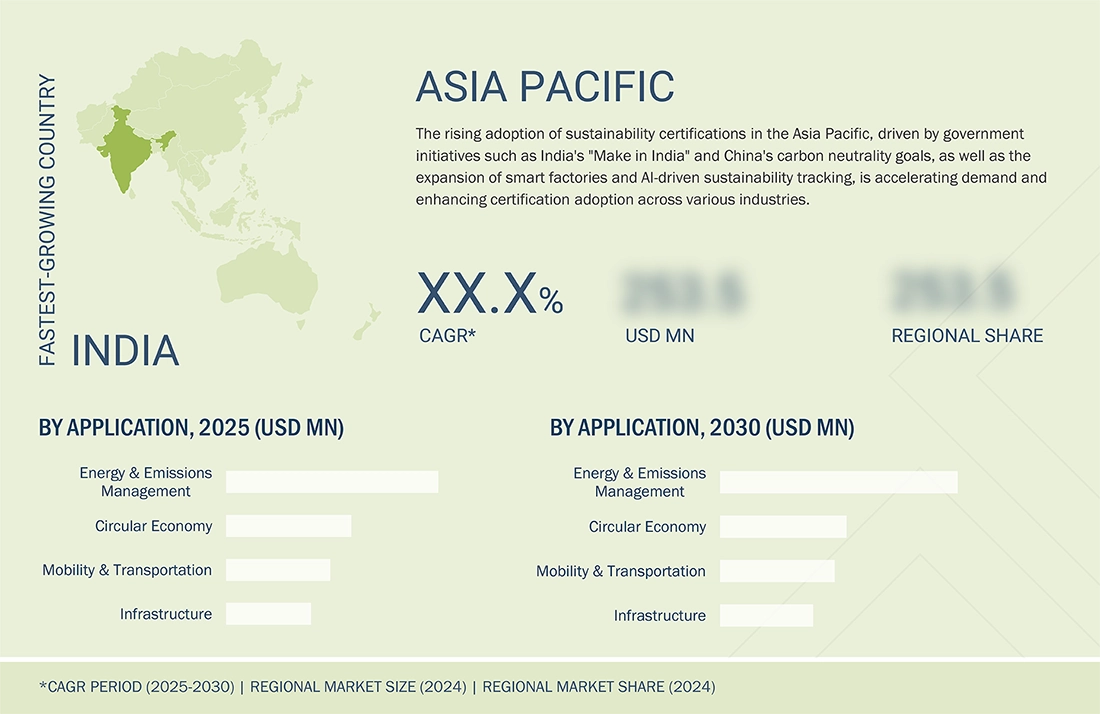
Asia Pacific to be fastest-growing region in global sustainability certification market growth during forecast period
The Asia Pacific is expected to have the highest CAGR in the sustainability certification market growth, driven by rapid industrialization, increasing regulatory demands, and rising demand for sustainable development. China, India, and South Korea are leading the way, adopting green manufacturing policies and reducing carbon footprints. The growth of smart factories, digitalization, and AI-based sustainability monitoring solutions is also fueling market expansion. Major companies are making significant investments in the region to develop certification infrastructure, enabling businesses to meet their environmental, social, and governance (ESG) obligations.
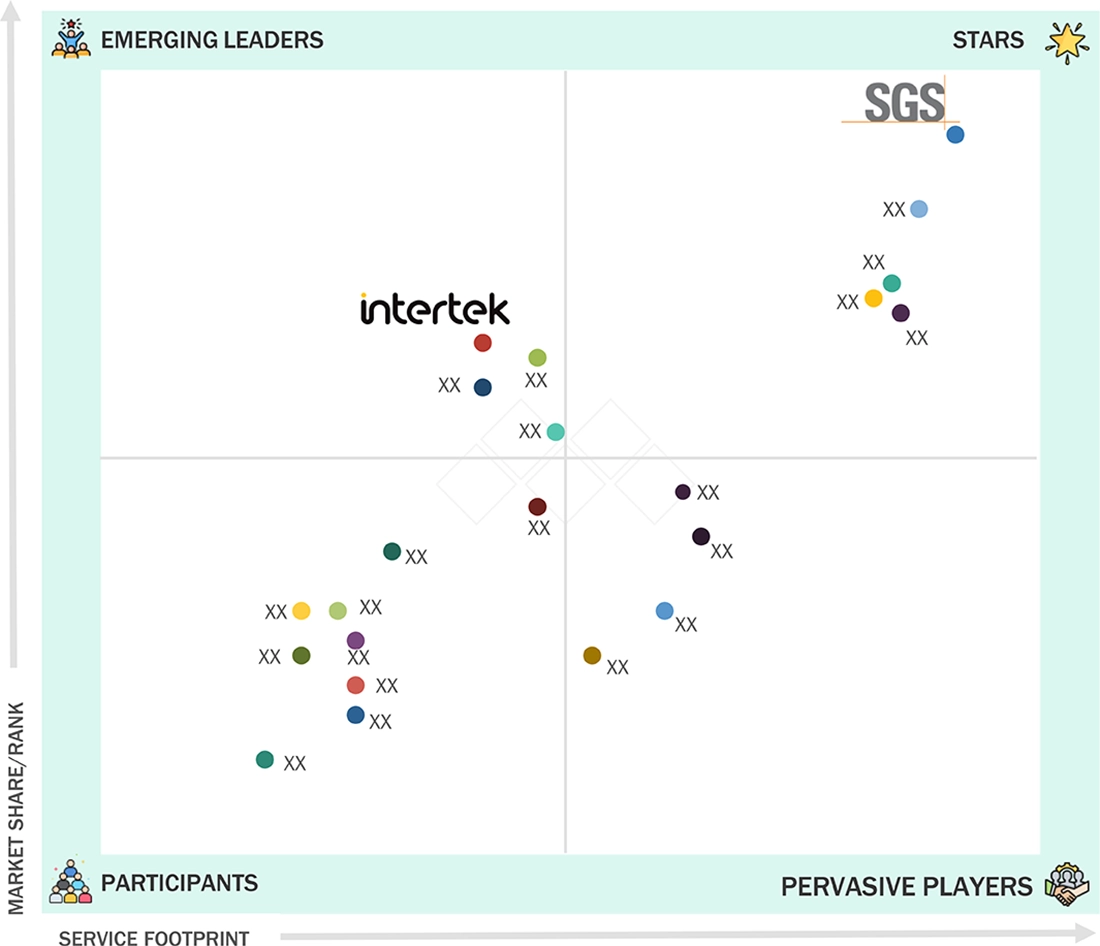
Sustainability Certification Market Growth: COMPANY EVALUATION MATRIX
In the sustainability certification market growth matrix, Société Générale de Surveillance SA (SGS SA) (Star) leads with a strong market share and an extensive service portfolio, driven by its comprehensive certifications across environmental, social, and product/process standards, which are widely adopted across industrial, commercial, and residential sectors. Intertek Group plc (Emerging Leader) is gaining visibility with its digital traceability solutions, ESG assessment services, and niche certifications, strengthening its position through innovation and expanding service offerings. While SGS dominates through scale and a broad portfolio, Intertek shows significant potential to move toward the leaders' quadrant as demand for credible, technology-enabled sustainability certifications continues to rise.
Source: Secondary Research, Interviews with Experts, MarketsandMarkets Analysis
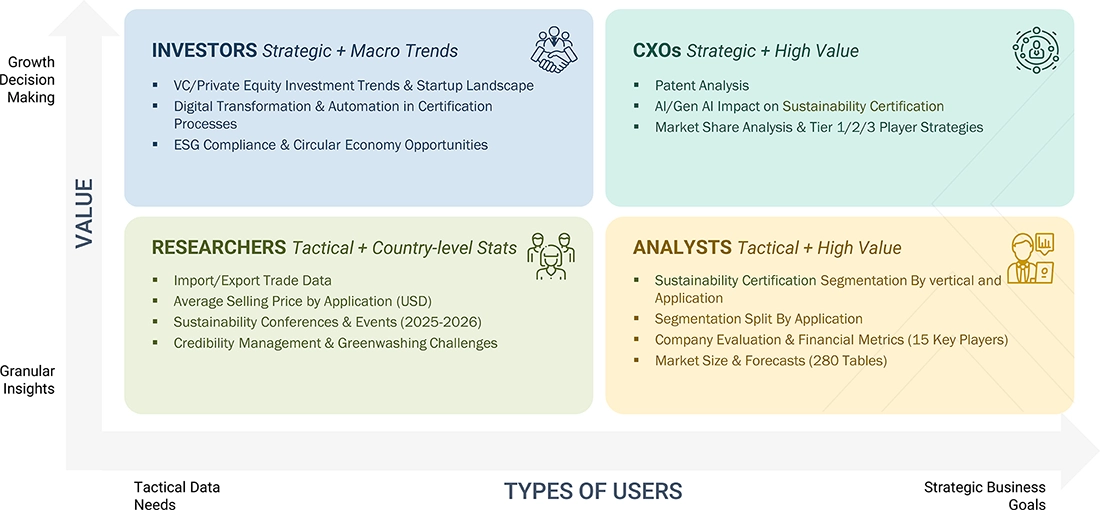
WHAT IS IN IT FOR YOU: Sustainability Certification Market REPORT CONTENT GUIDE
DELIVERED CUSTOMIZATIONS
We have successfully delivered the following deep-dive customizations:
| CLIENT REQUEST | CUSTOMIZATION DELIVERED | VALUE ADDS |
|---|---|---|
| Global Manufacturing Corporation | Competitive profiling of sustainability certification bodies (ISO, B Corp, LEED, Carbon Trust) | Identify cost-effective certification pathways |
| Renewable Energy Developer | Market adoption analysis of renewable energy certifications (REC, Green-e, I-REC) | Gap analysis between current operations and certification requirements |
| ESG Consulting Firm | Global certification market capacity and growth forecasting | Mapping of emerging certifications and standards (Science-based Targets, TCFD, GRI) |
| Circular Economy Solutions Provider | Technical & economic benefits of circular economy certifications (Cradle to Cradle, Ellen MacArthur Foundation, Zero Waste) | Assessment of product lifecycle and material flow mapping |
RECENT DEVELOPMENTS
- January 2025 : SGS SA (Switzerland) acquired US-based Aster Global Environmental Solutions, which offers carbon and greenhouse gas (GHG) validation and verification services, to increase its sustainability services and solutions. The acquisition complements SGS's IMPACT NOW sustainability platform and further strengthens its Strategy 27 diversity, equity, and inclusion initiative.
- May 2024 : SGS SA (Switzerland) introduced the SGS Green Mark, adding to its range of sustainability services to address the growing need for more sustainable products. The certification confirms environmental claims in seven attributes: recycled content, biodegradability, and hazardous substance testing. Developed in collaboration with industry experts, it allows brands, manufacturers, and retailers to prove compliance with sustainability requirements and build consumer confidence.
- April 2024 : Bureau Veritas (France) entered a partnership with the International Finance Corporation (IFC) (US) as a global certification provider for EDGE Green Building Certification. The partnership aimed to increase resource-efficient and zero-carbon buildings globally, enhancing sustainability in emerging markets. Bureau Veritas will use its international reach to facilitate compliance with EDGE standards and stimulate investment in green building.
- December 2023 : Bureau Veritas (France) partnered with Avance Labs (UAE) by signing a memorandum of understanding (MoU) to collaborate on hydrogen certification. Under this partnership, Bureau Veritas will be the exclusive Assurance Service Provider for the pilot phase of the I-REC (HX) Hydrogen Code, which offers transparency, verification, and certification of hydrogen and its derivative fuels. This partnership will help develop industry-wide standards for hydrogen tracking and certification.
- January 2023 : Bureau Veritas (France) introduced a full certification scheme for renewable hydrogen to guarantee secure and sustainable hydrogen production from renewable sources. The certification is transparent to investors and off-takers, evaluating ESG factors, safety, and carbon intensity. The program facilitates the energy transition globally and encourages investment in renewable hydrogen schemes.
Table of Contents
 Exclusive indicates content/data unique to MarketsandMarkets and not available with any competitors.
Methodology
The research study involved 4 major activities in estimating the size of the sustainability certification market. Exhaustive secondary research has been done to collect important information about the market and peer markets. The validation of these findings, assumptions, and sizing with the help of primary research with industry experts across the value chain has been the next step. Both top-down and bottom-up approaches have been used to estimate the market size. Post which the market breakdown and data triangulation have been adopted to estimate the market sizes of segments and sub-segments.
Secondary Research
In the secondary research process, various secondary sources have been referred to for identifying and collecting information required for this study. The secondary sources include annual reports, press releases, investor presentations of companies, white papers, and articles from recognized authors. Secondary research has been mainly done to obtain key information about the market’s value chain, the pool of key market players, market segmentation according to industry trends, regional outlook, and developments from both market and technology perspectives.
In the sustainability certification market report, the global market size has been estimated using both the top-down and bottom-up approaches, along with several other dependent submarkets. The major players in the market were identified using extensive secondary research, and their presence in the market was determined using secondary and primary research. All the percentage shares splits, and breakdowns have been determined using secondary sources and verified through primary sources.
Primary Research
Extensive primary research has been conducted after understanding the sustainability certification market scenario through secondary research. Several primary interviews have been conducted with key opinion leaders from both demand- and supply-side vendors across 4 major regions—North America, Europe, Asia Pacific, and Rest of the World. Approximately 25% of the primary interviews have been conducted with the demand-side vendors and 75% with the supply-side vendors. Primary data has been collected mainly through telephonic interviews, which consist of 80% of the total primary interviews; questionnaires and emails have also been used to collect the data.
After successful interaction with industry experts, brief sessions were conducted with highly experienced independent consultants to reinforce the findings of our primary research. This, along with the in-house subject matter experts’ opinions, has led us to the findings as described in the report.

Note: “Others” includes sales, marketing, and product managers
To know about the assumptions considered for the study, download the pdf brochure
Market Size Estimation
In the market engineering process, both top-down and bottom-up approaches, along with data triangulation methods, have been used to estimate and validate the size of the sustainability certification market and other dependent submarkets. The research methodology used to estimate the market sizes includes the following:
- Identifying top-line investments and spending in the ecosystem and considering segment-level splits and major market developments.
- Identifying different stakeholders in the sustainability certification market that influence the entire market, along with participants across the supply chain.
- Analyzing major certification providers in the sustainability certification market and studying their solutions.
- Analyzing trends related to the adoption of sustainability certification services and compliance solutions.
- Tracking recent and upcoming market developments, including R&D activities, service launches, expansions, acquisitions, partnerships, accreditations, and recognitions, as well as forecasting the market size based on these developments and other critical parameters.
- Carrying out multiple discussions with key opinion leaders to identify the adoption trends of sustainability certification programs across industries.
- Segmenting the overall market into various other market segments, considering certification types, industries, and regional trends.
- Validating the estimates at every level through discussions with key opinion leaders, such as chief executives (CXOs), directors, and operation managers, and finally with domain experts at MarketsandMarkets
Sustainability Certification Market : Top-Down and Bottom-Up Approach

Data Triangulation
After arriving at the overall market size by the market size estimation process explained in the earlier section, the overall sustainability certification market has been divided into several segments and subsegments. To complete the overall market engineering process and arrive at the exact statistics for all segments, the data triangulation and market breakdown procedures have been used, wherever applicable. The data has been triangulated by studying various factors and trends from both the demand and supply side perspectives. Along with data triangulation and market breakdown, the market has been validated by top-down and bottom-up approaches.
Market Definition
The sustainability certification market ensures compliance with environmental, social, and governance (ESG) requirements across industries. Driven by regulatory pressures, corporate sustainability goals, and consumer demand, the certifications allow companies to assure conformity with sustainability criteria. The major applications are energy & emissions management, mobility & transportation, infrastructure, and the circular economy. Certificates ensure compliance with renewable energy standards, carbon management, and EV battery standards with incentives for green building and sustainable supply chain practices. They also support circular economy activities like waste management and sustainable packaging. With more concern for climate action and business ESG reporting, the market will expand further. Digital verification, blockchain traceability, and AI-driven evaluations will enhance certification accuracy and authenticity. As industries compete to reach net-zero targets, sustainability certifications will become crucial in enabling open and ethical business operations globally.
Key Stakeholders
- Certification Bodies and Accreditation Agencies
- Auditing, Inspection, and Verification Service Providers
- Sustainability, ESG, and Compliance Consulting Firms
- Digital Platform Providers (SaaS/ESG Software and Tools)
- Training and Educational Institutions
- Regulatory Authorities, Standard-Setting Bodies, and Government Agencies
- Industry Associations and Non-Governmental Organizations (NGOs)
- Research and Development Institutes
- End-User Industries
Report Objectives
- To describe, segment, and forecast the size of the sustainability certification market, by application, vertical, sustainability focus, and region, in terms of value
- To define and describe the sustainability certification market based on certification function
- To forecast the market size for the application segment for hydrogen, in terms of volume
- To forecast the size of various segments for four regions: North America, Asia Pacific, Europe, and the Rest of the World (RoW), in terms of value
- To offer detailed information on drivers, restraints, opportunities, and challenges influencing the market growth
- To provide a detailed overview of the sustainability certification market value chain
- To strategically analyze the micromarkets concerning individual growth trends, prospects, and contributions to the overall market
- To study the impact of AI/Gen AI on the market under study, along with the macroeconomic outlook for each region
- To analyze opportunities for various stakeholders by identifying the high-growth segments of the market
- To benchmark the key players and analyze their market position in terms of revenue, market share, and core competencies, and detailed competitive landscape for the market leaders
- To analyze competitive developments such as service launches, expansions, acquisitions, partnerships, accreditations, and recognitions carried out by players in the sustainability certification market
Available Customizations
With the given market data, MarketsandMarkets offers customizations according to the specific requirements of companies. The following customization options are available for the report:
Country-wise Information:
- Country-wise breakdown for North America, Europe, Asia Pacific, and Rest of the World
Company Information:
- Detailed analysis and profiling of additional market players (up to five)
Key Questions Addressed by the Report
What is the current market size of the global Sustainability Certification market?
The global Sustainability Certification market was valued at USD 3.10 billion in 2025. Increasing demand for verified sustainability practices, ESG compliance, ethical sourcing, and environmental transparency is driving market growth. (MarketsandMarkets)
What is the forecasted size of the Sustainability Certification market by 2030?
The Sustainability Certification market is projected to reach USD 4.25 billion by 2030, growing from USD 3.10 billion in 2025. (MarketsandMarkets)
What is the expected CAGR of the Sustainability Certification market during 2025–2030?
The market is expected to grow at a CAGR of 6.5% from 2025 to 2030, supported by increasing regulatory requirements, sustainability reporting, and corporate net-zero commitments. (MarketsandMarkets)
What are the major growth drivers for the Sustainability Certification industry?
Key growth drivers include rising demand for verified environmental performance, ESG compliance, sustainable supply chains, carbon footprint reduction, renewable energy adoption, green buildings, and circular economy initiatives. (MarketsandMarkets)
What are the key trends shaping the Sustainability Certification market?
Major trends include digital traceability platforms, AI-enabled certification processes, blockchain-based verification, carbon management solutions, renewable energy certifications, EV battery sustainability certifications, and automated ESG reporting tools. (MarketsandMarkets)
Which companies are the leading players in the Sustainability Certification market?
Major companies operating in the market include Société Générale de Surveillance SA (SGS SA), UL LLC, TÜV SÜD, TÜV Rheinland, Bureau Veritas, DEKRA, Intertek Group plc, DNV, Element Materials Technology, and LRQA Group Limited. (MarketsandMarkets)
Which industries are driving demand for Sustainability Certification solutions?
Major industries adopting sustainability certifications include industrial manufacturing, energy & power, construction, mobility & transportation, automotive, consumer goods, agriculture, food & beverage, and commercial sectors. (MarketsandMarkets)
Which application segment is expected to dominate the Sustainability Certification market?
Energy & emissions management is expected to hold the largest market share due to increasing adoption of renewable energy certifications, carbon management programs, greenhouse gas reporting, and emission reduction initiatives. (MarketsandMarkets)
Which industry vertical is expected to lead the Sustainability Certification market?
The industrial segment is expected to account for the largest share and register strong growth due to increasing sustainability requirements, regulatory compliance needs, sustainable manufacturing practices, and ESG alignment. (MarketsandMarkets)
Which region is expected to grow fastest in the Sustainability Certification market?
Asia Pacific is expected to register the fastest growth during the forecast period, driven by rapid industrialization, stricter sustainability regulations, renewable energy investments, green infrastructure development, and increasing ESG adoption in countries such as China and India. (MarketsandMarkets)
Need a Tailored Report?
Customize this report to your needs
Get 10% FREE Customization
Customize This ReportPersonalize This Research
- Triangulate with your Own Data
- Get Data as per your Format and Definition
- Gain a Deeper Dive on a Specific Application, Geography, Customer or Competitor
- Any level of Personalization
Let Us Help You
- What are the Known and Unknown Adjacencies Impacting the Sustainability Certification Market
- What will your New Revenue Sources be?
- Who will be your Top Customer; what will make them switch?
- Defend your Market Share or Win Competitors
- Get a Scorecard for Target Partners

Custom Market Research Services
We Will Customise The Research For You, In Case The Report Listed Above Does Not Meet With Your Requirements
Get 10% Free CustomisationTESTIMONIALS

Tetsuya Ohhira
Business Development Manager-Technology Business
Nikon Corporation,
Leading Japanese MNC specializing in optics and imaging productswww.nikon.com
MarketsandMarkets™ response
is quick. Their attitude is flexible and positive. Analyst Insights are globally considered and
significant. Client Services quickly respond to our inquiry and demand. Their wide range of global
surveys help us make our strategic plan.
We hope Knowledge Store will be easier to search
for a report.
VP - Marketing & Business Development
Leading Provider of Process Control Solutions
We engaged with MarketsandMarkets on a study to perform an analysis and recommend a Go-To-Market strategy for metrology and process control in the semiconductor market. The study was tailored to our targets and needs with well-defined milestones. Our overall experience with the MarketsandMarkets team was very good throughout the project in all aspects including the analysis methodologies used, the quality and depth of primary and secondary data sets, the professionalism and flexibility of the team and the ability to meet the target schedule and milestones. We want to thank MarketsandMarkets team for a job well done.
Growth opportunities and latent adjacency in Sustainability Certification Market


Samuel
Apr, 2026
Does the report break down the market by industry sectors, such as manufacturing, agriculture, and services?.
Alfred
Apr, 2026
Are leading players in the sustainability certification market profiled with their revenue, strategies, and market share?.