Sustainable Fuel Market

Sustainable Fuel Market by Type (Renewable Fuels, Low Carbon Fossil Fuels), Fuel Type (Biofuels, E-Fuels, Hydrogen, Biomethane, CNG), End User (Road transportation, Marine, Aviation), State (Liquid, Gas) and Region - Global Forecast to 2029

Report Code: EP 9028 May, 2024, by marketsandmarkets.com

[341 Pages Report] The global sustainable fuel market in terms of revenue was estimated to be worth $193.8 billion in 2024 and is poised to reach $299.9 billion by 2029, growing at a CAGR of 9.1% from 2024 to 2029. Rising concerns about climate change, stringent government regulations to reduce carbon emissions and reduced dependency on fossil fuels are few of the factors accelerating the growth of sustainable fuel market.

Sustainable Fuel Market

To know about the assumptions considered for the study, Request for Free Sample Report

Sustainable Fuel Market Opportunities

To know about the assumptions considered for the study, download the pdf brochure

Sustainable Fuel Market Dynamics

Driver: Growing environmental concerns associated with conventional fuels

Most transportation relies heavily on conventional fuels like gasoline and diesel, which when burned, emit carbon dioxide, a significant greenhouse gas, into the atmosphere, contributing to environmental issues. According to the United Nations Environment Programme (UNEP), the transportation sector accounts for approximately one-quarter of all greenhouse gas (GHG) emissions related to energy. Also, carbon dioxide emissions directly resulting from fossil fuel combustion in the road sector increased by 200 million metric tons from 2015 to 2022 According to the International Energy Agency (IEA). To meet the IEA Net Zero Emissions by 2050 Scenario (NZE Scenario), emissions must decrease by about one-third by 2030. Many countries are actively working to reduce their greenhouse gas emissions, necessitating a shift towards cleaner energy sources.

Sustainable fuels, such as low-carbon and renewable fuels, are crucial in transitioning to sustainable transportation. According to the World Economic Forum, Sustainable Aviation Fuel (SAF) made from renewable biomass and waste resources will play a significant role in achieving net zero emission goals. Additionally, hydrogen, biofuels, and renewable natural gas (RNG) have the potential to reduce emissions from the transportation sector.

Restraint: Requirement of high initial capital investment

The high initial investment acts as one of the major barriers to the adoption of sustainable fuels. The cost of building and operating biofuel, biomethane, e-fuels, and hydrogen plants is significant, making it difficult for these fuels to compete with fossil fuels. The investment encompasses costs associated with the installation of biorefineries, procurement, testing, maintenance, and feedstock. Sustainable fuel production is a capital-intensive endeavor, relying on advanced technologies with limited prior experience and insufficient historical data. The energy-intensive processes involved necessitate specialized energy production systems for co-generating heat or electricity. These factors contribute to the high expense and perceived undesirability of investing in sustainable fuels.

Opportunities: Transitioning towards renewable energy

Global economies' efforts to diminish their carbon footprint and greenhouse gas emissions have spurred the adoption of clean and sustainable energy alternatives. The increasing energy demand driven by rapid industrialization and urbanization has further hastened the shift towards renewable energy sources. This transition has prompted economies to utilize renewable energy sources such as biomass, hydroelectric, and geothermal power. For instance, vehicles can utilize biofuels like ethanol and biodiesel, derived from renewable biomass sources such as corn, sugarcane, and soybeans. Similarly, hydrogen fuel cells can use green hydrogen, another renewable energy source.

According to the International Energy Agency (IEA), biofuels and renewable electricity could reduce oil demand in the transportation sector by nearly 4 million barrels of oil equivalent per day by 2028. This reduction would help to limit the global carbon footprint and greenhouse gas emissions.

Challenges: Limited commercial availability of sustainable fuel powered vehicles

Sustainable fuels such as e-fuels, biofuels, biomethane, and hydrogen play a pivotal role in reducing carbon emissions whereas one of the major challenges faced by these fuels is their limited infrastructure. Hydrogen powered vehicles are still in their early stage of commercialization. According to the International Energy Agency’s (IEA) new Global EV Outlook 2023 report, there are approximately 72,000 Fuel Cell Electric Vehicle (FCEV) in the world as of 2022. The developing countries such as India, Brazil are still in its early stages of development.

Various countries like US, Brazil, UK, and other countries are focusing on flex fuel vehicles, which have the capability to function using gasoline or any combination of gasoline and ethanol, with blends reaching up to 83% whereas, 100% biofuel powered vehicles are still in its early stages of development. For instance, in August 2023, India has introduced world’s first electrified flex-fuel vehicle which can run on 100% ethanol. Also, the maritime sector is adopting hydrogen to reduce its emissions, but it is still in its early stages of development.

Sustainable Fuel Market Ecosystem

In this market, leading companies emerge as established and financially robust suppliers of sustainable fuels. With extensive experience, these firms offer a diverse product range, advanced technologies, and strong global sales and marketing networks. Their track record in the industry makes them dependable partners for customers seeking sustainable fuel solutions. These companies have shown agility in responding to market changes and consistently delivering top-quality products and services, establishing themselves as leaders in meeting the needs of the oil and gas sector. Prominent companies in this market include ADM (US), Shell plc (UK), Saudi Arabian Oil Co. (Saudi Arabia), Siemens Energy (Germany) and Chevron Corporation (US).

Top Companies in Sustainable Fuel Market

The e-fuels segment, by fuel type, is expected to be the fastest growing during the forecast period.

This report segments the sustainable fuel market based on fuel type into different types: biofuels, e-fuels, hydrogen, biomethane and compressed natural gas (CNG). The e-fuels segment is expected to be the fastest market during the forecast period. E-fuels are hailed as a sustainable and environmentally friendly alternative to conventional fuels, which are typically derived from fossil fuels. E-fuels are gaining prominence owing to the increasing government initiatives for cleaner fuel and achieving the goal of net-zero emissions.

By end user, marine is expected to be the fastest growing during the forecast period.

This report segments the sustainable fuel market based on phase into three segments: road transportation, marine, and aviation. The marine segment is expected to be the fastest growing during the forecast period. According to United Nations (UN), around 80% of global trade relies on maritime shipping, contributing to nearly 3% of total global greenhouse gas emissions. Achieving zero CO2 emissions from ships by 2050 is essential in combating climate change; therefore, various organizations and countries are setting different standards and policies. Enforcement of strict regulations to curb emissions in maritime drives the growth of sustainable fuels.

“North America: The largest region in the sustainable fuel market.”

North America is expected to be the largest region in the sustainable fuel market between 2024–2029, followed by Asia Pacific and Europe. North America has been leading the sustainable fuel market. Urbanization and population growth have resulted in the need for vast infrastructure development, which has propelled the energy demand across the region. The growth is driven by the enforcement of stringent pollution control regulations, efforts to reduce greenhouse gas emissions, and a growing preference for low-carbon and renewable energy alternatives. Reflecting the global trend towards sustainable fuels, investments in North America are on the rise. These increased investments in sustainable fuels are expected to bolster market growth in the region during the forecast period. The regional sustainable fuel market is experiencing growth due to the presence of leading sustainable fuel providers like ADM (US), INFINIUM (US) and Air Products and Chemicals, Inc. (US) also contribute to the market's development by creating opportunities for sustainable fuel projects.

North American Sustainable Fuel Market Size, and Share

Key Market Players

The sustainable fuel market is dominated by a few major players that have a wide regional presence. The major players in the sustainable fuel market include ADM (US), Shell plc (UK), Saudi Arabian Oil Co. (Saudi Arabia), Siemens Energy (Germany) and Chevron Corporation (US). Between 2019 and 2024, Strategies such as new product launches, contracts, agreements, acquisitions, and expansions are followed by these companies to capture a larger share of the sustainable fuel market.

Get online access to the report on the World's First Market Intelligence Cloud

  • Easy to Download Historical Data & Forecast Numbers
  • Company Analysis Dashboard for high growth potential opportunities
  • Research Analyst Access for customization & queries
  • Competitor Analysis with Interactive dashboard
  • Latest News, Updates & Trend analysis
Request Sample

Scope of the Report

Report Metric

Details

Market size available for years

2019–2029

Base year considered

2023

Forecast period

2024–2029

Forecast units

Value (USD Million)

Segments Covered

Sustainable Fuel Market by Fuel Type, state, type, end user, and Region.

Geographies covered

North America, Europe, Asia Pacific, Middle East & Africa, and South America.  

Companies covered

Shell plc(UK), Chevron Corporation(US), Air Liquide (France), Saudi Arabian oil Co. (Saudi Arabia), AUDI AG (Germany), Siemens Energy (Germany), Gasum Ltd (Finland), Linde PLC (Ireland), Air Products and Chemicals, Inc. (US), Electrochaea GmbH (Germany), ADM (US), Valero (US), Neste (Finland), Cargill, Incorporated (US), Nature Energy (Denmark), Archaea Energy Inc.(US),  OPAL Fuels (US), Repsol (Spain), ENGIE (France), TotalEnergies (France), Uniper SE (Germany), Orsted A/S (Denmark), MAN Energy Solutions (Germany), Verbio SE (Germany), Kinder Morgan (US), E.ON SE (Germany), Messer Group (Germany), Equinor ASA (Norway), Dr. Ing. h.c. F. Porsche AG (Germany), MITSUBISHI MOTORS CORPORATION (Japan), Green Plains Inc. (US), POET, LLC (US), Wilmar International Ltd (Singapore), The Andersons, Inc. (US), EnviTec Biogas AG (Germany), Future Biogas Limited (Canada), Waga Energy (France), INFINIUM (US), Indian Oil Corporation Ltd (India), CNPC (China), BP p.l.c. (England), ConocoPhillips Company (US),

This research report categorizes the sustainable fuel market based on fuel type, state, type, end user, and region.

On the basis of fuel type:
  • Biofuels
  • E-fuels
  • Hydrogen
  • Biomethane
  • Compressed Natural Gas (CNG)
On the basis of state:
  • Liquid
  • Gas
On the basis of type:
  • Renewable Fuels
  • Low carbon Fossil Fuels
On the basis of end user:
  • Road Transportation
  • Aviation
  • Marine
On the basis of region:
  • North America
  • Europe
  • Asia Pacific
  • Middle East & Africa
  • South America

Recent Developments

  • In May 2024, TotalEnergies and SINOPEC have been working together for many years, notably in Angola and Brazil in Upstream operations, and more generally in various domains such as oil, LNG, oil product trading, and engineering. Recently, the companies have joined forces to develop a 230,000 tons per year sustainable aviation fuel (SAF) production unit at a SINOPEC refinery in China.
  • In March 2024, Gasum and the Norwegian Road Transport Association (NLF) signed a collaboration agreement to promote biogas as one of various green energy sources for the green transition. This will be accomplished by promoting biogas as a viable alternative to fossil fuels.
  • In September 2023, OPAL Fuels signed a joint venture with South Jersey Industries, an energy infrastructure holding company, to develop, construct, own, and operate RNG facilities.
  • In April 2023, Air Products and Chemicals, Inc. signed an agreement with Edmonton International Airport as the hydrogen and technology provider for Alberta’s first hydrogen fuel cell passenger vehicle fleet.
  • In October 2022, Air Liquide, Chevron Corporation, LyondellBasell, a global chemical and plastic company, and Uniper SE intended to work on a collective study to assess and progress the creation of a hydrogen and ammonia production facility along the US Gulf Coast.

Frequently Asked Questions (FAQ):

To speak to our analyst for a discussion on the above findings, click Speak to Analyst

TABLE OF CONTENTS
 
1 INTRODUCTION (Page No. - 41)
    1.1 STUDY OBJECTIVES 
    1.2 MARKET DEFINITION 
    1.3 STUDY SCOPE 
           1.3.1 INCLUSIONS AND EXCLUSIONS
           1.3.2 MARKETS COVERED
                    FIGURE 1 SUSTAINABLE FUEL MARKET: SEGMENTATION
           1.3.3 REGIONS COVERED
           1.3.4 YEARS CONSIDERED
    1.4 CURRENCY CONSIDERED 
    1.5 UNITS CONSIDERED 
    1.6 RESEARCH LIMITATIONS 
    1.7 STAKEHOLDERS 
    1.8 RECESSION IMPACT 
 
2 RESEARCH METHODOLOGY (Page No. - 46)
    2.1 RESEARCH DATA 
           FIGURE 2 SUSTAINABLE FUEL MARKET: RESEARCH DESIGN
           2.1.1 SECONDARY DATA
                    2.1.1.1 List of major secondary sources
                    2.1.1.2 Key data from secondary sources
           2.1.2 PRIMARY DATA
                    2.1.2.1 List of key primary interview participants
                    2.1.2.2 Key data from primary sources
                    2.1.2.3 Key industry insights
                    2.1.2.4 Breakdown of primaries
    2.2 MARKET SIZE ESTIMATION 
           2.2.1 BOTTOM-UP APPROACH
                    FIGURE 3 MARKET SIZE ESTIMATION METHODOLOGY: BOTTOM-UP APPROACH
           2.2.2 TOP-DOWN APPROACH
                    FIGURE 4 MARKET SIZE ESTIMATION METHODOLOGY: TOP-DOWN APPROACH
    2.3 DEMAND-SIDE ANALYSIS 
           2.3.1 DEMAND-SIDE METRICS
                    FIGURE 5 KEY METRICS CONSIDERED TO ASSESS DEMAND FOR SUSTAINABLE FUELS
                    2.3.1.1 Assumptions for demand-side analysis
                    2.3.1.2 Calculations for demand-side analysis
    2.4 SUPPLY-SIDE ANALYSIS 
           2.4.1 SUPPLY-SIDE METRICS
                    FIGURE 6 KEY METRICS CONSIDERED TO ASSESS SUPPLY OF SUSTAINABLE FUELS
                    FIGURE 7 SUSTAINABLE FUEL MARKET: SUPPLY-SIDE ANALYSIS
                    2.4.1.1 Assumptions for supply-side analysis
                    2.4.1.2 Calculations for supply-side analysis
    2.5 DATA TRIANGULATION 
           FIGURE 8 SUSTAINABLE FUEL MARKET: DATA TRIANGULATION
    2.6 GROWTH FORECAST 
    2.7 RISK ASSESSMENT 
    2.8 IMPACT OF RECESSION 
 
3 EXECUTIVE SUMMARY (Page No. - 58)
    TABLE 1 SUSTAINABLE FUEL MARKET SNAPSHOT 
    FIGURE 9 RENEWABLE FUELS SEGMENT TO DOMINATE MARKET DURING FORECAST PERIOD 
    FIGURE 10 BIOFUELS SEGMENT TO ACCOUNT FOR LARGEST MARKET SHARE IN 2029 
    FIGURE 11 LIQUID SEGMENT TO LEAD MARKET DURING FORECAST PERIOD 
    FIGURE 12 ROAD TRANSPORTATION SEGMENT TO ACCOUNT FOR LARGEST SHARE IN 2029 
    FIGURE 13 NORTH AMERICA HELD LARGEST SHARE OF SUSTAINABLE FUEL MARKET  IN 2023 
 
4 PREMIUM INSIGHTS (Page No. - 63)
    4.1 ATTRACTIVE OPPORTUNITIES FOR PLAYERS IN SUSTAINABLE  FUEL MARKET 
           FIGURE 14 INCREASE IN DEMAND FOR CLEAN ENERGY AND GOVERNMENT POLICIES  TO DRIVE MARKET DURING FORECAST PERIOD
    4.2 MARKET, BY REGION 
           FIGURE 15 ASIA PACIFIC TO WITNESS FASTEST GROWTH DURING FORECAST PERIOD
    4.3 MARKET, BY TYPE 
           FIGURE 16 RENEWABLE FUELS SEGMENT DOMINATED MARKET IN 2023
    4.4 MARKET, BY FUEL TYPE 
           FIGURE 17 BIOFUELS SEGMENT HELD LARGEST MARKET SHARE IN 2023
    4.5 MARKET, BY STATE 
           FIGURE 18 LIQUID SEGMENT ACCOUNTED FOR LARGER SHARE OF MARKET IN 2023
    4.6 MARKET, BY END USER 
           FIGURE 19 ROAD TRANSPORTATION SEGMENT DOMINATED MARKET IN 2023
    4.7 MARKET IN NORTH AMERICA, BY END USER AND COUNTRY 
           FIGURE 20 ROAD TRANSPORTATION AND US LED MARKET IN NORTH AMERICA IN 2023
 
5 MARKET OVERVIEW (Page No. - 66)
    5.1 INTRODUCTION 
    5.2 MARKET DYNAMICS 
           FIGURE 21 SUSTAINABLE FUEL MARKET: DRIVERS, RESTRAINTS, OPPORTUNITIES, AND CHALLENGES
           5.2.1 DRIVERS
                    5.2.1.1 Growing environmental concerns associated with conventional fuels
                               FIGURE 22 CARBON EMISSION DURING TRANSPORTATION, 2015–2022, 2030
                    5.2.1.2 Favorable government policies to reduce greenhouse emissions
                    5.2.1.3 Rising adoption of low-emission fuels
           5.2.2 RESTRAINTS
                    5.2.2.1 Requirement of high initial capital investment
                    5.2.2.2 Growing competition from alternative fuels
           5.2.3 OPPORTUNITIES
                    5.2.3.1 High depletion rate of fossil fuels
                    5.2.3.2 Transition toward renewable energy
                               FIGURE 23 RENEWABLE ENERGY CAPACITY ADDITIONS BY COUNTRY/REGION, 2019–2022
           5.2.4 CHALLENGES
                    5.2.4.1 Limited commercial availability of hydrogen and biofuel-powered vehicles
    5.3 TRENDS/DISRUPTIONS IMPACTING CUSTOMER BUSINESS 
           FIGURE 24 TRENDS/DISRUPTIONS IMPACTING CUSTOMER BUSINESS
    5.4 SUPPLY CHAIN ANALYSIS 
           FIGURE 25 SUSTAINABLE FUEL MARKET: SUPPLY CHAIN ANALYSIS
           5.4.1 RAW MATERIAL SUPPLIERS/TECHNOLOGY & EPC PROVIDERS
           5.4.2 SUSTAINABLE FUEL PRODUCERS/SUPPLIERS
           5.4.3 END USERS
    5.5 ECOSYSTEM/MARKET MAP 
           FIGURE 26 SUSTAINABLE FUEL MARKET MAP
           TABLE 2 ROLE OF PLAYERS IN SUSTAINABLE FUEL MARKET ECOSYSTEM
           FIGURE 27 ECOSYSTEM ANALYSIS
    5.6 CASE STUDY ANALYSIS 
           5.6.1 PRIO HELPED CARRIS ACHIEVE SUSTAINABLE MOBILITY IN URBAN SETTING
           5.6.2 CROWN IRON WORKS (CIW) INTRODUCED RD-READY PRETREATMENT SYSTEM TO INCREASE BIODIESEL PRODUCTION EFFICIENCY
           5.6.3 ENVIROGAS RNG PROJECT CAPTURED SIGNIFICANT AMOUNT OF METHANE
    5.7 INVESTMENT AND FUNDING SCENARIO 
           FIGURE 28 INVESTMENT AND FUNDING SCENARIO
    5.8 TECHNOLOGY ANALYSIS 
           5.8.1 KEY TECHNOLOGY
                    5.8.1.1 Biogas transformation to biomethane
                    5.8.1.2 Electrolysis for hydrogen production
           5.8.2 COMPLEMENTARY TECHNOLOGY
                    5.8.2.1 Material-based hydrogen storage
                    5.8.2.2 Machine learning
           5.8.3 ADJACENT TECHNOLOGY
                    5.8.3.1 Carbon capture, utilization, and storage
                    5.8.3.2 Fuel cell
    5.9 TRADE ANALYSIS 
           5.9.1 E-FUELS
                    5.9.1.1 Import scenario
                               TABLE 3 IMPORT DATA FOR HS CODE 2814-COMPLIANT PRODUCTS, BY COUNTRY,  2021–2023 (USD THOUSAND)
                               FIGURE 29 HS CODE 2814: IMPORT DATA FOR TOP FIVE COUNTRIES, 2021–2023
                    5.9.1.2 Export scenario
                               TABLE 4 EXPORT DATA FOR HS CODE 2814-COMPLIANT PRODUCTS, BY COUNTRY,  2021–2023 (USD THOUSAND)
                               FIGURE 30 HS CODE 2814: EXPORT DATA FOR TOP FIVE COUNTRIES, 2021–2023
           5.9.2 BIOFUELS
                    5.9.2.1 Import scenario
                               TABLE 5 IMPORT DATA FOR HS CODE 3826-COMPLIANT PRODUCTS, BY COUNTRY,  2020–2023 (USD THOUSAND)
                               FIGURE 31 HS CODE 3826: IMPORT DATA FOR TOP FIVE COUNTRIES,  2021–2023 (USD THOUSAND)
                    5.9.2.2 Export scenario
                               TABLE 6 EXPORT DATA FOR HS CODE 3826-COMPLIANT PRODUCTS, BY COUNTRY,  2021–2023 (USD THOUSAND)
                               FIGURE 32 HS CODE 3826: EXPORT DATA FOR TOP FIVE COUNTRIES,  2021–2023 (USD THOUSAND)
           5.9.3 HYDROGEN
                    5.9.3.1 Import scenario
                               TABLE 7 IMPORT DATA FOR HS CODE 280410-COMPLIANT PRODUCTS, BY COUNTRY,  2021–2023 (USD THOUSAND)
                               FIGURE 33 HS CODE 280410: IMPORT DATA FOR TOP FIVE COUNTRIES,  2020–2022 (USD THOUSAND)
                    5.9.3.2 Export scenario
                               TABLE 8 EXPORT DATA FOR HS CODE 280410-COMPLIANT PRODUCTS, BY COUNTRY,  2021–2023 (USD THOUSAND)
                               FIGURE 34 HS CODE 280410: EXPORT DATA FOR TOP FIVE COUNTRIES,  2020–2023 (USD THOUSAND)
           5.9.4 BIOMETHANE
                    5.9.4.1 Import scenario
                    TABLE 9 IMPORT DATA FOR HS CODE 271111-COMPLIANT PRODUCTS, BY COUNTRY, 2021–2023 (USD THOUSAND)
                               FIGURE 35 HS CODE 271111: IMPORT DATA FOR TOP FIVE COUNTRIES,  2020–2023 (USD THOUSAND)
                    5.9.4.2 Export scenario
                               TABLE 10 EXPORT DATA FOR HS CODE 271111-COMPLIANT PRODUCTS, BY COUNTRY, 2021–2023 (USD THOUSAND)
                               FIGURE 36 HS CODE 271111: EXPORT DATA FOR TOP FIVE COUNTRIES,  2020–2023 (USD THOUSAND)
    5.1 PATENT ANALYSIS 
           5.10.1 HYDROGEN
                    FIGURE 37 HYDROGEN: INNOVATIONS AND PATENT REGISTRATIONS, 2013–2023
                    5.10.1.1 List of major patents
                               TABLE 11 HYDROGEN: LIST OF MAJOR PATENTS, 2019–2023
           5.10.2 E-FUELS
                    FIGURE 38 E-FUELS: INNOVATIONS AND PATENT REGISTRATIONS, 2013–2023
                    5.10.2.1 List of major patents
                               TABLE 12 E-FUELS: LIST OF MAJOR PATENTS, 2019–2023
           5.10.3 BIOFUELS
                    FIGURE 39 BIOFUELS: INNOVATIONS AND PATENT REGISTRATIONS, 2013–2023
                    5.10.3.1 List of major patents
                               TABLE 13 BIOFUELS: LIST OF MAJOR PATENTS, 2019–2023
           5.10.4 BIOMETHANE
                    FIGURE 40 BIOMETHANE: INNOVATIONS AND PATENT REGISTRATIONS, 2013–2023
                    5.10.4.1 List of major patents
                               TABLE 14 BIOMETHANE: LIST OF MAJOR PATENTS, 2019–2023
    5.11 KEY CONFERENCES AND EVENTS IN 2024–2025 
                    TABLE 15 SUSTAINABLE FUEL MARKET: KEY CONFERENCES AND EVENTS, 2024–2025
    5.12 PRICING ANALYSIS 
           5.12.1 INDICATIVE PRICING ANALYSIS, BY FUEL TYPE
                    TABLE 16 INDICATIVE PRICING ANALYSIS, BY FUEL TYPE (USD/KG)
           5.12.2 AVERAGE SELLING PRICE TREND, BY REGION
                    TABLE 17 AVERAGE SELLING PRICE TREND, BY REGION (USD/KG)
    5.13 REGULATORY LANDSCAPE 
           5.13.1 REGULATORY BODIES, GOVERNMENT AGENCIES, AND OTHER ORGANIZATIONS
                    TABLE 18 ASIA PACIFIC: REGULATORY BODIES, GOVERNMENT AGENCIES,  AND OTHER ORGANIZATIONS
                    TABLE 19 NORTH AMERICA: REGULATORY BODIES, GOVERNMENT AGENCIES, AND OTHER ORGANIZATIONS
                    TABLE 20 EUROPE: REGULATORY BODIES, GOVERNMENT AGENCIES, AND OTHER ORGANIZATIONS
                    TABLE 21 MIDDLE EAST & AFRICA: REGULATORY BODIES, GOVERNMENT AGENCIES, AND OTHER ORGANIZATIONS
                    TABLE 22 SOUTH AMERICA: REGULATORY BODIES, GOVERNMENT AGENCIES, AND OTHER ORGANIZATIONS
           5.13.2 SUSTAINABLE FUEL MARKET: REGULATORY FRAMEWORK
                    TABLE 23 MARKET: REGULATIONS
    5.14 PORTER’S FIVE FORCES ANALYSIS 
                    FIGURE 41 MARKET: PORTER’S FIVE FORCES ANALYSIS
                    TABLE 24 MARKET: PORTER’S FIVE FORCES ANALYSIS
           5.14.1 THREAT OF NEW ENTRANTS
           5.14.2 THREAT OF SUBSTITUTES
           5.14.3 BARGAINING POWER OF SUPPLIERS
           5.14.4 BARGAINING POWER OF BUYERS
           5.14.5 INTENSITY OF COMPETITIVE RIVALRY
    5.15 KEY STAKEHOLDERS AND BUYING CRITERIA 
           5.15.1 KEY STAKEHOLDERS IN BUYING PROCESS
                    FIGURE 42 INFLUENCE OF KEY STAKEHOLDERS ON BUYING PROCESS, BY END USER
                    TABLE 25 INFLUENCE OF STAKEHOLDERS ON BUYING PROCESS, BY END USER (%)
           5.15.2 BUYING CRITERIA
                    FIGURE 43 KEY BUYING CRITERIA, BY END USER
                    TABLE 26 KEY BUYING CRITERIA, BY END USER
 
6 SUSTAINABLE FUEL MARKET, BY TYPE (Page No. - 114)
    6.1 INTRODUCTION 
           FIGURE 44 MARKET SHARE, BY TYPE, 2023 (%)
           TABLE 27 MARKET, BY TYPE, 2019–2023 (USD MILLION)
           TABLE 28 MARKET, BY TYPE, 2024–2029 (USD MILLION)
    6.2 RENEWABLE FUELS 
           6.2.1 TRANSITIONING TOWARD RENEWABLE ENERGY TO DRIVE DEMAND
                    TABLE 29 RENEWABLE FUELS: MARKET, BY TYPE, 2019–2023 (USD MILLION)
                    TABLE 30 RENEWABLE FUELS: MARKET, BY TYPE, 2024–2029 (USD MILLION)
    6.3 LOW-CARBON FOSSIL FUELS 
           6.3.1 DEMAND FOR COST-EFFECTIVE TRANSPORTATION FUEL TO DRIVE MARKET
                    TABLE 31 LOW-CARBON FOSSIL FUELS: MARKET, BY TYPE,  2019–2023 (USD MILLION)
                    TABLE 32 LOW-CARBON FOSSIL FUELS: MARKET, BY TYPE,  2024–2029 (USD MILLION)
 
7 SUSTAINABLE FUEL MARKET, BY FUEL TYPE (Page No. - 118)
    7.1 INTRODUCTION 
           FIGURE 45 MARKET SHARE, BY FUEL TYPE, 2023 (%)
           TABLE 33 MARKET, BY FUEL TYPE, 2019–2023 (MILLION TONS)
           TABLE 34 MARKET, BY FUEL TYPE, 2024–2029 (MILLION TONS)
           TABLE 35 MARKET, BY FUEL TYPE, 2019–2023 (USD MILLION)
           TABLE 36 MARKET, BY FUEL TYPE, 2024–2029 (USD MILLION)
    7.2 E-FUELS 
           7.2.1 CLEAN ENERGY INITIATIVES BY GOVERNMENTS TO DRIVE DEMAND
                    TABLE 37 E-FUELS: MARKET, BY E-FUELS TYPE, 2019–2023 (USD MILLION)
                    TABLE 38 E-FUELS: MARKET, BY E-FUELS TYPE, 2024–2029 (USD MILLION)
                    TABLE 39 E-FUELS: MARKET, BY REGION, 2019–2023 (USD MILLION)
                    TABLE 40 E-FUELS: MARKET, BY REGION, 2024–2029 (USD MILLION)
                    7.2.1.1 E-Methane
                    7.2.1.2 E-Methanol
                    7.2.1.3 E-Ammonia
                    7.2.1.4 E-Gasoline
                    7.2.1.5 E-Kerosene
                    7.2.1.6 E-Diesel
    7.3 BIOFUELS 
           7.3.1 MANDATES, TAX CREDITS, AND INVESTMENTS TO DRIVE MARKET
                    TABLE 41 BIOFUELS: MARKET, BY BIOFUELS TYPE, 2019–2023 (USD MILLION)
                    TABLE 42 BIOFUELS: MARKET, BY BIOFUELS TYPE, 2024–2029 (USD MILLION)
                    TABLE 43 BIOFUELS: MARKET, BY REGION, 2019–2023 (USD MILLION)
                    TABLE 44 BIOFUELS: MARKET, BY REGION, 2024–2029 (USD MILLION)
                    7.3.1.1 Ethanol
                    7.3.1.2 Biodiesel
                    7.3.1.3 Renewable diesel
                    7.3.1.4 Biojet
    7.4 HYDROGEN 
           7.4.1 STRICT REGULATIONS ON CURBING EMISSIONS TO DRIVE MARKET
                    TABLE 45 HYDROGEN: MARKET, BY HYDROGEN TYPE,  2019–2023 (USD MILLION)
                    TABLE 46 HYDROGEN: MARKET, BY HYDROGEN TYPE,  2024–2029 (USD MILLION)
                    TABLE 47 HYDROGEN: MARKET, BY REGION, 2019–2023 (USD MILLION)
                    TABLE 48 HYDROGEN: MARKET, BY REGION, 2024–2029 (USD MILLION)
                    7.4.1.1 Blue hydrogen
                    7.4.1.2 Green hydrogen
    7.5 BIOMETHANE 
           7.5.1 GROWING FOCUS ON RENEWABLE ENERGY TO DRIVE MARKET
                    TABLE 49 BIOMETHANE: MARKET, BY REGION, 2019–2023 (USD MILLION)
                    TABLE 50 BIOMETHANE: MARKET, BY REGION, 2024–2029 (USD MILLION)
    7.6 COMPRESSED NATURAL GAS 
           7.6.1 GROWING DEMAND FOR COST-EFFECTIVE FUEL TO DRIVE MARKET
                    TABLE 51 COMPRESSED NATURAL GAS: MARKET, BY REGION,  2019–2023 (USD MILLION)
                    TABLE 52 COMPRESSED NATURAL GAS: MARKET, BY REGION,  2024–2029 (USD MILLION)
 
8 SUSTAINABLE FUEL MARKET, BY STATE (Page No. - 131)
    8.1 INTRODUCTION 
           FIGURE 46 MARKET SHARE, BY STATE, 2023 (%)
           TABLE 53 MARKET, BY STATE, 2019–2023 (USD MILLION)
           TABLE 54 MARKET, BY STATE, 2024–2029 (USD MILLION)
    8.2 LIQUID 
           8.2.1 HIGH ENERGY DENSITY OF LIQUID FUELS TO DRIVE DEMAND
                    TABLE 55 LIQUID: MARKET, BY REGION, 2019–2023 (USD MILLION)
                    TABLE 56 LIQUID: MARKET, BY REGION, 2024–2029 (USD MILLION)
    8.3 GAS 
           8.3.1 CONTRIBUTION OF GAS IN ENERGY SECURITY TO DRIVE MARKET
                    TABLE 57 GAS: MARKET, BY REGION, 2019–2023 (USD MILLION)
                    TABLE 58 GAS: MARKET, BY REGION, 2024–2029 (USD MILLION)
 
9 SUSTAINABLE FUEL MARKET, BY END USER (Page No. - 135)
    9.1 INTRODUCTION 
           FIGURE 47 MARKET SHARE, BY END USER, 2023 (%)
           TABLE 59 MARKET, BY END USER, 2019–2023 (USD MILLION)
           TABLE 60 MARKET, BY END USER, 2024–2029 (USD MILLION)
    9.2 ROAD TRANSPORTATION 
           9.2.1 COMPATIBILITY OF SUSTAINABLE FUELS WITH EXISTING ENGINES AND INFRASTRUCTURE TO DRIVE MARKET
                    TABLE 61 ROAD TRANSPORTATION: MARKET, BY REGION,  2019–2023 (USD MILLION)
                    TABLE 62 ROAD TRANSPORTATION: MARKET, BY REGION,  2024–2029 (USD MILLION)
                    9.2.1.1 Two- and three-wheelers
                    9.2.1.2 Passenger cars
                    9.2.1.3 Commercial/Heavy-duty vehicles
    9.3 AVIATION 
           9.3.1 TRANSITION TO NET-ZERO EMISSION SUPPORTED BY SHIFT TOWARD SUSTAINABLE FUELS
                    TABLE 63 AVIATION: MARKET, BY REGION, 2019–2023 (USD MILLION)
                    TABLE 64 AVIATION: MARKET, BY REGION, 2024–2029 (USD MILLION)
    9.4 MARINE 
           9.4.1 ENFORCEMENT OF STRICT EMISSION REGULATIONS TO DRIVE MARKET
                    TABLE 65 MARINE: MARKET, BY REGION, 2019–2023 (USD MILLION)
                    TABLE 66 MARINE: MARKET, BY REGION, 2024–2029 (USD MILLION)
 
10 SUSTAINABLE FUEL MARKET, BY REGION (Page No. - 141)
     10.1 INTRODUCTION 
               FIGURE 48 ASIA PACIFIC TO EXHIBIT HIGHEST CAGR DURING FORECAST PERIOD
               FIGURE 49 NORTH AMERICA ACCOUNTED FOR LARGEST SHARE OF SUSTAINABLE FUEL MARKET IN 2023
               TABLE 67 MARKET, BY REGION, 2019–2023 (MILLION TONS)
               TABLE 68 MARKET, BY REGION, 2024–2029 (MILLION TONS)
               TABLE 69 MARKET, BY REGION, 2019–2023 (USD MILLION)
               TABLE 70 MARKET, BY REGION, 2024–2029 (USD MILLION)
     10.2 ASIA PACIFIC 
             10.2.1 RECESSION IMPACT
             10.2.2 ASIA PACIFIC: MARKET, BY FUEL TYPE
                       TABLE 71 ASIA PACIFIC: MARKET, BY FUEL TYPE, 2019–2023 (USD MILLION)
                       TABLE 72 ASIA PACIFIC: MARKET, BY FUEL TYPE, 2024–2029 (USD MILLION)
             10.2.3 ASIA PACIFIC: MARKET, BY STATE
                       TABLE 73 ASIA PACIFIC: MARKET, BY STATE, 2019–2023 (USD MILLION)
                       TABLE 74 ASIA PACIFIC: MARKET, BY STATE, 2024–2029 (USD MILLION)
             10.2.4 ASIA PACIFIC: MARKET, BY END USER
                       TABLE 75 ASIA PACIFIC: MARKET, BY END USER, 2019–2023 (USD MILLION)
                       TABLE 76 ASIA PACIFIC: MARKET, BY END USER, 2024–2029 (USD MILLION)
             10.2.5 ASIA PACIFIC: MARKET, BY COUNTRY
                       TABLE 77 ASIA PACIFIC: MARKET, BY COUNTRY, 2019–2023 (USD MILLION)
                       TABLE 78 ASIA PACIFIC: MARKET, BY COUNTRY, 2024–2029 (USD MILLION)
                       10.2.5.1 China
                                   10.2.5.1.1 Increasing investment in sustainable fuels to drive market
                                   TABLE 79 CHINA: MARKET, BY FUEL TYPE, 2019–2023 (USD MILLION)
                                   TABLE 80 CHINA: MARKET, BY FUEL TYPE, 2024–2029 (USD MILLION)
                       10.2.5.2 India
                                   10.2.5.2.1 Rising adoption of clean energy and transition to a circular economy to foster growth
                                   TABLE 81 INDIA: MARKET, BY FUEL TYPE, 2019–2023 (USD MILLION)
                                   TABLE 82 INDIA: MARKET, BY FUEL TYPE, 2024–2029 (USD MILLION)
                       10.2.5.3 Japan
                                   10.2.5.3.1 Ongoing net zero carbon emission initiatives to drive market
                                   TABLE 83 JAPAN: MARKET, BY FUEL TYPE, 2019–2023 (USD MILLION)
                                   TABLE 84 JAPAN: MARKET, BY FUEL TYPE, 2024–2029 (USD MILLION)
                       10.2.5.4 Australia
                                   10.2.5.4.1 Development and commercialization of sustainable fuels to boost market
                                   TABLE 85 AUSTRALIA: MARKET, BY FUEL TYPE, 2019–2023 (USD MILLION)
                                   TABLE 86 AUSTRALIA: MARKET, BY FUEL TYPE, 2024–2029 (USD MILLION)
                       10.2.5.5 South Korea
                                   10.2.5.5.1 Measures for sustainable shipping and aviation to drive market
                                   TABLE 87 SOUTH KOREA: MARKET, BY FUEL TYPE, 2019–2023 (USD MILLION)
                                   TABLE 88 SOUTH KOREA: MARKET, BY FUEL TYPE, 2024–2029 (USD MILLION)
                       10.2.5.6 Rest of Asia Pacific
                                   TABLE 89 REST OF ASIA PACIFIC: MARKET, BY FUEL TYPE,  2019–2023 (USD MILLION)
                                   TABLE 90 REST OF ASIA PACIFIC: MARKET, BY FUEL TYPE,  2024–2029 (USD MILLION)
     10.3 EUROPE 
               FIGURE 50 EUROPE: REGIONAL SNAPSHOT
             10.3.1 RECESSION IMPACT
             10.3.2 EUROPE: MARKET, BY FUEL TYPE
                       TABLE 91 EUROPE: MARKET, BY FUEL TYPE, 2019–2023 (USD MILLION)
                       TABLE 92 EUROPE: MARKET, BY FUEL TYPE, 2024–2029 (USD MILLION)
             10.3.3 EUROPE: MARKET, BY STATE
                       TABLE 93 EUROPE: MARKET, BY STATE, 2019–2023 (USD MILLION)
                       TABLE 94 EUROPE: MARKET, BY STATE, 2024–2029 (USD MILLION)
             10.3.4 EUROPE: MARKET, BY END USER
                       TABLE 95 EUROPE: MARKET, BY END USER, 2019–2023 (USD MILLION)
                       TABLE 96 EUROPE: MARKET, BY APPLICATION, 2024–2029 (USD MILLION)
             10.3.5 EUROPE: MARKET, BY COUNTRY
                       TABLE 97 EUROPE: MARKET, BY COUNTRY, 2019–2023 (USD MILLION)
                       TABLE 98 EUROPE: MARKET, BY COUNTRY, 2024–2029 (USD MILLION)
                       10.3.5.1 Germany
                                   10.3.5.1.1 Launch of new schemes such as Neste Impact to boost demand for biofuels
                                   TABLE 99 GERMANY: MARKET, BY FUEL TYPE, 2019–2023 (USD MILLION)
                                   TABLE 100 GERMANY: MARKET, BY FUEL TYPE, 2024–2029 (USD MILLION)
                       10.3.5.2 UK
                                   10.3.5.2.1 Strategic investments in biofuels to drive market
                                   TABLE 101 UK: MARKET, BY FUEL TYPE, 2019–2023 (USD MILLION)
                                   TABLE 102 UK: MARKET, BY FUEL TYPE, 2024–2029 (USD MILLION)
                       10.3.5.3 France
                                   10.3.5.3.1 Upcoming incentives and policies to propel sustainable fuel market
                                   TABLE 103 FRANCE: MARKET, BY FUEL TYPE, 2019–2023 (USD MILLION)
                                   TABLE 104 FRANCE: MARKET, BY FUEL TYPE, 2024–2029 (USD MILLION)
                       10.3.5.4 Norway
                                   10.3.5.4.1 Commercialization of sustainable fuels by government and corporate sector to boost market
                                   TABLE 105 NORWAY: MARKET, BY FUEL TYPE, 2019–2023 (USD MILLION)
                                   TABLE 106 NORWAY: MARKET, BY FUEL TYPE, 2024–2029 (USD MILLION)
                       10.3.5.5 Rest of Europe
                                   TABLE 107 REST OF EUROPE: MARKET, BY FUEL TYPE,  2019–2023 (USD MILLION)
                                   TABLE 108 REST OF EUROPE: MARKET, BY FUEL TYPE,  2024–2029 (USD MILLION)
     10.4 MIDDLE EAST & AFRICA 
             10.4.1 RECESSION IMPACT
             10.4.2 MIDDLE EAST & AFRICA: MARKET, BY FUEL TYPE
                       TABLE 109 MIDDLE EAST & AFRICA: MARKET, BY FUEL TYPE,  2019–2023 (USD MILLION)
                       TABLE 110 MIDDLE EAST & AFRICA: MARKET, BY FUEL TYPE,  2024–2029 (USD MILLION)
             10.4.3 MIDDLE EAST & AFRICA: MARKET, BY STATE
                       TABLE 111 MIDDLE EAST & AFRICA: MARKET, BY STATE,  2019–2023 (USD MILLION)
                       TABLE 112 MIDDLE EAST & AFRICA: MARKET, BY STATE,  2024–2029 (USD MILLION)
             10.4.4 MIDDLE EAST & AFRICA: MARKET, BY END USER
                       TABLE 113 MIDDLE EAST & AFRICA: MARKET, BY END USER,  2019–2023 (USD MILLION)
                       TABLE 114 MIDDLE EAST & AFRICA: MARKET, BY END USER,  2024–2029 (USD MILLION)
             10.4.5 MIDDLE EAST & AFRICA: MARKET, BY COUNTRY
                       TABLE 115 MIDDLE EAST & AFRICA: MARKET, BY COUNTRY,  2019–2023 (USD MILLION)
                       TABLE 116 MIDDLE EAST & AFRICA: MARKET, BY COUNTRY,  2024–2029 (USD MILLION)
                       10.4.5.1 GCC countries
                                   TABLE 117 GCC COUNTRIES: MARKET, BY COUNTRY, 2019–2023 (USD MILLION)
                                   TABLE 118 GCC COUNTRIES: MARKET, BY COUNTRY, 2024–2029 (USD MILLION)
                                   10.4.5.1.1 Saudi Arabia
                                                    10.4.5.1.1.1 Major investments in sustainable and low-carbon transportation fuels to boost market
                                   TABLE 119 SAUDI ARABIA: MARKET, BY FUEL TYPE, 2019–2023 (USD MILLION)
                                   TABLE 120 SAUDI ARABIA: MARKET, BY FUEL TYPE, 2024–2029 (USD MILLION)
                                   10.4.5.1.2 UAE
                                                    10.4.5.1.2.1 Advanced biofuel policy for sustainable aviation and energy sector to drive market
                                   TABLE 121 UAE: MARKET, BY FUEL TYPE, 2019–2023 (USD MILLION)
                                   TABLE 122 UAE: MARKET, BY FUEL TYPE, 2024–2029 (USD MILLION)
                                   10.4.5.1.3 Rest of GCC countries
                                   TABLE 123 REST OF GCC COUNTRIES: MARKET, BY FUEL TYPE,  2019–2023 (USD MILLION)
                                   TABLE 124 REST OF GCC COUNTRIES: MARKET, BY FUEL TYPE,  2024–2029 (USD MILLION)
                       10.4.5.2 South Africa
                                   10.4.5.2.1 Advanced green energy transition to drive market
                                   TABLE 125 SOUTH AFRICA: MARKET, BY FUEL TYPE, 2019–2023 (USD MILLION)
                                   TABLE 126 SOUTH AFRICA: MARKET, BY FUEL TYPE, 2024–2029 (USD MILLION)
                       10.4.5.3 Rest of Middle East & Africa
                                   TABLE 127 REST OF MIDDLE EAST & AFRICA: MARKET, BY FUEL TYPE,  2019–2023 (USD MILLION)
                                   TABLE 128 REST OF MIDDLE EAST & AFRICA: MARKET, BY FUEL TYPE,  2024–2029 (USD MILLION)
     10.5 NORTH AMERICA 
               FIGURE 51 NORTH AMERICA: REGIONAL SNAPSHOT
             10.5.1 RECESSION IMPACT
             10.5.2 NORTH AMERICA: MARKET, BY FUEL TYPE
                       TABLE 129 NORTH AMERICA: MARKET, BY FUEL TYPE,  2019–2023 (USD MILLION)
                       TABLE 130 NORTH AMERICA: MARKET, BY FUEL TYPE,  2024–2029 (USD MILLION)
             10.5.3 NORTH AMERICA: MARKET, BY STATE
                       TABLE 131 NORTH AMERICA: MARKET, BY STATE, 2019–2023 (USD MILLION)
                       TABLE 132 NORTH AMERICA: MARKET, BY STATE, 2024–2029 (USD MILLION)
             10.5.4 NORTH AMERICA: MARKET, BY END USER
                       TABLE 133 NORTH AMERICA: MARKET, BY END USER,  2019–2023 (USD MILLION)
                       TABLE 134 NORTH AMERICA: MARKET, BY END USER,  2024–2029 (USD MILLION)
             10.5.5 NORTH AMERICA: MARKET, BY COUNTRY
                       TABLE 135 NORTH AMERICA: MARKET, BY COUNTRY,  2019–2023 (USD MILLION)
                       TABLE 136 NORTH AMERICA: MARKET, BY COUNTRY,  2024–2029 (USD MILLION)
                       10.5.5.1 US
                                   10.5.5.1.1 Increasing demand for sustainable fuels in aviation and marine industries to drive market
                                   TABLE 137 US: MARKET, BY FUEL TYPE, 2019–2023 (USD MILLION)
                                   TABLE 138 US: MARKET, BY FUEL TYPE, 2024–2029 (USD BILLION)
                       10.5.5.2 Canada
                                   10.5.5.2.1 Rising need for climate change mitigation to boost demand for sustainable fuels
                                   TABLE 139 CANADA: MARKET, BY FUEL TYPE, 2019–2023 (USD MILLION)
                                   TABLE 140 CANADA: MARKET, BY FUEL TYPE, 2024–2029 (USD BILLION)
                       10.5.5.3 Mexico
                                   10.5.5.3.1 Increasing demand for hydrogen and CNG vehicles to drive market
                                   TABLE 141 MEXICO: MARKET, BY FUEL TYPE, 2019–2023 (USD MILLION)
                                   TABLE 142 MEXICO: MARKET, BY FUEL TYPE, 2024–2029 (USD BILLION)
     10.6 SOUTH AMERICA 
             10.6.1 RECESSION IMPACT
             10.6.2 SOUTH AMERICA: MARKET, BY FUEL TYPE
                       TABLE 143 SOUTH AMERICA: MARKET, BY FUEL TYPE,  2019–2023 (USD MILLION)
                       TABLE 144 SOUTH AMERICA: MARKET, BY FUEL TYPE,  2024–2029 (USD MILLION)
             10.6.3 SOUTH AMERICA: MARKET, BY STATE
                       TABLE 145 SOUTH AMERICA: MARKET, BY STATE, 2019–2023 (USD MILLION)
                       TABLE 146 SOUTH AMERICA: MARKET, BY STATE, 2024–2029 (USD MILLION)
             10.6.4 SOUTH AMERICA: MARKET, BY END USER
                       TABLE 147 SOUTH AMERICA: MARKET, BY END USER,  2019–2023 (USD MILLION)
                       TABLE 148 SOUTH AMERICA: MARKET, BY END USER,  2024–2029 (USD MILLION)
             10.6.5 SOUTH AMERICA: MARKET, BY COUNTRY
                       TABLE 149 SOUTH AMERICA: MARKET, BY COUNTRY, 2019–2023 (USD MILLION)
                       TABLE 150 SOUTH AMERICA: MARKET, BY COUNTRY, 2024–2029 (USD MILLION)
                       10.6.5.1 Brazil
                                   10.6.5.1.1 Rising demand for clean hydrogen in transportation sector to boost market
                                   TABLE 151 BRAZIL: MARKET, BY FUEL TYPE, 2019–2023 (USD MILLION)
                                   TABLE 152 BRAZIL: MARKET, BY FUEL TYPE, 2024–2029 (USD MILLION)
                       10.6.5.2 Argentina
                                   10.6.5.2.1 Surge in gasoline demand to drive market
                                   TABLE 153 ARGENTINA: MARKET, BY FUEL TYPE, 2019–2023 (USD MILLION)
                                   TABLE 154 ARGENTINA: MARKET, BY FUEL TYPE, 2024–2029 (USD MILLION)
                       10.6.5.3 Rest of South America
                                   TABLE 155 REST OF SOUTH AMERICA: MARKET, BY FUEL TYPE,  2019–2023 (USD MILLION)
                                   TABLE 156 REST OF SOUTH AMERICA: MARKET, BY FUEL TYPE,  2024–2029 (USD MILLION)
 
11 COMPETITIVE LANDSCAPE (Page No. - 187)
     11.1 OVERVIEW 
     11.2 KEY STRATEGIES/RIGHT TO WIN 
               TABLE 157 MARKET: OVERVIEW OF STRATEGIES ADOPTED BY KEY PLAYERS, 2019–2024
     11.3 MARKET SHARE ANALYSIS OF KEY PLAYERS, 2023 
               FIGURE 52 MARKET: MARKET SHARE ANALYSIS, 2023
             11.3.1 MARKET RANKING ANALYSIS
                       FIGURE 53 RANKING OF KEY PLAYERS IN MARKET
             11.3.2 MARKET EVALUATION FRAMEWORK, 2020–2024
                       TABLE 159 MARKET: MARKET EVALUATION FRAMEWORK, 2020–2024
     11.4 REVENUE ANALYSIS OF KEY PLAYERS 
               FIGURE 54 MARKET: REVENUE ANALYSIS OF TEN KEY PLAYERS,  2019–2023
     11.5 COMPANY VALUATION AND FINANCIAL MATRIX 
               FIGURE 55 MARKET: COMPANY VALUATION
               FIGURE 56 MARKET: FINANCIAL MATRIX
     11.6 COMPANY EVALUATION MATRIX: KEY PLAYERS, 2023 
             11.6.1 STARS
             11.6.2 EMERGING LEADERS
             11.6.3 PERVASIVE PLAYERS
             11.6.4 PARTICIPANTS
                       FIGURE 57 MARKET: COMPANY EVALUATION MATRIX  
(KEY PLAYERS), 2023
             11.6.5 COMPANY FOOTPRINT: KEY PLAYERS
                       11.6.5.1 Company footprint
                                   FIGURE 58 MARKET: COMPANY OVERALL FOOTPRINT
                       11.6.5.2 Product footprint
                                   FIGURE 59 MARKET: COMPANY PRODUCT FOOTPRINT
                       11.6.5.3 Market footprint
                                   FIGURE 60 MARKET: COMPANY MARKET FOOTPRINT
                       11.6.5.4 Regional footprint
                                   TABLE 160 MARKET: REGION FOOTPRINT
                       11.6.5.5 Fuel type footprint
                                   TABLE 161 MARKET: FUEL TYPE FOOTPRINT
                       11.6.5.6 State footprint
                                   TABLE 162 MARKET: STATE FOOTPRINT
                       11.6.5.7 End user footprint
                                   TABLE 163 MARKET: END USER FOOTPRINT
                       11.6.5.8 Type footprint
                                   TABLE 164 MARKET: TYPE FOOTPRINT
     11.7 BRAND/PRODUCT COMPARATIVE ANALYSIS 
     11.8 COMPANY EVALUATION MATRIX: OTHER PLAYERS, 2023 
             11.8.1 STARS
             11.8.2 EMERGING LEADERS
             11.8.3 PERVASIVE PLAYERS
             11.8.4 PARTICIPANTS
                       FIGURE 61 MARKET: COMPANY EVALUATION MATRIX (OTHER PLAYERS), 2023
             11.8.5 COMPANY FOOTPRINT: OTHER PLAYERS, 2023
                       11.8.5.1 Company footprint
                                   FIGURE 62 MARKET: COMPANY OVERALL FOOTPRINT (OTHER PLAYERS)
                       11.8.5.2 Regional footprint
                                   TABLE 165 MARKET: REGION FOOTPRINT (OTHER PLAYERS)
                       11.8.5.3 Fuel type footprint
                                   TABLE 166 MARKET: FUEL TYPE FOOTPRINT (OTHER PLAYERS)
                       11.8.5.4 State footprint
                                   TABLE 167 MARKET: STATE FOOTPRINT (OTHER PLAYERS)
                       11.8.5.5 Type footprint
                                   TABLE 168 MARKET: TYPE FOOTPRINT (OTHER PLAYERS)
                       11.8.5.6 End user footprint
                                   TABLE 169 MARKET: END USER FOOTPRINT (OTHER PLAYERS)
     11.9 COMPETITIVE SCENARIO AND TRENDS 
             11.9.1 PRODUCT LAUNCHES
                       TABLE 170 MARKET: PRODUCT LAUNCHES, JANUARY 2020–APRIL 2024
             11.9.2 DEALS
                       TABLE 171 MARKET: DEALS, JANUARY 2020–APRIL 2024
             11.9.3 EXPANSION
                       TABLE 172 MARKET: EXPANSION, JANUARY 2020–APRIL 2024
             11.9.4 OTHER DEVELOPMENTS
                       TABLE 173 MARKET: OTHER DEVELOPMENTS, JANUARY 2020–APRIL 2024
 
12 COMPANY PROFILES (Page No. - 218)
(Business overview, Products/Services/Solutions offered, Recent Developments, MNM view)*
     12.1 KEY COMPANIES 
             12.1.1 CHEVRON CORPORATION
                       TABLE 174 CHEVRON CORPORATION: COMPANY OVERVIEW
                       FIGURE 63 CHEVRON CORPORATION: COMPANY SNAPSHOT
                       TABLE 175 CHEVRON CORPORATION: PRODUCTS/SERVICES/SOLUTIONS OFFERED
                       TABLE 176 CHEVRON CORPORATION: PRODUCT LAUNCHES
                       TABLE 177 CHEVRON CORPORATION: DEALS
                       TABLE 178 CHEVRON CORPORATION: EXPANSION
             12.1.2 ADM
                       TABLE 179 ADM: COMPANY OVERVIEW
                       FIGURE 64 ADM: COMPANY SNAPSHOT
                       TABLE 180 ADM: PRODUCTS/SERVICES/SOLUTIONS OFFERED
                       TABLE 181 ADM: DEALS
                       TABLE 182 ADM: OTHER DEVELOPMENTS
             12.1.3 CNPC
                       TABLE 183 CNPC: COMPANY OVERVIEW
                       FIGURE 65 CNPC: COMPANY SNAPSHOT
                       TABLE 184 CNPC: PRODUCTS/SERVICES/SOLUTIONS OFFERED
                       TABLE 185 CNPC: DEALS
                       TABLE 186 CNPC: EXPANSION
             12.1.4 SHELL PLC
                       TABLE 187 SHELL PLC: COMPANY OVERVIEW
                       FIGURE 66 SHELL PLC: COMPANY SNAPSHOT
                       TABLE 188 SHELL PLC: PRODUCTS/SERVICES/SOLUTIONS OFFERED
                       TABLE 189 SHELL PLC: PRODUCT LAUNCHES
                       TABLE 190 SHELL PLC: DEALS
                       TABLE 191 SHELL PLC: EXPANSION
             12.1.5 SAUDI ARABIAN OIL CO.
                       TABLE 192 SAUDI ARABIAN OIL CO.: COMPANY OVERVIEW
                       FIGURE 67 SAUDI ARABIAN OIL CO.: COMPANY SNAPSHOT
                       TABLE 193 SAUDI ARABIAN OIL CO.: PRODUCTS/SERVICES/SOLUTIONS OFFERED
                       TABLE 194 SAUDI ARABIAN OIL CO.: DEALS
                       TABLE 195 SAUDI ARABIAN OIL CO.: EXPANSION
             12.1.6 TOTALENERGIES
                       TABLE 196 TOTALENERGIES: COMPANY OVERVIEW
                       TABLE 197 TOTALENERGIES: PRODUCTS/SOLUTIONS/SERVICES OFFERED
                       TABLE 198 TOTALENERGIES: PRODUCT LAUNCHES
                       TABLE 199 TOTALENERGIES: DEALS
             12.1.7 AIR LIQUIDE
                       TABLE 200 AIR LIQUIDE: COMPANY OVERVIEW
                       FIGURE 69 AIR LIQUIDE: COMPANY SNAPSHOT
                       TABLE 201 AIR LIQUIDE: PRODUCTS/SERVICES/SOLUTIONS OFFERED
                       TABLE 202 AIR LIQUIDE: DEALS
                       TABLE 203 AIR LIQUIDE: OTHER DEVELOPMENTS
             12.1.8 AUDI AG
                       TABLE 204 AUDI AG: COMPANY OVERVIEW
                       FIGURE 70 AUDI AG: COMPANY SNAPSHOT
                       TABLE 205 AUDI AG: PRODUCTS/SERVICES/SOLUTIONS OFFERED
                       TABLE 206 AUDI AG: PRODUCT LAUNCHES
             12.1.9 SIEMENS ENERGY
                       TABLE 207 SIEMENS ENERGY: COMPANY OVERVIEW
                       FIGURE 71 SIEMENS ENERGY: COMPANY SNAPSHOT
                       TABLE 208 SIEMENS ENERGY: PRODUCTS/SERVICES/SOLUTIONS OFFERED
                       TABLE 209 SIEMENS ENERGY: DEALS
               12.1.10 GASUM LTD.
                                   TABLE 210 GASUM LTD.: COMPANY OVERVIEW
                                   FIGURE 72 GASUM LTD.: COMPANY SNAPSHOT
                                   TABLE 211 GASUM LTD.: PRODUCTS/SERVICES/SOLUTIONS OFFERED
                                   TABLE 212 GASUM LTD.: DEALS
                                   TABLE 213 GASUM LTD.: OTHER DEVELOPMENTS
               12.1.11 LINDE PLC
                                   TABLE 214 LINDE PLC: COMPANY OVERVIEW
                                   FIGURE 73 LINDE PLC: COMPANY SNAPSHOT
                                   TABLE 215 LINDE PLC: PRODUCTS/SERVICES/SOLUTIONS OFFERED
                                   TABLE 216 LINDE PLC: PRODUCT LAUNCHES
                                   TABLE 217 LINDE PLC: DEALS
                                   TABLE 218 LINDE PLC: EXPANSION
               12.1.12 AIR PRODUCTS AND CHEMICALS, INC.
                                   TABLE 219 AIR PRODUCTS AND CHEMICALS, INC.: COMPANY OVERVIEW
                                   FIGURE 74 AIR PRODUCTS AND CHEMICALS, INC.: COMPANY SNAPSHOT
                                   TABLE 220 AIR PRODUCTS AND CHEMICALS, INC.: PRODUCTS/SERVICES/SOLUTIONS OFFERED
                                   TABLE 221 AIR PRODUCTS AND CHEMICALS, INC.: DEALS
                                   TABLE 222 AIR PRODUCTS AND CHEMICALS, INC.: OTHER DEVELOPMENTS
               12.1.13 ELECTROCHAEA GMBH
                                   TABLE 223 ELECTROCHAEA GMBH: COMPANY OVERVIEW
                                   TABLE 224 ELECTROCHAEA GMBH: PRODUCTS/SERVICES/SOLUTIONS OFFERED
                                   TABLE 225 ELECTROCHAEA GMBH: OTHER DEVELOPMENTS
               12.1.14 VALERO
                                   TABLE 226 VALERO: COMPANY OVERVIEW
                                   FIGURE 75 VALERO: COMPANY SNAPSHOT
                                   TABLE 227 VALERO: PRODUCTS/SERVICES/SOLUTIONS OFFERED
                                   TABLE 228 VALERO: DEALS
                                   TABLE 229 VALERO: OTHER DEVELOPMENTS
               12.1.15 NESTE
                                   TABLE 230 NESTE: COMPANY OVERVIEW
                                   FIGURE 76 NESTE: COMPANY SNAPSHOT
                                   TABLE 231 NESTE: PRODUCTS/SERVICES/SOLUTIONS OFFERED
                                   TABLE 232 NESTE: DEALS
                                   TABLE 233 NESTE: OTHER DEVELOPMENTS
               12.1.16 CARGILL, INCORPORATED
                                   TABLE 234 CARGILL, INCORPORATED: COMPANY OVERVIEW
                                   FIGURE 77 CARGILL, INCORPORATED: COMPANY SNAPSHOT
                                   TABLE 235 CARGILL, INCORPORATED: PRODUCTS/SERVICES/SOLUTIONS OFFERED
                                   TABLE 236 CARGILL, INCORPORATED: DEALS
                                   TABLE 237 CARGILL, INCORPORATED: EXPANSION
               12.1.17 NATURE ENERGY
                                   TABLE 238 NATURE ENERGY: COMPANY OVERVIEW
                                   TABLE 239 NATURE ENERGY: PRODUCTS/SOLUTIONS/SERVICES OFFERED
                                   TABLE 240 NATURE ENERGY: DEALS
                                   TABLE 241 NATURE ENERGY: OTHER DEVELOPMENTS
               12.1.18 ARCHAEA ENERGY INC.
                                   TABLE 242 ARCHAEA ENERGY INC.: COMPANY OVERVIEW
                                   TABLE 243 ARCHAEA ENERGY INC.: PRODUCTS/SOLUTIONS/SERVICES OFFERED
                                   TABLE 244 ARCHAEA ENERGY INC.: DEALS
                                   TABLE 245 ARCHAEA ENERGY INC.: EXPANSION
               12.1.19 OPAL FUELS
                                   TABLE 246 OPAL FUELS: COMPANY OVERVIEW
                                   FIGURE 78 OPAL FUELS: COMPANY SNAPSHOT
                                   TABLE 247 OPAL FUELS: PRODUCTS/SOLUTIONS/SERVICES OFFERED
                                   TABLE 248 OPAL FUELS: DEALS
                                   TABLE 249 OPAL FUELS: OTHER DEVELOPMENTS
               12.1.20 REPSOL
                                   TABLE 250 REPSOL: COMPANY OVERVIEW
                                   FIGURE 79 REPSOL: COMPANY SNAPSHOT
                                   TABLE 251 REPSOL: PRODUCTS/SERVICES/SOLUTIONS OFFERED
                                   TABLE 252 REPSOL: PRODUCT LAUNCHES
                                   TABLE 253 REPSOL: DEALS
                                   TABLE 254 REPSOL: OTHER DEVELOPMENTS
               12.1.21 ENGIE
                                   TABLE 255 ENGIE: COMPANY OVERVIEW
                                   TABLE 256 ENGIE: PRODUCTS/SOLUTIONS/SERVICES OFFERED
                                   TABLE 257 ENGIE: DEALS
                                   TABLE 258 ENGIE: OTHER DEVELOPMENTS
               12.1.22 INDIAN OIL CORPORATION LTD
                                   TABLE 259 INDIAN OIL CORPORATION LTD.: COMPANY OVERVIEW
                                   FIGURE 81 INDIAN OIL CORPORATION LTD.: COMPANY SNAPSHOT
                                   TABLE 260 INDIAN OIL CORPORATION LTD.: PRODUCTS/SERVICES/SOLUTIONS OFFERED
                                   TABLE 261 INDIAN OIL CORPORATION LTD.: PRODUCT LAUNCHES
                                   TABLE 262 INDIAN OIL CORPORATION LTD.: DEALS
               12.1.23 BP P.L.C.
                                   TABLE 263 BP P.L.C.: COMPANY OVERVIEW
                                   FIGURE 82 BP P.L.C.: COMPANY SNAPSHOT
                                   TABLE 264 BP P.L.C.: PRODUCTS/SERVICES/SOLUTIONS OFFERED
                                   TABLE 265 BP P.L.C.: DEALS
                                   TABLE 266 BP P.L.C.: EXPANSION
               12.1.24 CONOCOPHILLIPS COMPANY
                                   TABLE 267 CONOCOPHILLIPS COMPANY: COMPANY OVERVIEW
                                   FIGURE 83 CONOCOPHILLIPS COMPANY: COMPANY SNAPSHOT
                                   TABLE 268 CONOCOPHILLIPS COMPANY: PRODUCTS/SERVICES/SOLUTIONS OFFERED
                                   TABLE 269 CONOCOPHILLIPS COMPANY: DEALS
     12.2 OTHER PLAYERS 
             12.2.1 UNIPER SE
                       TABLE 270 UNIPER SE: COMPANY OVERVIEW
             12.2.2 ØRSTED A/S
                       TABLE 271 ØRSTED A/S: COMPANY OVERVIEW
             12.2.3 MAN ENERGY SOLUTIONS
                       TABLE 272 MAN ENERGY SOLUTIONS: COMPANY OVERVIEW
             12.2.4 VERBIO SE
                       TABLE 273 VERBIO SE: COMPANY OVERVIEW
             12.2.5 KINDER MORGAN
                       TABLE 274 KINDER MORGAN: COMPANY OVERVIEW
             12.2.6 E.ON SE
                       TABLE 275 E.ON SE: COMPANY OVERVIEW
             12.2.7 MESSER GROUP
                       TABLE 276 MESSER GROUP: COMPANY OVERVIEW
             12.2.8 EQUINOR ASA
                       TABLE 277 EQUINOR ASA: COMPANY OVERVIEW
             12.2.9 DR. ING. H.C. F. PORSCHE AG
                       TABLE 278 DR. ING. H.C. F. PORSCHE AG: COMPANY OVERVIEW
               12.2.10 MITSUBISHI MOTORS CORPORATION
                       TABLE 279 MITSUBISHI MOTORS CORPORATION: COMPANY OVERVIEW
               12.2.11 GREEN PLAINS INC.
                       TABLE 280 GREEN PLAINS INC.: COMPANY OVERVIEW
               12.2.12 POET, LLC
                       TABLE 281 POET, LLC: COMPANY OVERVIEW
               12.2.13 WILMAR INTERNATIONAL LTD.
                       TABLE 282 WILMAR INTERNATIONAL LTD.: COMPANY OVERVIEW
               12.2.14 THE ANDERSONS, INC.
                                   TABLE 283 THE ANDERSONS, INC.: COMPANY OVERVIEW
               12.2.15 ENVITEC BIOGAS AG
                                   TABLE 284 ENVITEC BIOGAS AG: COMPANY OVERVIEW
               12.2.16 FUTURE BIOGAS LIMITED
                                   TABLE 285 FUTURE BIOGAS LIMITED: COMPANY OVERVIEW
               12.2.17 WAGA ENERGY
                                   TABLE 286 WAGA ENERGY: COMPANY OVERVIEW
               12.2.18 INFINIUM
                                   TABLE 287 INFINIUM: COMPANY OVERVIEW
*Details on Business overview, Products/Services/Solutions offered, Recent Developments, MNM view might not be captured in case of unlisted companies.
 
13 APPENDIX (Page No. - 332)
     13.1 INSIGHTS FROM INDUSTRY EXPERTS 
     13.2 DISCUSSION GUIDE 
     13.3 KNOWLEDGESTORE: MARKETSANDMARKETS’  SUBSCRIPTION PORTAL 
     13.4 CUSTOMIZATION OPTIONS 
     13.5 RELATED REPORTS 
     13.6 AUTHOR DETAILS 

The study involved major activities in estimating the current size of the sustainable fuel market. Exhaustive secondary research was done to collect information on the peer and parent markets. The next step was to validate these findings, assumptions, and sizing with industry experts across the value chain through primary research. Both top-down and bottom-up approaches were employed to estimate the total market size. Thereafter, market breakdown and data triangulation were used to estimate the market size of the segments and subsegments.

Secondary Research

This research study on the sustainable fuel market involved the use of extensive secondary sources, directories, and databases, such as Hoover’s, Bloomberg, Factiva, IRENA, International Energy Agency, and Statista Industry Journal, to collect and identify information useful for a technical, market-oriented, and commercial study of the market. The other secondary sources included annual reports, press releases & investor presentations of companies, white papers, certified publications, articles by recognized authors, manufacturer associations, trade directories, and databases.

Primary Research

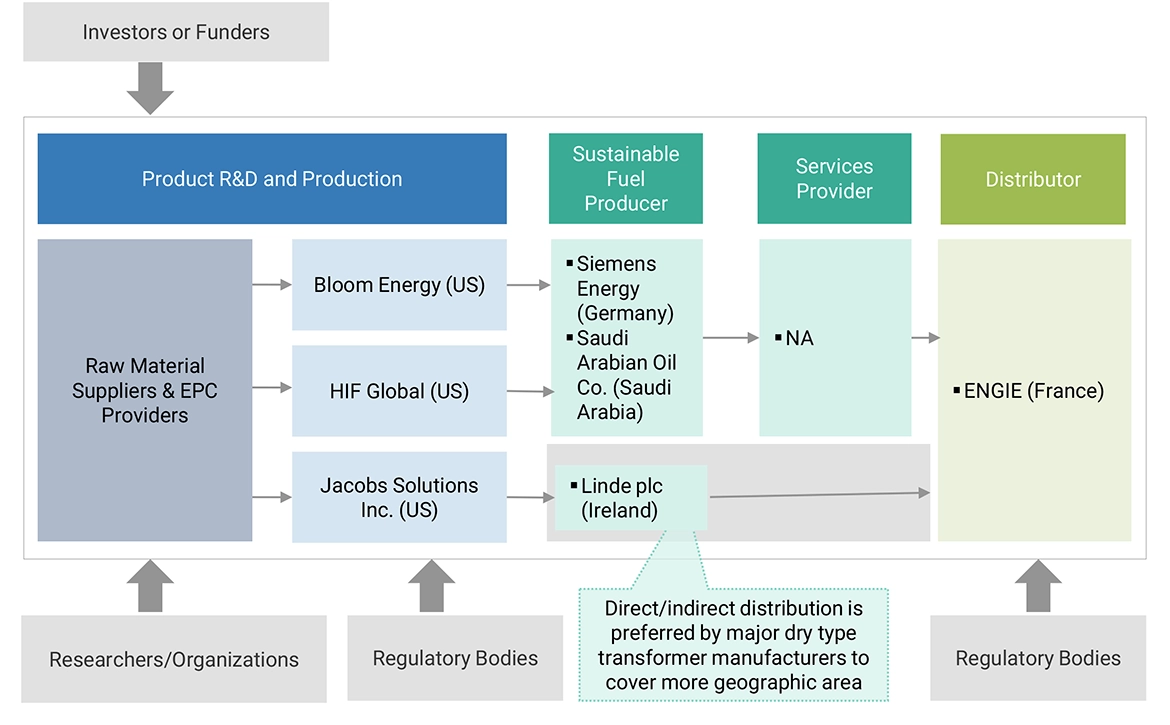
The sustainable fuel market comprises several stakeholders, such as sustainable fuel providers, technology providers in the supply chain. The demand side of this market is characterized by the rising demand for sustainable fuels in various end users such as road transportation, aviation, and marine. The supply side is characterized by rising demand for contracts from the industrial sector and mergers & acquisitions among big players. Various primary sources from both the supply and demand sides of the market were interviewed to obtain qualitative and quantitative information. Following is the breakdown of primary respondents:

Sustainable Fuel Market Size, and Share

To know about the assumptions considered for the study, download the pdf brochure

Market Size Estimation

Both top-down and bottom-up approaches were used to estimate and validate the total size of the sustainable fuel market. These methods were also used extensively to estimate the size of various subsegments in the market. The research methodology used to estimate the market size includes the following:

  • The key players in the industry and market have been identified through extensive secondary research, and their market share has been determined through primary and secondary research.
  • The industry’s value chain and market size, in terms of value, have been determined through both primary and secondary research processes.
  • All percentage shares, splits, and breakdowns have been determined using secondary sources and verified through primary sources.

Sustainable Fuel Market Size: Top-Down Approach

Sustainable Fuel Market Top Down Approach

To know about the assumptions considered for the study, Request for Free Sample Report

Sustainable Fuel Market Size: Bottom-Up Approach

Sustainable Fuel Market Bottom Up Approach

Data Triangulation

After arriving at the overall market size from the above estimation process, the total market has been split into several segments and subsegments. Data triangulation and market breakdown processes have been employed to complete the overall market engineering process and arrive at the exact statistics for all the segments and sub-segments, wherever applicable. The data has been triangulated by studying various factors and trends from both the demand- and supply sides. Along with this, the market has been validated using both the top-down and bottom-up approaches.

Market Definition

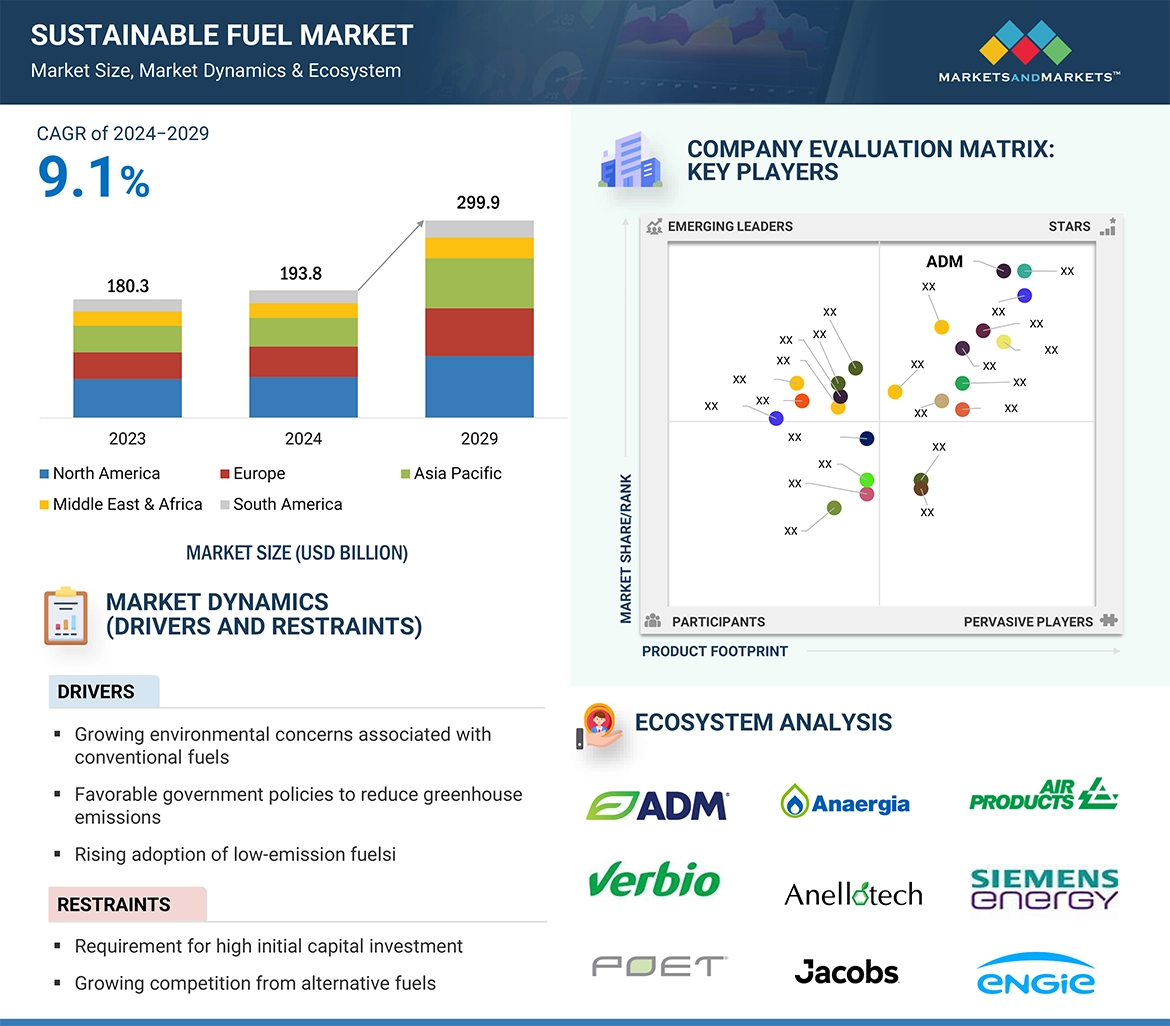
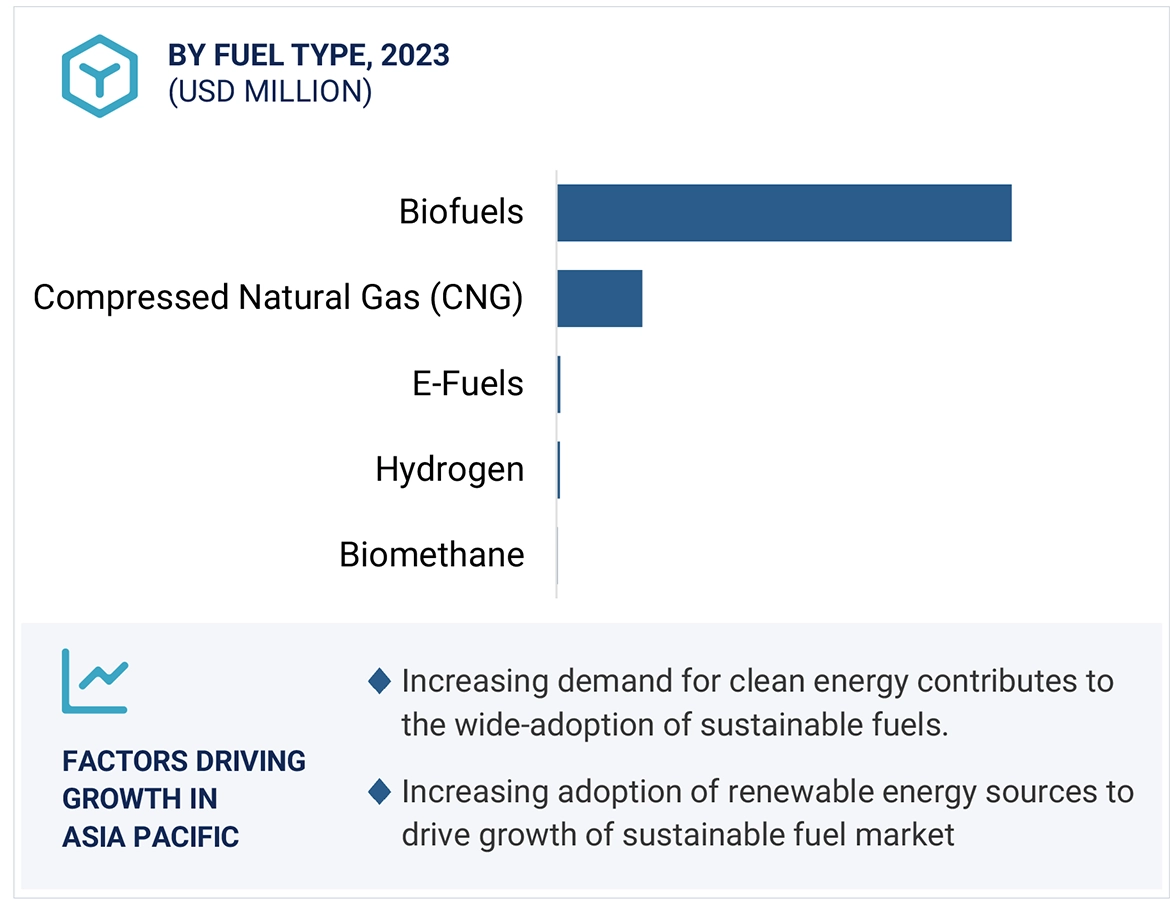
Sustainable fuels are characterized as low or zero emission fuels that produce fewer greenhouse gas emissions compared to conventional fossil fuels when combusted. They encompass biofuels, e-fuels, hydrogen, biomethane, and other alternatives. These fuels are essential in the fight against climate change, reducing overall carbon content and promoting environmental sustainability.

The sustainable fuel market comprises revenues of companies offering sustainable fuels for various applications such as road transportation, aviation and marine.

Key Stakeholders

  • Energy Regulators
  • Renewable fuel producers
  • Low carbon fuel producers
  • Consulting companies in the energy and power sector
  • Institutional investors/shareholders
  • Governments and research organizations

Objectives of the Study

  • To describe, segment, and forecast the sustainable fuel market, by fuel type, state, type, and end users in terms of value
  • To forecast the market across five key regions, namely, North America, Europe, Asia Pacific, Middle East & Africa, and South America in terms of value
  • To forecast the market by fuel type, in terms of volume
  • To provide detailed information regarding key drivers, restraints, opportunities, and challenges influencing the growth of the market
  • To strategically analyze the micromarkets1 with respect to individual growth trends, prospects, and contributions to the overall market size
  • To provide the supply chain analysis, trends/disruptions impacting customers’ businesses, market map, ecosystem analysis, tariffs and regulations, pricing analysis, patent analysis, case study analysis, technology analysis, key conferences and events, trade analysis, Porter’s five forces analysis, key stakeholders and buying criteria, and regulatory analysis of the market
  • To analyze opportunities for stakeholders in the sustainable fuels and draw a competitive landscape of the market
  • To benchmark players within the market using the company evaluation matrix, which analyzes market players on several parameters within the broad categories of business and product strategies
  • To compare key market players with respect to product specifications and applications
  • To strategically profile key players and comprehensively analyze their market rankings and core competencies2
  • To analyze competitive developments, such as contracts & agreements, investments & expansions, mergers & acquisitions, new product launches, partnerships, joint ventures & collaborations, in the sustainable fuel market

Available Customizations:

With the given market data, MarketsandMarkets offers customizations according to the specific requirements of companies. The following customization options are available for the report:

Product Analysis

  • Product Matrix, which provides a detailed comparison of the product portfolio of each company

Company Information

  • Detailed analyses and profiling of additional market players
Custom Market Research Services

We will customize the research for you, in case the report listed above does not meet with your exact requirements. Our custom research will comprehensively cover the business information you require to help you arrive at strategic and profitable business decisions.

Request Customization
Report Code
EP 9028
Published ON
May, 2024
Choose License Type
BUY NOW
  • SHARE
X
Request Customization
Speak to Analyst
Speak to Analyst
OR FACE-TO-FACE MEETING
PERSONALIZE THIS RESEARCH
  • Triangulate with your Own Data
  • Get Data as per your Format and Definition
  • Gain a Deeper Dive on a Specific Application, Geography, Customer or Competitor
  • Any level of Personalization
REQUEST A FREE CUSTOMIZATION
LET US HELP YOU!
  • What are the Known and Unknown Adjacencies Impacting the Sustainable Fuel Market
  • What will your New Revenue Sources be?
  • Who will be your Top Customer; what will make them switch?
  • Defend your Market Share or Win Competitors
  • Get a Scorecard for Target Partners
CUSTOMIZED WORKSHOP REQUEST
  • Call Us
  • +1-888-600-6441 (Corporate office hours)
  • +1-888-600-6441 (US/Can toll free)
  • +44-800-368-9399 (UK office hours)
CONNECT WITH US
ABOUT TRUST ONLINE
©2024 MarketsandMarkets Research Private Ltd. All rights reserved
DMCA.com Protection Status Website Feedback