Tumor Ablation Market

Tumor Ablation Market Size, Share & Trends by Technology (Radiofrequency, Microwave, Laser, IRE, HIFU, Cryoablation), Product (Generators, Probes), Mode (Surgical, Laparoscopic, Percutaneous), Cancer (Liver, Lung, Bone), End User (Hospitals, Clinic) & Region - Global Forecast to 2029

Report Code: MD 3271 May, 2024, by marketsandmarkets.com

Updated on : Aug 22, 2024

Tumor Ablation Market Size, Share & Trends

The size of global tumor ablation market in terms of revenue was estimated to be worth $0.8 billion in 2024 and is poised to reach $1.4 billion by 2029, growing at a CAGR of 10.0% from 2024 to 2029. The comprehensive research encompasses an exhaustive examination of industry trends, meticulous pricing analysis, patent scrutiny, insights derived from conferences and webinars, identification of key stakeholders, and a nuanced understanding of market purchasing dynamics.

Major driver is the rising incidence of cancer, particularly among the aging population. Additionally, advancements in probe/electrode technology have led to the increasing demand for ablation systems, which offer precise ablation and minimal damage to healthy tissue. Moreover, rising awareness about early detection and rising disposable incomes, coupled with expanding access to healthcare services in emerging markets, further fuel the demand for tumor ablation.

Tumor Ablation Market Trends

Tumor Ablation Market

To know about the assumptions considered for the study, Request for Free Sample Report

Tumor Ablation Market

e- Estimated; p- Projected

Tumor Ablation Market Dynamics

Driver: Increasing cancer incidence and rising geriatric population

Tumor ablation market is primarily driven by the rising incidence of cancer globally. Tumor ablation is widely used for the treatment of lung cancer, liver cancer, prostate cancer, bone cancer, and kidney cancer among others. According to WHO, cancer was the major cause of death globally in 2020 -accounted for around 10 mn deaths. Emerging economies in Asia, Africa, and Oceania reported 55% of the 18.1 million cancer cases diagnosed. With the continuous rise in the global cancer patient population, there is expected to be a significant increase in demand for tumor ablation procedures during the forecast period.

Restraint: Increasing cancer incidence and rising geriatric population

High cost of tumor ablation systems is one of the restrains in tumor ablation market. Premium product pricing hinders the adoption in emerging countries. Small healthcare facilities rely on third-party payers to reimburse the costs incurred in diagnostic, screening, and therapeutic procedures. The high cost of the equipment makes it difficult for most hospitals in emerging economies to afford this technology. Hence, smaller end users are hesitant to invest in this equipment.

Opportunity: Rising healthcare expenditure across emerging economies

Growing healthcare expenditure in emerging nations such as China, India, Brazil, and Mexico are expected to offer lucrative opportunities for tumor ablation market. For instance, according to GLOBOCAN 2020 data, over 50% of the global cancer population resides in emerging economies. Increasing government initiatives towards providing advanced healthcare services and improving reimbursement coverage support the adoption of tumor ablation devices. rapid increase in the per-capita healthcare expenditure and the rising public demand for affordable healthcare in emerging economies to further expected to drive the demand for ablation systems in developing countries.

Challenge: Rising adoption of refurbished tumor ablation systems

Small scale end users specifically in developing countries often opt for refurbished alternatives as a cost-effective solution. Refurbished systems are sold at a fraction of the cost of new equipment Refurbished systems are sold at a fraction of the cost of new equipment. Due to similar functioning and affordable cost the adoption of refurbished systems is experiencing a surge in the adoption. This poses a challenge for smaller manufacturers who are struggling to keep up and is expected to impact the market growth.

Tumor Ablation Industry Ecosystem.

Tumor Ablation Market Ecosystem

By Technology, the radiofrequency ablation segment accounted for the largest share of the tumor ablation industry in 2022.

Based on technology, the tumor ablation market is segmented into radiofrequency ablation, microwave ablation, high intensity focused ultrasound (HIFU), cryoablation, and other technologies. In 2023, the radiofrequency ablation segment accounted for the largest market share. Rising awareness of proactive health and expansion of market players fuel the growth of tumor ablation market.

By Product Type, the generators segment of the tumor ablation industry to register significant growth in the near future.

Based on product type, the tumor ablation market is segmented into generators probes and electrodes. The generators segment accounted for the largest market share in 2023. The demand for minimally invasive procedures is increasing due to the emphasis on improving quality of life. Additionally, favorable regulatory scenarios and a surge in oncological surgeries contribute to the rising adoption of tumor ablation systems.

The laparoscopic ablation segment for mode of treatment segment is expected to register a higher CAGR of the tumor ablation industry forecast period.

Based on mode of treatment, the tumor ablation market is segmented into laparoscopic ablation, surgical ablation, and percutaneous ablation. Increasing collaboration between industry players and healthcare providers and integration of ablation systems with other treatment modalities contribute to the growth of this segment. Laparoscopic ablation has improved benefits as compared to other modes of treamtnets. Factors such as reduced pain, greater visibility due to laparoscopic cameras, quick recovery, and shorter stays at the hospitals contribute to the exponential growth of this segment.

The liver cancer segment for application segment held the largest share of the tumor ablation industry in 2023.

Based on application, the tumor ablation market is segmented into liver cancer, kidney cancer, lung cancer, bone cancer, and other applications. Liver cancer segment held largest share of the market in 2023 and is also expected to register a significant growth rate from 2024 to 2029. Increasing adoption of image-guided therapies and increasing funding opportunities for cancer research are driving the adoption.

By end user, the hospitals and clinic centers segment of the tumor ablation industry held the largest share.

The tumor ablation market is segmented by end users into hospitals and clinics, cancer care centers, and other end users. However, the cancer care centers segment is expected to grow at the highest CAGR during the forecast period.  The rise in number of chronic diseases, including cancer, increasing cancer diagnostic procedures in the hospitals globally, and the potential of benefits of ablation observed in patients with early stage cancer have contributed to the growth of this segment.

By region, North America is expected to be the largest market of the tumor ablation industry by 2029.

The US and Canada accounted for a significant market share in 2023. North America's faster growth in the tumor ablation market can be attributed to its technological leadership, robust healthcare infrastructure, favorable insurance coverage, growing funding and grants for developing advanced medical equipment, favorable regulatory scenario, strategic research collaboration, and a supportive market environment fostering innovation.

Tumor Ablation Market by Region

To know about the assumptions considered for the study, download the pdf brochure

As of 2023, prominent players in the market are Johnson & Johnson MedTech (US), Medtronic Plc (Ireland), Stryker Corporation (US), Varian Medical Systems, Inc. (US), Olympus (Japan), AngioDynamics, Inc. (US), Boston Scientific Corporation (US), IceCure Medical Ltd. (Israel), Bioventus Inc. (US).

Scope of the Tumor Ablation Industry:

Report Metric

Details

Market Revenue in 2024

$0.8 billion

Projected Revenue by 2029

$1.4 billion

Revenue Rate

Poised to Grow at a CAGR of 10.0%

Market Driver

Increasing cancer incidence and rising geriatric population

Market Opportunity

Rising healthcare expenditure across emerging economies

This report has segmented the global tumor ablation market to forecast revenue and analyze trends in each of the following submarkets:

By Technology
  • Radiofrequency Ablation
  • Microwave Ablation
  • Cryoablation
  • High-intensity Focused Ultrasound
  • Other Technologies
By Product Type
  • Generators
  • Probes/electrodes
By Mode Of Treatment
  • Surgical Ablation
  • Percutaneous Ablation
  • Laparoscopic Ablation
By Application
  • Liver Cancer
  • Lung Cancer
  • Kidney Cancer
  • Bone Cancer
  • Other Applications
By End User
  • Hospitals & clinics
  • Cancer care centers
  • Other End Users
By Region
  • North America
    • US
    • Canada
  • Europe
    • Germany
    • France
    • UK
    • Italy
    • Spain
    • Rest of Europe
  • Asia Pacific
    • Japan
    • China
    • India
    • Australia
    • South Korea
    • Rest of Asia Pacific
  • Latin America
    • Brazil
    • Mexico
    • Rest of Latin America

Recent Developments of the Tumor Ablation Industry:

  • In May 2023, Varian launched the Isolis cryoprobe for CryoCare systems. These are disposable probes with improved efficiency and precision for cryoablation. It helps with tumor ablation. They also support accuracy and help to reduce procedure time.
  • In April 2023, AngioDynamics extended its partnership with Cardiva. The collaboration aims to introduce AngioDynamics’ oncology products across Europe.

Frequently Asked Questions (FAQ):

To speak to our analyst for a discussion on the above findings, click Speak to Analyst

TABLE OF CONTENTS
 
1 INTRODUCTION 
2 RESEARCH METHODOLOGY
3 EXECUTIVE SUMMARY
 
4 PREMIUM INSIGHTS (Page No. - 41)
    4.1 TUMOR ABLATION MARKET OVERVIEW 
    4.2 NORTH AMERICA: TUMOR ABLATION MARKET, BY TECHNOLOGY 
    4.3 EUROPE: TUMOR ABLATION MARKET, BY APPLICATION 
    4.4 ASIA PACIFIC: TUMOR ABLATION MARKET, BY END USER 
    4.5 GEOGRAPHIC SNAPSHOT OF TUMOR ABLATION MARKET 
 
5 MARKET OVERVIEW (Page No. - 44)
    5.1 INTRODUCTION 
    5.2 MARKET DYNAMICS 
           5.2.1 DRIVERS
                    5.2.1.1 Increasing cancer incidence and rising geriatric population
                    5.2.1.2 Rising focus on minimally invasive procedures
                    5.2.1.3 Technological advancements in field of tumor ablation
                    5.2.1.4 Rising number of awareness campaigns and early detection
           5.2.2 RESTRAINTS
                    5.2.2.1 High cost of tumor ablation systems
                    5.2.2.2 Unfavorable regulatory scenario
           5.2.3 OPPORTUNITIES
                    5.2.3.1 Rising healthcare expenditure across emerging economies
                    5.2.3.2 Increasing number of hospitals
           5.2.4 CHALLENGES
                    5.2.4.1 Rising adoption of refurbished tumor ablation systems
                    5.2.4.2 Hospital budget cuts
    5.3 REGULATORY ANALYSIS 
           5.3.1 KEY REGULATORY BODIES AND GOVERNMENT AGENCIES
           5.3.2 KEY REGULATORY GUIDELINES
                    5.3.2.1 US
                    5.3.2.2 Canada
                    5.3.2.3 Europe
                    5.3.2.4 Asia Pacific
                               5.3.2.4.1 Japan
                               5.3.2.4.2 China
                               5.3.2.4.3 India
                    5.3.2.5 Latin America
                               5.3.2.5.1 Brazil
    5.4 REIMBURSEMENT SCENARIO 
    5.5 VALUE CHAIN ANALYSIS 
           5.5.1 RESEARCH & DEVELOPMENT
           5.5.2 MANUFACTURING & ASSEMBLY
           5.5.3 DISTRIBUTION, MARKETING & SALES, AND POST-SALES SERVICES
    5.6 SUPPLY CHAIN ANALYSIS 
           5.6.1 PROMINENT COMPANIES
           5.6.2 SMALL AND MEDIUM-SIZED ENTERPRISES
           5.6.3 END USERS
    5.7 ECOSYSTEM ANALYSIS 
    5.8 INVESTMENT & FUNDING SCENARIO 
    5.9 PRICING ANALYSIS 
    5.10 TRADE ANALYSIS 
    5.11 PATENT ANALYSIS 
    5.12 PORTER’S FIVE FORCE ANALYSIS 
           5.12.1 THREAT OF NEW ENTRANTS
           5.12.2 THREAT OF SUBSTITUTES
           5.12.3 BARGAINING POWER OF SUPPLIERS
           5.12.4 BARGAINING POWER OF BUYERS
           5.12.5 INTENSITY OF COMPETITIVE RIVALRY
    5.13 KEY CONFERENCES & EVENTS IN 2024–2025 
    5.14 CASE STUDY ANALYSIS 
    5.15 TECHNOLOGY ANALYSIS 
           5.15.1 KEY TECHNOLOGIES
                    5.15.1.1 Radiofrequency ablation and microwave ablation
                    5.15.1.2 Cryoablation
           5.15.2 COMPLEMENTARY TECHNOLOGIES
                    5.15.2.1 Laparoscopy
                    5.15.2.2 Diagnostic imaging
           5.15.3 ADJACENT TECHNOLOGIES
                    5.15.3.1 Electrosurgery
    5.16 TRENDS/DISRUPTIONS IMPACTING CUSTOMERS’ BUSINESSES 
    5.17 KEY STAKEHOLDERS & BUYING CRITERIA 
           5.17.1 KEY STAKEHOLDERS IN BUYING PROCESS
           5.17.2 BUYING CRITERIA
    5.18 UNMET NEEDS & KEY PAIN POINTS 
 
6 TUMOR ABLATION MARKET, BY TECHNOLOGY (Page No. - 74)
    6.1 INTRODUCTION 
    6.2 RADIOFREQUENCY ABLATION 
           6.2.1 LOW COST OF RADIOFREQUENCY ABLATION TO CONTRIBUTE TO MARKET GROWTH
    6.3 MICROWAVE ABLATION 
           6.3.1 ADVANTAGES OF MICROWAVE ABLATION TO BOOST MARKET GROWTH
    6.4 CRYOABLATION 
           6.4.1 HIGH SAFETY AND EFFICACY OF CRYOABLATION TO BOOST MARKET
    6.5 HIGH-INTENSITY-FOCUSED ULTRASOUND (HIFU) 
           6.5.1 TECHNOLOGICAL ADVANCEMENTS IN ULTRASOUND ABLATION TO FAVOR MARKET GROWTH
    6.6 OTHER TECHNOLOGIES 
 
7 TUMOR ABLATION MARKET, BY PRODUCT TYPE (Page No. - 80)
    7.1 INTRODUCTION 
    7.2 GENERATORS 
           7.2.1 RISING ADOPTION OF TUMOR ABLATION SYSTEMS TO PROPEL MARKET GROWTH
    7.3 PROBES/ELECTRODES 
           7.3.1 RADIOFREQUENCY ABLATION PROBES
                    7.3.1.1 Rising adoption of radiofrequency ablation systems for multiple applications to propel market growth
           7.3.2 MICROWAVE ABLATION PROBES
                    7.3.2.1 Increasing cancer prevalence and precise ablation to boost adoption
           7.3.3 OTHER PROBES/ELECTRODES
 
8 TUMOR ABLATION MARKET, BY MODE OF TREATMENT (Page No. - 85)
    8.1 INTRODUCTION 
    8.2 SURGICAL ABLATION 
           8.2.1 RISING UTILIZATION OF SURGICAL ABLATION IN END-USER FACILITIES TO PROPEL MARKET
    8.3 LAPAROSCOPIC ABLATION 
           8.3.1 IMPROVED SUCCESS RATE AND REAL-TIME VISUALIZATION TO BOOST DEMAND
    8.4 PERCUTANEOUS ABLATION 
           8.4.1 SHORTER RECOVERY TIME AND COST-EFFECTIVENESS OF PROCEDURE TO DRIVE SEGMENT
 
9 TUMOR ABLATION MARKET, BY APPLICATION (Page No. - 90)
    9.1 INTRODUCTION 
    9.2 LIVER CANCER 
           9.2.1 PROMISING OUTCOMES OF ABLATION IN TREATING HCC TO DRIVE MARKET
    9.3 LUNG CANCER 
           9.3.1 RISING INCIDENCE OF LUNG CANCER TO FUEL MARKET
    9.4 KIDNEY CANCER 
           9.4.1 RISING PREVALENCE OF KIDNEY CANCER AND MINIMAL DAMAGE OF HEALTHY TISSUE TO DRIVE ADOPTION
    9.5 BONE CANCER 
           9.5.1 RISING USE OF ABLATION TECHNIQUES TO TREAT OSTEOID OSTEOMA TO BOOST GROWTH
    9.6 OTHER APPLICATIONS 
 
10 TUMOR ABLATION MARKET, BY END USER (Page No. - 95)
     10.1 INTRODUCTION 
     10.2 HOSPITALS & CLINICS 
             10.2.1 INCREASING ADOPTION OF ADVANCED TUMOR ABLATION SYSTEMS TO PROPEL MARKET
     10.3 CANCER CARE CENTERS 
             10.3.1 GROWING ESTABLISHMENT OF CANCER CARE CENTERS TO FUEL MARKET
     10.4 OTHER END USERS 
 
11 TUMOR ABLATION MARKET, BY REGION (Page No. - 99)
     11.1 INTRODUCTION 
     11.2 NORTH AMERICA 
             11.2.1 NORTH AMERICA: RECESSION IMPACT
             11.2.2 US
                        11.2.2.1 Rising prevalence of cancer to propel market growth
             11.2.3 CANADA
                        11.2.3.1 Growing burden of cancer to support market growth
     11.3 EUROPE 
             11.3.1 EUROPE: RECESSION IMPACT
             11.3.2 GERMANY
                        11.3.2.1 Highly developed healthcare infrastructure and rising disease incidence to ensure strong growth prospects
             11.3.3 FRANCE
                        11.3.3.1 Growing geriatric population to support market growth in France
             11.3.4 UK
                        11.3.4.1 Growing target patient population to support market growth in UK
             11.3.5 ITALY
                        11.3.5.1 Rising awareness to support market growth
             11.3.6 SPAIN
                        11.3.6.1 Increasing government funding for research to support market growth
             11.3.7 REST OF EUROPE
     11.4 ASIA PACIFIC 
             11.4.1 ASIA PACIFIC: RECESSION IMPACT
             11.4.2 JAPAN
                        11.4.2.1 Presence of universal healthcare reimbursement scenario to drive market growth
             11.4.3 CHINA
                        11.4.3.1 Increasing patient pool and government initiatives for healthcare development to fuel market growth
             11.4.4 INDIA
                        11.4.4.1 Ongoing modernization and infrastructure development in India to support market growth
             11.4.5 AUSTRALIA
                        11.4.5.1 Rising research investments and awareness campaigns to support market growth
             11.4.6 SOUTH KOREA
                        11.4.6.1 Rising R&D and promising clinical trials to positively impact market growth
             11.4.7 REST OF ASIA PACIFIC
     11.5 LATIN AMERICA 
             11.5.1 LATIN AMERICA: RECESSION IMPACT
             11.5.2 BRAZIL
                        11.5.2.1 Modernization of healthcare facilities in Brazil to boost market
             11.5.3 MEXICO
                        11.5.3.1 Availability of advanced care and increasing awareness programs to fuel market growth in Mexico
             11.5.4 REST OF LATIN AMERICA
     11.6 MIDDLE EAST & AFRICA 
             11.6.1 IMPROVING HEALTHCARE INFRASTRUCTURE AND INCREASING PUBLIC-PRIVATE INVESTMENTS TO DRIVE MARKET GROWTH
             11.6.2 MIDDLE EAST & AFRICA: RECESSION IMPACT
 
12 COMPETITIVE LANDSCAPE (Page No. - 127)
     12.1 OVERVIEW 
     12.2 KEY PLAYER STRATEGIES/RIGHT TO WIN 
             12.2.1 OVERVIEW OF STRATEGIES ADOPTED BY PLAYERS IN TUMOR ABLATION MARKET
     12.3 REVENUE ANALYSIS 
     12.4 MARKET SHARE ANALYSIS 
     12.5 COMPANY EVALUATION MATRIX: KEY PLAYERS, 2023 
             12.5.1 STARS
             12.5.2 EMERGING LEADERS
             12.5.3 PERVASIVE PLAYERS
             12.5.4 PARTICIPANTS
             12.5.5 COMPANY FOOTPRINT: KEY PLAYERS, 2023
                        12.5.5.1 Company footprint
                        12.5.5.2 Technology footprint
                        12.5.5.3 Region footprint
     12.6 COMPANY EVALUATION MATRIX: STARTUPS/SMES, 2023 
             12.6.1 PROGRESSIVE COMPANIES
             12.6.2 RESPONSIVE COMPANIES
             12.6.3 DYNAMIC COMPANIES
             12.6.4 STARTING BLOCKS
             12.6.5 COMPETITIVE BENCHMARKING: STARTUPS/SMES, 2023
     12.7 COMPANY VALUATION & FINANCIAL METRICS 
             12.7.1 FINANCIAL METRICS
             12.7.2 COMPANY VALUATION
     12.8 BRAND/PRODUCT COMPARISON 
     12.9 COMPETITIVE SCENARIO 
             12.9.1 PRODUCT LAUNCHES/APPROVALS
             12.9.2 DEALS
             12.9.3 EXPANSIONS
 
13 COMPANY PROFILES (Page No. - 142)
     13.1 KEY PLAYERS 
             13.1.1 MEDTRONIC PLC
                        13.1.1.1 Business overview
                        13.1.1.2 Products offered
                        13.1.1.3 Recent developments
                                     13.1.1.3.1 Product approvals
                        13.1.1.4 MnM view
                                     13.1.1.4.1 Right to win
                                     13.1.1.4.2 Strategic choices
                                     13.1.1.4.3 Weaknesses & competitive threats
             13.1.2 JOHNSON & JOHNSON MEDTECH (ETHICON)
                        13.1.2.1 Business overview
                        13.1.2.2 Products offered
                        13.1.2.3 MnM view
                                     13.1.2.3.1 Right to win
                                     13.1.2.3.2 Strategic choices
                                     13.1.2.3.3 Weaknesses & competitive threats
             13.1.3 STRYKER CORPORATION
                        13.1.3.1 Business overview
                        13.1.3.2 Products offered
                        13.1.3.3 Recent developments
                                     13.1.3.3.1 Product approvals
                                     13.1.3.3.2 Expansions
                        13.1.3.4 MnM view
                                     13.1.3.4.1 Right to win
                                     13.1.3.4.2 Strategic choices
                                     13.1.3.4.3 Weaknesses & competitive threats
             13.1.4 VARIAN MEDICAL SYSTEMS, INC.
                        13.1.4.1 Business overview
                        13.1.4.2 Products offered
                        13.1.4.3 Recent developments
                                     13.1.4.3.1 Product launches
                                     13.1.4.3.2 Deals
             13.1.5 ANGIODYNAMICS, INC.
                        13.1.5.1 Business overview
                        13.1.5.2 Products offered
                        13.1.5.3 Recent developments
                                     13.1.5.3.1 Deals
             13.1.6 BOSTON SCIENTIFIC CORPORATION
                        13.1.6.1 Business overview
                        13.1.6.2 Products offered
             13.1.7 EDAP TMS S.A.
                        13.1.7.1 Business overview
                        13.1.7.2 Products offered
             13.1.8 MERMAID MEDICAL
                        13.1.8.1 Business overview
                        13.1.8.2 Products offered
             13.1.9 CANYON MEDICAL INC.
                        13.1.9.1 Business overview
                        13.1.9.2 Products offered
             13.1.10 OLYMPUS CORPORATION
                        13.1.10.1 Business overview
                        13.1.10.2 Products offered
                        13.1.10.3 Recent developments
                                     13.1.10.3.1 Product launches
             13.1.11 CHONGQING HAIFU MEDICAL TECHNOLOGY CO., LTD.
                        13.1.11.1 Business overview
                        13.1.11.2 Products offered
             13.1.12 MERIT MEDICAL SYSTEMS, INC.
                        13.1.12.1 Business overview
                        13.1.12.2 Products offered
             13.1.13 BIOVENTUS INC.
                        13.1.13.1 Business overview
                        13.1.13.2 Products offered
                        13.1.13.3 Recent developments
                                     13.1.13.3.1 Deals
             13.1.14 ICECURE MEDICAL LTD.
                        13.1.14.1 Business overview
                        13.1.14.2 Products offered
                        13.1.14.3 Recent developments
                                     13.1.14.3.1 Product approvals
                                     13.1.14.3.2 Deals
             13.1.15 CONMED CORPORATION
                        13.1.15.1 Business overview
                        13.1.15.2 Products offered
     13.2 OTHER PLAYERS 
             13.2.1 MONTERIS MEDICAL
             13.2.2 MIANYANG SONIC ELECTRONIC
             13.2.3 RF MEDICAL
             13.2.4 MINIMAX MEDICAL HOLDING GROUP
             13.2.5 SONABLATE
             13.2.6 ECO MEDICAL TECHNOLOGY (NANJING) CO., LTD.
             13.2.7 STARMED CO., LTD.
             13.2.8 SURGNOVA
             13.2.9 CREO MEDICAL
             13.2.10 MEDSPHERE SHANGHAI
 
14 APPENDIX (Page No. - 184)
     14.1 DISCUSSION GUIDE 
     14.2 KNOWLEDGESTORE: MARKETSANDMARKETS’  SUBSCRIPTION PORTAL 
     14.3 CUSTOMIZATION OPTIONS 
     14.4 RELATED REPORTS 
     14.5 AUTHOR DETAILS 
 
 
LIST OF TABLES (146 TABLES)
 
TABLE 1 NORTH AMERICA: LIST OF REGULATORY BODIES AND GOVERNMENT AGENCIES
TABLE 2 EUROPE: LIST OF REGULATORY BODIES AND GOVERNMENT AGENCIES
TABLE 3 ASIA PACIFIC: LIST OF REGULATORY BODIES AND GOVERNMENT AGENCIES
TABLE 4 LATIN AMERICA: LIST OF REGULATORY BODIES AND GOVERNMENT AGENCIES
TABLE 5 MIDDLE EAST & AFRICA: LIST OF REGULATORY BODIES AND GOVERNMENT AGENCIES
TABLE 6 US FDA: MEDICAL DEVICE CLASSIFICATION
TABLE 7 US: MEDICAL DEVICE REGULATORY APPROVAL PROCESS
TABLE 8 CANADA: MEDICAL DEVICE REGULATORY APPROVAL PROCESS
TABLE 9 JAPAN: PMDA CLASSIFICATION OF ABLATION DEVICES
TABLE 10 JAPAN: MEDICAL DEVICE CLASSIFICATION UNDER PHARMACEUTICAL AND MEDICAL DEVICE AGENCY (PMDA)
TABLE 11 CHINA: CLASSIFICATION OF MEDICAL DEVICES
TABLE 12 INDIA: CDSCO CLASSIFICATION OF ABLATION DEVICES
TABLE 13 MEDICAL REIMBURSEMENT CPT CODES FOR MICROWAVE AND RADIOFREQUENCY ABLATION PROCEDURES IN US (EFFECTIVE JANUARY 1, 2022)
TABLE 14 TUMOR ABLATION MARKET: ROLE IN ECOSYSTEM
TABLE 15 AVERAGE SELLING PRICE OF TUMOR ABLATION SYSTEMS, BY REGION, 2021–2023
TABLE 16 IMPORT DATA FOR TUMOR ABLATION SYSTEMS (HS CODE 9018), BY COUNTRY,  2019–2023 (USD THOUSAND)
TABLE 17 EXPORT DATA FOR TUMOR ABLATION SYSTEMS (HS CODE 9018), BY COUNTRY,  2018–2022 (USD THOUSAND)
TABLE 18 PORTER’S FIVE FORCES ANALYSIS: TUMOR ABLATION MARKET
TABLE 19 LIST OF MAJOR CONFERENCES & EVENTS IN TUMOR ABLATION MARKET, 2024–2025
TABLE 20 CASE STUDY 1: RADIOFREQUENCY ABLATION ANALYSIS CASE STUDY
TABLE 21 CASE STUDY 2: ABLATION OF LOCALIZED RENAL TUMOR
TABLE 22 INFLUENCE OF STAKEHOLDERS ON BUYING PROCESS (%)
TABLE 23 KEY BUYING CRITERIA FOR TUMOR ABLATION SYSTEMS
TABLE 24 TUMOR ABLATION MARKET: CURRENT UNMET NEEDS
TABLE 25 TUMOR ABLATION MARKET, BY TECHNOLOGY, 2022–2029 (USD MILLION)
TABLE 26 RADIOFREQUENCY ABLATION MARKET, BY REGION, 2022–2029 (USD MILLION)
TABLE 27 MICROWAVE ABLATION MARKET, BY REGION, 2022–2029 (USD MILLION)
TABLE 28 CRYOABLATION MARKET, BY REGION, 2022–2029 (USD MILLION)
TABLE 29 HIGH-INTENSITY-FOCUSED ULTRASOUND MARKET, BY REGION, 2022–2029 (USD MILLION)
TABLE 30 OTHER TUMOR ABLATION TECHNOLOGIES MARKET, BY REGION, 2022–2029 (USD MILLION)
TABLE 31 TUMOR ABLATION MARKET, BY PRODUCT TYPE, 2022–2029 (USD MILLION)
TABLE 32 TUMOR ABLATION MARKET, BY TECHNOLOGY, 2022–2029 (UNITS)
TABLE 33 TUMOR ABLATION GENERATORS MARKET, BY REGION, 2022–2029 (USD MILLION)
TABLE 34 RADIOFREQUENCY ABLATION PROBES MARKET, BY REGION, 2022–2029 (USD MILLION)
TABLE 35 MICROWAVE ABLATION PROBES MARKET, BY REGION, 2022–2029 (USD MILLION)
TABLE 36 OTHER TUMOR ABLATION PROBES/ELECTRODES MARKET, BY REGION, 2022–2029 (USD MILLION)
TABLE 37 TUMOR ABLATION MARKET, BY MODE OF TREATMENT, 2022–2029 (USD MILLION)
TABLE 38 TUMOR ABLATION MARKET FOR SURGICAL ABLATION, BY REGION, 2022–2029 (USD MILLION)
TABLE 39 TUMOR ABLATION MARKET FOR LAPAROSCOPIC ABLATION, BY REGION, 2022–2029 (USD MILLION)
TABLE 40 TUMOR ABLATION MARKET FOR PERCUTANEOUS ABLATION, BY REGION, 2022–2029 (USD MILLION)
TABLE 41 TUMOR ABLATION MARKET, BY APPLICATION, 2022–2029 (USD MILLION)
TABLE 42 TUMOR ABLATION MARKET FOR LIVER CANCER, BY REGION, 2022–2029 (USD MILLION)
TABLE 43 TUMOR ABLATION MARKET FOR LUNG CANCER, BY REGION, 2022–2029 (USD MILLION)
TABLE 44 TUMOR ABLATION MARKET FOR KIDNEY CANCER, BY REGION,  2022–2029 (USD MILLION)
TABLE 45 TUMOR ABLATION MARKET FOR BONE CANCER, BY REGION, 2022–2029 (USD MILLION)
TABLE 46 TUMOR ABLATION MARKET FOR OTHER APPLICATIONS, BY REGION, 2022–2029 (USD MILLION)
TABLE 47 TUMOR ABLATION MARKET, BY END USER, 2022–2029 (USD MILLION)
TABLE 48 TUMOR ABLATION MARKET FOR HOSPITALS & CLINICS, BY REGION, 2022–2029 (USD MILLION)
TABLE 49 TUMOR ABLATION MARKET FOR CANCER CARE CENTERS, BY REGION, 2022–2029 (USD MILLION)
TABLE 50 TUMOR ABLATION MARKET FOR OTHER END USERS, BY REGION, 2022–2029 (USD MILLION)
TABLE 51 TUMOR ABLATION MARKET, BY REGION, 2022–2029 (USD MILLION)
TABLE 52 NORTH AMERICA: TUMOR ABLATION MARKET, BY COUNTRY, 2022–2029 (USD MILLION)
TABLE 53 NORTH AMERICA: TUMOR ABLATION MARKET, BY TECHNOLOGY, 2022–2029 (USD MILLION)
TABLE 54 NORTH AMERICA: TUMOR ABLATION MARKET, BY PRODUCT TYPE, 2022–2029 (USD MILLION)
TABLE 55 NORTH AMERICA: TUMOR ABLATION MARKET, BY MODE OF TREATMENT, 2022–2029 (USD MILLION)
TABLE 56 NORTH AMERICA: TUMOR ABLATION MARKET, BY APPLICATION, 2022–2029 (USD MILLION)
TABLE 57 NORTH AMERICA: TUMOR ABLATION MARKET, BY END USER, 2022–2029 (USD MILLION)
TABLE 58 US: TUMOR ABLATION MARKET, BY TECHNOLOGY, 2022–2029 (USD MILLION)
TABLE 59 CANADA: TUMOR ABLATION MARKET, BY TECHNOLOGY, 2022–2029 (USD MILLION)
TABLE 60 EUROPE: TUMOR ABLATION MARKET, BY COUNTRY, 2022–2029 (USD MILLION)
TABLE 61 EUROPE: TUMOR ABLATION MARKET, BY TECHNOLOGY, 2022–2029 (USD MILLION)
TABLE 62 EUROPE: TUMOR ABLATION MARKET, BY PRODUCT TYPE, 2022–2029 (USD MILLION)
TABLE 63 EUROPE: TUMOR ABLATION MARKET, BY MODE OF TREATMENT, 2022–2029 (USD MILLION)
TABLE 64 EUROPE: TUMOR ABLATION MARKET, BY APPLICATION, 2022–2029 (USD MILLION)
TABLE 65 EUROPE: TUMOR ABLATION MARKET, BY END USER, 2022–2029 (USD MILLION)
TABLE 66 GERMANY: TUMOR ABLATION MARKET, BY TECHNOLOGY, 2022–2029 (USD MILLION)
TABLE 67 FRANCE: TUMOR ABLATION MARKET, BY TECHNOLOGY, 2022–2029 (USD MILLION)
TABLE 68 UK: TUMOR ABLATION MARKET, BY TECHNOLOGY, 2022–2029 (USD MILLION)
TABLE 69 ITALY: TUMOR ABLATION MARKET, BY TECHNOLOGY, 2022–2029 (USD MILLION)
TABLE 70 SPAIN: TUMOR ABLATION MARKET, BY TECHNOLOGY, 2022–2029 (USD MILLION)
TABLE 71 REST OF EUROPE: TUMOR ABLATION MARKET, BY TECHNOLOGY, 2022–2029 (USD MILLION)
TABLE 72 ASIA PACIFIC: TUMOR ABLATION MARKET, BY COUNTRY, 2022–2029 (USD MILLION)
TABLE 73 ASIA PACIFIC: TUMOR ABLATION MARKET, BY TECHNOLOGY, 2022–2029 (USD MILLION)
TABLE 74 ASIA PACIFIC: TUMOR ABLATION MARKET, BY PRODUCT TYPE, 2022–2029 (USD MILLION)
TABLE 75 ASIA PACIFIC: TUMOR ABLATION MARKET, BY MODE OF TREATMENT, 2022–2029 (USD MILLION)
TABLE 76 ASIA PACIFIC: TUMOR ABLATION MARKET, BY APPLICATION, 2022–2029 (USD MILLION)
TABLE 77 ASIA PACIFIC: TUMOR ABLATION MARKET, BY END USER, 2022–2029 (USD MILLION)
TABLE 78 JAPAN: TUMOR ABLATION MARKET, BY TECHNOLOGY, 2022–2029 (USD MILLION)
TABLE 79 CHINA: TUMOR ABLATION MARKET, BY TECHNOLOGY, 2022–2029 (USD MILLION)
TABLE 80 INDIA: TUMOR ABLATION MARKET, BY TECHNOLOGY, 2022–2029 (USD MILLION)
TABLE 81 AUSTRALIA: TUMOR ABLATION MARKET, BY TECHNOLOGY, 2022–2029 (USD MILLION)
TABLE 82 SOUTH KOREA: TUMOR ABLATION MARKET, BY TECHNOLOGY, 2022–2029 (USD MILLION)
TABLE 83 REST OF ASIA PACIFIC: TUMOR ABLATION MARKET, BY TECHNOLOGY, 2022–2029 (USD MILLION)
TABLE 84 LATIN AMERICA: TUMOR ABLATION MARKET, BY COUNTRY, 2022–2029 (USD MILLION)
TABLE 85 LATIN AMERICA: TUMOR ABLATION MARKET, BY TECHNOLOGY, 2022–2029 (USD MILLION)
TABLE 86 LATIN AMERICA: TUMOR ABLATION MARKET, BY PRODUCT TYPE, 2022–2029 (USD MILLION)
TABLE 87 LATIN AMERICA: TUMOR ABLATION MARKET, BY MODE OF TREATMENT, 2022–2029 (USD MILLION)
TABLE 88 LATIN AMERICA: TUMOR ABLATION MARKET, BY APPLICATION, 2022–2029 (USD MILLION)
TABLE 89 LATIN AMERICA: TUMOR ABLATION MARKET, BY END USER, 2022–2029 (USD MILLION)
TABLE 90 BRAZIL: TUMOR ABLATION MARKET, BY TECHNOLOGY, 2022–2029 (USD MILLION)
TABLE 91 MEXICO: TUMOR ABLATION MARKET, BY TECHNOLOGY, 2022–2029 (USD MILLION)
TABLE 92 REST OF LATIN AMERICA: TUMOR ABLATION MARKET, BY TECHNOLOGY, 2022–2029 (USD MILLION)
TABLE 93 MIDDLE EAST & AFRICA: TUMOR ABLATION MARKET, BY TECHNOLOGY, 2022–2029 (USD MILLION)
TABLE 94 MIDDLE EAST & AFRICA: TUMOR ABLATION MARKET, BY PRODUCT TYPE, 2022–2029 (USD MILLION)
TABLE 95 MIDDLE EAST & AFRICA: TUMOR ABLATION MARKET, BY MODE OF TREATMENT,  2022–2029 (USD MILLION)
TABLE 96 MIDDLE EAST & AFRICA: TUMOR ABLATION MARKET, BY APPLICATION, 2022–2029 (USD MILLION)
TABLE 97 MIDDLE EAST & AFRICA: TUMOR ABLATION MARKET, BY END USER, 2022–2029 (USD MILLION)
TABLE 98 OVERVIEW OF STRATEGIES DEPLOYED BY KEY MANUFACTURING COMPANIES
TABLE 99 TUMOR ABLATION TECHNOLOGY MARKET: DEGREE OF COMPETITION
TABLE 100 TUMOR ABLATION MARKET: TECHNOLOGY FOOTPRINT
TABLE 101 TUMOR ABLATION MARKET: REGION FOOTPRINT
TABLE 102 TUMOR ABLATION MARKET: DETAILED LIST OF KEY STARTUP/SME PLAYERS
TABLE 103 TUMOR ABLATION MARKET: COMPETITIVE BENCHMARKING OF KEY EMERGING PLAYERS/STARTUPS
TABLE 104 TUMOR ABLATION MARKET: PRODUCT LAUNCHES, JANUARY 2021–MARCH 2024
TABLE 105 TUMOR ABLATION MARKET: DEALS, JANUARY 2021–MARCH 2024
TABLE 106 TUMOR ABLATION MARKET: EXPANSIONS, JANUARY 2021–MARCH 2024
TABLE 107 MEDTRONIC PLC: COMPANY OVERVIEW
TABLE 108 MEDTRONIC PLC: PRODUCTS OFFERED
TABLE 109 MEDTRONIC PLC: PRODUCT APPROVALS
TABLE 110 JOHNSON & JOHNSON MEDTECH: COMPANY OVERVIEW
TABLE 111 JOHNSON & JOHNSON MEDTECH: PRODUCTS OFFERED
TABLE 112 STRYKER CORPORATION: COMPANY OVERVIEW
TABLE 113 STRYKER CORPORATION: PRODUCTS OFFERED
TABLE 114 STRYKER CORPORATION: PRODUCT APPROVALS
TABLE 115 STRYKER CORPORATION: EXPANSIONS
TABLE 116 VARIAN MEDICAL SYSTEMS, INC.: COMPANY OVERVIEW
TABLE 117 VARIAN MEDICAL SYSTEMS, INC.: PRODUCTS OFFERED
TABLE 118 VARIAN MEDICAL SYSTEMS, INC.: PRODUCT LAUNCHES
TABLE 119 VARIAN MEDICAL SYSTEMS, INC.: DEALS
TABLE 120 ANGIODYNAMICS, INC.: COMPANY OVERVIEW
TABLE 121 ANGIODYNAMICS, INC.: PRODUCTS OFFERED
TABLE 122 ANGIODYNAMICS, INC.: DEALS
TABLE 123 BOSTON SCIENTIFIC CORPORATION: COMPANY OVERVIEW
TABLE 124 BOSTON SCIENTIFIC CORPORATION: PRODUCTS OFFERED
TABLE 125 EDAP TMS S.A.: COMPANY OVERVIEW
TABLE 126 EDAP TMS S.A.: PRODUCTS OFFERED
TABLE 127 MERMAID MEDICAL: COMPANY OVERVIEW
TABLE 128 MERMAID MEDICAL: PRODUCTS OFFERED
TABLE 129 CANYON MEDICAL INC.: COMPANY OVERVIEW
TABLE 130 CANYON MEDICAL INC.: PRODUCTS OFFERED
TABLE 131 OLYMPUS CORPORATION: COMPANY OVERVIEW
TABLE 132 OLYMPUS CORPORATION: PRODUCTS OFFERED
TABLE 133 OLYMPUS CORPORATION: PRODUCT LAUNCHES
TABLE 134 CHONGQING HAIFU MEDICAL TECHNOLOGY CO., LTD.: COMPANY OVERVIEW
TABLE 135 CHONGQING HAIFU MEDICAL TECHNOLOGY CO., LTD.: PRODUCTS OFFERED
TABLE 136 MERIT MEDICAL SYSTEMS, INC.: COMPANY OVERVIEW
TABLE 137 MERIT MEDICAL SYSTEMS, INC.: PRODUCTS OFFERED
TABLE 138 BIOVENTUS INC.: COMPANY OVERVIEW
TABLE 139 BIOVENTUS INC.: PRODUCTS OFFERED
TABLE 140 BIOVENTUS INC.: DEALS
TABLE 141 ICECURE MEDICAL LTD.: COMPANY OVERVIEW
TABLE 142 ICECURE MEDICAL LTD.: PRODUCTS OFFERED
TABLE 143 ICECURE MEDICAL LTD.: PRODUCT APPROVALS
TABLE 144 ICECURE MEDICAL LTD.: DEALS
TABLE 145 CONMED CORPORATION: COMPANY OVERVIEW
TABLE 146 CONMED CORPORATION: PRODUCTS OFFERED
 
 
LIST OF FIGURES (56 FIGURES)
 
FIGURE 1 RESEARCH DESIGN
FIGURE 2 BREAKDOWN OF PRIMARY INTERVIEWS: SUPPLY-SIDE AND DEMAND-SIDE PARTICIPANTS
FIGURE 3 BREAKDOWN OF PRIMARY INTERVIEWS: BY COMPANY TYPE, DESIGNATION, AND REGION
FIGURE 4 RESEARCH METHODOLOGY: HYPOTHESIS BUILDING
FIGURE 5 TUMOR ABLATION MARKET SIZE ESTIMATION: APPROACH 1 (COMPANY REVENUE ESTIMATION)
FIGURE 6 TUMOR ABLATION MARKET SIZE ESTIMATION: BOTTOM-UP APPROACH
FIGURE 7 CAGR PROJECTION: SUPPLY-SIDE ANALYSIS
FIGURE 8 DATA TRIANGULATION METHODOLOGY
FIGURE 9 TUMOR ABLATION MARKET, TECHNOLOGY, 2024 VS. 2029 (USD MILLION)
FIGURE 10 TUMOR ABLATION MARKET, BY PRODUCT TYPE, 2024 VS. 2029 (USD MILLION)
FIGURE 11 TUMOR ABLATION MARKET, BY MODE OF TREATMENT, 2024 VS. 2029 (USD MILLION)
FIGURE 12 TUMOR ABLATION MARKET, BY APPLICATION, 2024 VS. 2029 (USD MILLION)
FIGURE 13 TUMOR ABLATION MARKET, BY END USER, 2024 VS. 2029 (USD MILLION)
FIGURE 14 TUMOR ABLATION MARKET: GEOGRAPHIC SNAPSHOT
FIGURE 15 RISING PREVALENCE OF CANCER TO DRIVE MARKET GROWTH
FIGURE 16 MICROWAVE ABLATION SEGMENT TO REGISTER SIGNIFICANT GROWTH IN NORTH AMERICA DURING FORECAST PERIOD
FIGURE 17 LIVER CANCER SEGMENT TO DOMINATE MARKET IN EUROPE DURING FORECAST PERIOD
FIGURE 18 HOSPITALS & CLINICS SEGMENT TO CONTINUE TO HOLD LARGEST SHARE IN ASIA PACIFIC MARKET
FIGURE 19 CHINA TO WITNESS HIGHEST GROWTH DURING FORECAST PERIOD
FIGURE 20 TUMOR ABLATION MARKET: DRIVERS, RESTRAINTS, OPPORTUNITIES, AND CHALLENGES
FIGURE 21 PREMARKET NOTIFICATION: 510(K) APPROVALS FOR MEDICAL DEVICES
FIGURE 22 CANADA: REGULATORY APPROVAL PROCESS FOR MEDICAL DEVICES
FIGURE 23 EUROPE: CE APPROVAL PROCESS FOR MEDICAL DEVICES
FIGURE 24 TUMOR ABLATION MARKET: VALUE CHAIN ANALYSIS
FIGURE 25 TUMOR ABLATION MARKET: SUPPLY CHAIN ANALYSIS
FIGURE 26 TUMOR ABLATION MARKET: ECOSYSTEM ANALYSIS
FIGURE 27 NUMBER OF INVESTOR DEALS IN TUMOR ABLATION MARKET, BY KEY PLAYER, 2018–2022
FIGURE 28 VALUE OF INVESTOR DEALS IN TUMOR ABLATION MARKET, BY KEY PLAYER, 2018–2022 (USD MILLION)
FIGURE 29 AVERAGE SELLING PRICE TREND OF TUMOR ABLATION SYSTEMS, BY TECHNOLOGY
FIGURE 30 AVERAGE SELLING PRICE TREND OF TUMOR ABLATION SYSTEMS, BY REGION
FIGURE 31 PATENT DETAILS FOR TUMOR ABLATION MARKET  (JANUARY 2013– DECEMBER 2023)
FIGURE 32 REVENUE SHIFT IN TUMOR ABLATION MARKET
FIGURE 33 INFLUENCE OF STAKEHOLDERS ON BUYING PROCESS FOR TOP THREE CATEGORIES
FIGURE 34 KEY BUYING CRITERIA FOR PROCESS TUMOR ABLATION SYSTEMS
FIGURE 35 NORTH AMERICA: TUMOR ABLATION MARKET SNAPSHOT
FIGURE 36 ASIA PACIFIC: TUMOR ABLATION MARKET SNAPSHOT
FIGURE 37 REVENUE ANALYSIS OF TOP THREE PLAYERS IN TUMOR ABLATION MARKET (2021–2023)
FIGURE 38 MARKET SHARE ANALYSIS OF KEY PLAYERS (2023)
FIGURE 39 TUMOR ABLATION MARKET: COMPANY EVALUATION MATRIX (KEY PLAYERS), 2023
FIGURE 40 TUMOR ABLATION MARKET: COMPANY FOOTPRINT
FIGURE 41 TUMOR ABLATION MARKET: COMPANY EVALUATION MATRIX (STARTUPS/SMES), 2023
FIGURE 42 EV/EBITDA OF KEY VENDORS
FIGURE 43 YEAR-TO-DATE (YTD) PRICE TOTAL RETURN AND 5-YEAR STOCK BETA OF  KEY VENDORS
FIGURE 44 BRAND/PRODUCT COMPARATIVE ANALYSIS
FIGURE 45 MEDTRONIC PLC: COMPANY SNAPSHOT (2023)
FIGURE 46 JOHNSON & JOHNSON MEDTECH: COMPANY SNAPSHOT (2022)
FIGURE 47 STRYKER CORPORATION: COMPANY SNAPSHOT (2023)
FIGURE 48 VARIAN MEDICAL SYSTEMS, INC.: COMPANY SNAPSHOT (2023)
FIGURE 49 ANGIODYNAMICS, INC.: COMPANY SNAPSHOT (2023)
FIGURE 50 BOSTON SCIENTIFIC CORPORATION: COMPANY SNAPSHOT (2023)
FIGURE 51 EDAP TMS S.A.: COMPANY SNAPSHOT (2023)
FIGURE 52 OLYMPUS CORPORATION: COMPANY SNAPSHOT (2023)
FIGURE 53 MERIT MEDICAL SYSTEMS, INC.: COMPANY SNAPSHOT (2022)
FIGURE 54 BIOVENTUS INC.: COMPANY SNAPSHOT (2023)
FIGURE 55 ICECURE MEDICAL LTD.: COMPANY SNAPSHOT (2023)
FIGURE 56 CONMED CORPORATION: COMPANY SNAPSHOT (2023)

The study involved four major activities in estimating the current size of the tumor ablation market. Exhaustive secondary research was done to collect information on the market, peer, and parent markets. The next step was to validate these findings, assumptions, and sizing with industry experts across the value chain through primary research. Both top-down and bottom-up approaches were employed to estimate the complete market size. After that, market breakdown and data triangulation were used to estimate the market size of segments and subsegments.

Secondary Research

The secondary research process involves the widespread use of secondary sources, directories, databases (such as Bloomberg Businessweek, Factiva, and D&B Hoovers), white papers, annual reports, company house documents, investor presentations, and SEC filings of companies. Secondary research was used to identify and collect information useful for the extensive, technical, market-oriented, and commercial tumor ablation market study. It was also used to obtain important information about the key players and market classification & segmentation according to industry trends to the bottom-most level, and key developments related to market and technology perspectives. A database of the key industry leaders was also prepared using secondary research.

Primary Research

In the primary research process, various supply and demand sources were interviewed to obtain qualitative and quantitative information for this report. The primary sources from the supply side include industry experts such as CEOs, vice presidents, marketing and sales directors, technology & innovation directors, and related key executives from various key companies and organizations in the tumor ablation market. The primary sources from the demand side include hospitals, clinics, retailers, and other end users. Primary research was conducted to validate the market segmentation, identify key players, and gather insights on key industry trends & key market dynamics.  

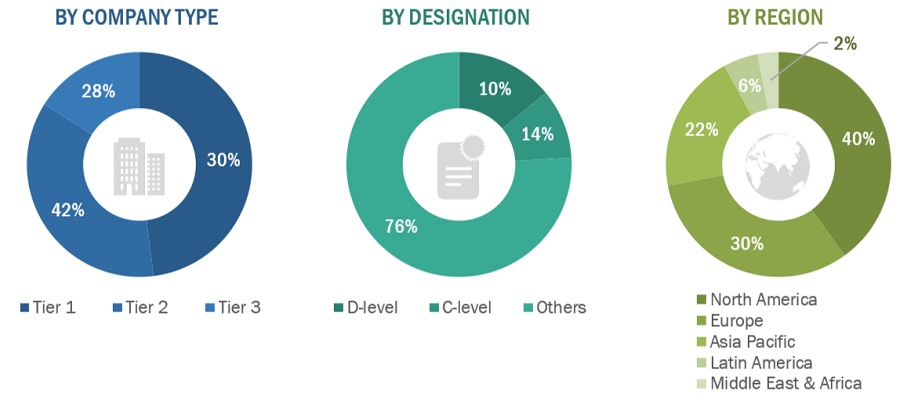
A breakdown of the primary respondents is provided below:
Tumor Ablation Market Size, and Share

*Others include sales managers, marketing managers, business development managers, product managers, distributors, and suppliers.

The tiers of the companies are defined based on their total revenue. As of 2023: Tier 1 => USD 1 billion, Tier 2 = USD 200-500 million to USD 1 billion, and Tier 3 =< USD 200 million

To know about the assumptions considered for the study, download the pdf brochure

Market Estimation Methodology

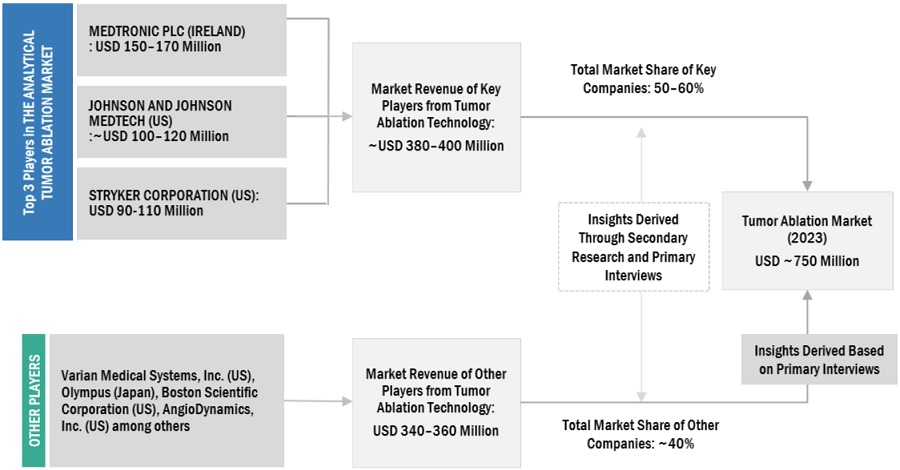
In this report, the tumor ablation market’s size was determined using the revenue share analysis of leading players. For this purpose, key players in the market were identified, and their revenues from the market business were determined through various insights gathered during the primary and secondary research phases. Secondary research included the study of the annual and financial reports of the top market players. In contrast, primary research included extensive interviews with key opinion leaders, such as CEOs, directors, and key marketing executives.

Segmental revenues were calculated based on the revenue mapping of major solution/service providers to calculate the global market value. This process involved the following steps:

  • Generating a list of major global players operating in the tumor ablation market.
  • Mapping annual revenues generated by major global players from the product segment (or nearest reported business unit/product category)
  • Revenue mapping of major players to cover a major share of the global market share, as of 2022
  • Extrapolating the global value of the tumor ablation market industry

Bottom-up approach

In this report, the size of the global tumor ablation market was determined using the revenue share analysis of leading players. For this purpose, key players in the market were identified, and their revenues from the tumor ablation business were determined through various insights gathered during the primary and secondary research phases. Secondary research included the study of the annual and financial reports of the top market players. In contrast, primary research included extensive interviews with key opinion leaders, such as CEOs, directors, and marketing executives.

Approach 1: Company revenue estimation approach

To calculate the global market value, segmental revenues were calculated based on the revenue mapping of major solution/product providers. This process involved the following steps:

  • Generating a list of major global players operating in the tumor ablation market
  • Mapping the annual revenues generated by major global players from the tumor ablation segment (or the nearest reported business unit/product category)
  • Mapping the revenues of major players to cover at least 50-55% of the global market share as of 2023
  • Extrapolating the global value of the tumor ablation industry

Market Size Estimation For Tumor Ablation: Approach 1 (Company Revenue Estimation)I
Tumor Ablation Market Size, and Share

To know about the assumptions considered for the study, Request for Free Sample Report

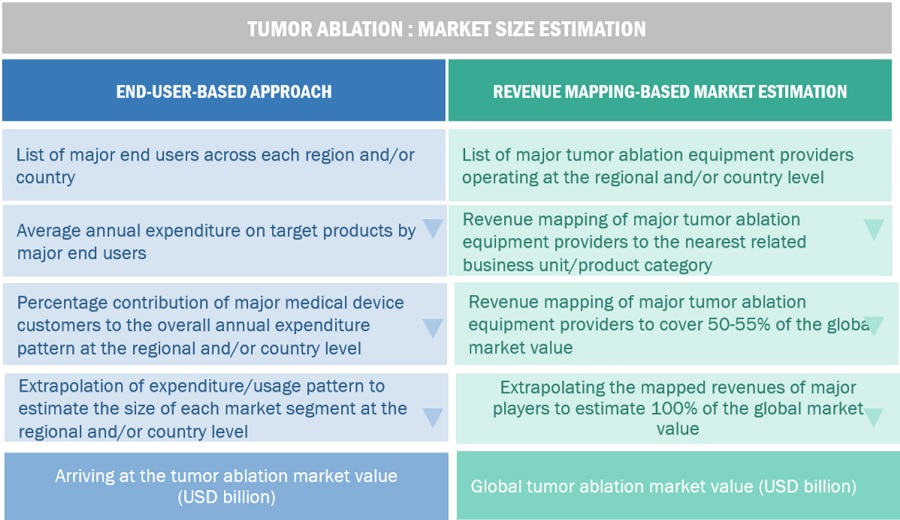
Approach 2: Customer-based market estimation

During preliminary secondary research, the total sales revenue of tumor ablation was estimated and validated at the regional and country level, triangulated, and validated to estimate the global market value. This process involved the following steps:

  • Generating a list of major customer facilities across each region and country
  • Identifying the average number of tumor ablation product supplies used by major customer facilities across each product type at the regional/country level, annually
  • Identifying the percentage contribution of major customer facilities to the overall tumor ablation expenditure and usage at the regional/country level, annually
  • Extrapolating the annual usage patterns for various products across major customer facilities to estimate the size of each product segment at the regional/country level, annually
  • Identifying the percentage contributions of individual market segments and subsegments to the overall tumor ablation market at the regional/country level

Tumor Ablation Market Size Estimation: Bottom-Up Approach
Tumor Ablation Market Size, and Share

Source: MarketsandMarkets Analysis

Data Triangulation

After arriving at the overall market size from the market size estimation process explained above, the global tumor ablation market was split into segments and subsegments. Data triangulation and market breakdown procedures were employed to complete the overall market engineering process and arrive at the exact statistics for all segments and subsegments. The data was triangulated by studying various factors and trends from both the demand and supply sides. Additionally, the tumor ablation market was validated using top-down and bottom-up approaches.

Market Definition

Tumor ablation is a minimally invasive surgical procedure used to remove or destroy cancerous tissue from the affected area as part of cancer management and treatment. The targeted tissue is subjected to ablating energy through surgical, laparoscopic, or percutaneous methods. This technique is commonly used for treating liver, bone, lung, kidney, prostate, and other types of cancer.

Key Stakeholders

  • Tumor ablation product manufacturers
  • Original equipment manufacturers (OEMs)
  • Suppliers, distributors, and channel partners
  • Healthcare service providers
  • Hospitals and academic medical centers
  • Interventional radiologists
  • Research laboratories
  • Health insurance providers
  • Government bodies/organizations
  • Regulatory bodies
  • Medical research institutes
  • Business research and consulting service providers
  • Venture capitalists and other public-private funding agencies
  • Market research and consulting firms

Objectives of the Study

  • To define, describe, and forecast the tumor ablation market based on technology, product type, mode of treatment, application, end user, and region
  • To provide detailed information regarding the major factors influencing the growth of the market (drivers, restraints, opportunities, and challenges)
  • To strategically analyze micro markets with respect to individual growth trends, prospects, and contributions to the total market
  • To analyze opportunities in the market for stakeholders and provide details of the competitive landscape for market leaders
  • To forecast the revenue of the market segments with respect to five regions, namely, North America, Europe, the Asia Pacific, Latin America, Middle East and Africa
  • To profile the key players and comprehensively analyze their market ranking and core competencies
  • To benchmark players within the market using a proprietary competitive leadership mapping framework, which analyzes market players on various parameters within the broad categories of  market share and product footprint

Available Customizations

With the given market data, MarketsandMarkets offers customizations per the company’s specific needs. The following customization options are available for the present global tumor ablation market report:

Product Analysis

  • Product matrix, which gives a detailed comparison of the product portfolios of the top five companies

Company Information

  • Detailed analysis and profiling of additional market players (up to five)

Geographic Analysis

  • Further breakdown of the Rest of Europe tumor ablation market into Russia, Belgium, the Netherlands, Switzerland, Austria, Finland, Sweden, Poland, and Portugal, among others
  • Further breakdown of the Rest of Asia Pacific tumor ablation market into Singapore, Taiwan, New Zealand, Philippines, Malaysia, and other APAC countries
  • Further breakdown of the Rest of Latin America (RoLATAM), which comprises Argentina, Chile, Peru, Colombia, and Cuba
Custom Market Research Services

We will customize the research for you, in case the report listed above does not meet with your exact requirements. Our custom research will comprehensively cover the business information you require to help you arrive at strategic and profitable business decisions.

Request Customization

Instant Answers with GPT - Ask Now!

Ask real questions. Get complete answers !
Report Code
MD 3271
Published ON
May, 2024
Choose License Type
BUY NOW
  • SHARE
X
Request Customization
Speak to Analyst
Speak to Analyst
OR FACE-TO-FACE MEETING
PERSONALIZE THIS RESEARCH
  • Triangulate with your Own Data
  • Get Data as per your Format and Definition
  • Gain a Deeper Dive on a Specific Application, Geography, Customer or Competitor
  • Any level of Personalization
REQUEST A FREE CUSTOMIZATION
LET US HELP YOU!
  • What are the Known and Unknown Adjacencies Impacting the Tumor Ablation Market
  • What will your New Revenue Sources be?
  • Who will be your Top Customer; what will make them switch?
  • Defend your Market Share or Win Competitors
  • Get a Scorecard for Target Partners
CUSTOMIZED WORKSHOP REQUEST
  • Call Us
  • +1-888-600-6441 (Corporate office hours)
  • +1-888-600-6441 (US/Can toll free)
  • +44-800-368-9399 (UK office hours)
CONNECT WITH US
ABOUT TRUST ONLINE
©2024 MarketsandMarkets Research Private Ltd. All rights reserved
DMCA.com Protection Status Website Feedback