
Veterinary Biologics Market Size, Growth, Share & Trends Analysis
Veterinary Biologics Market by Product (Monoclonal Antibodies, Diagnostic Kits, Immunoglobulins & Antitoxins), RoA (Injectable, Oral), Application (Infectious Disease Prevention, Dermatology, Pain Management), Animal, End User - Global Forecast to 2030


OVERVIEW
Source: Secondary Research, Interviews with Experts, MarketsandMarkets Analysis
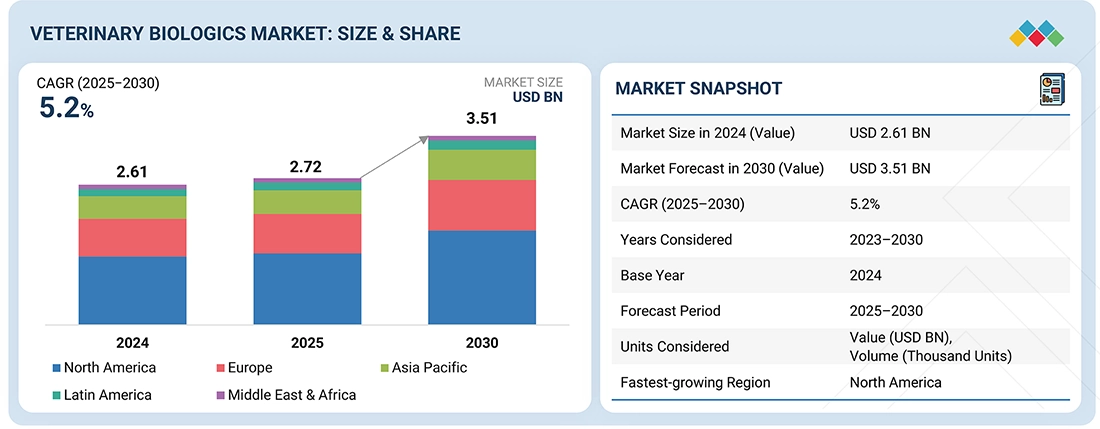
The global veterinary biologics market is projected to reach USD 3.51 billion by 2030 from USD 2.72 billion in 2025, growing at a CAGR of 5.2% during the forecast period. The market growth is fueled by increasing demand for effective animal therapeutics, rising populations of livestock and companion animals, and greater awareness of animal health and disease prevention. Moreover, with the growing prevalence of zoonotic diseases and a stronger focus on food safety, the use of veterinary biologics is becoming essential for both livestock management and caring for companion animals.
KEY TAKEAWAYS
-
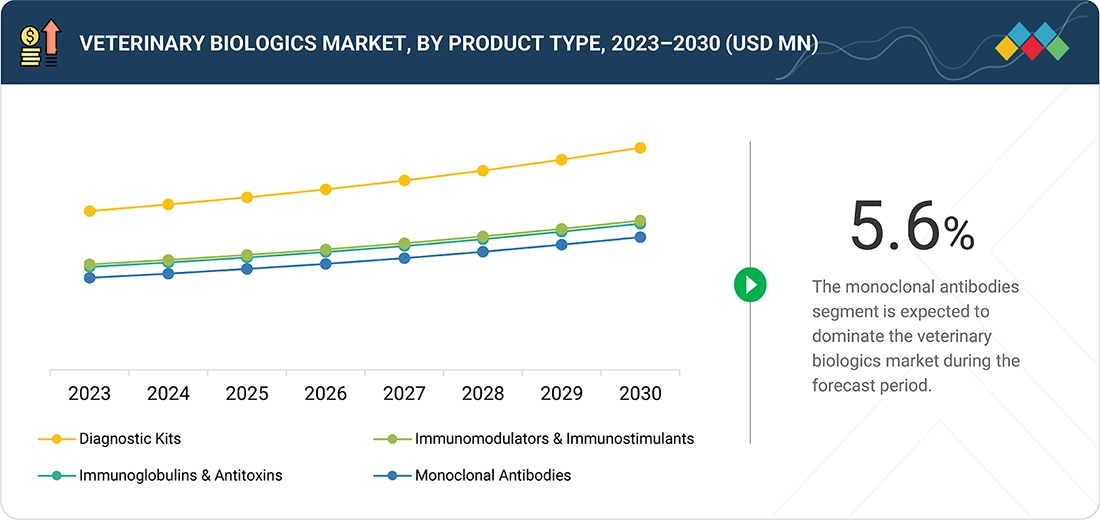
BY PRODUCT TYPEBy product type, the market is segmented into monoclonal antibodies, immunoglobulins & antitoxins, immunomodulators & immunostimulants, and diagnostic kits. Monoclonal antibodies represent the leading product segment, driven by their precision, strong therapeutic efficacy, and rising use in managing both infectious and chronic diseases in animals. Their ability to deliver targeted treatment with minimal side effects makes them highly preferred over traditional therapies.
-
BY ANIMAL TYPEBy animal type, the market is segmented into companion animals and livestock animals. The companion animals segment accounts for a larger market share, driven by the rising global pet population, increasing awareness about preventive healthcare, and early disease diagnosis in pets such as dogs and cats, which is boosting demand for advanced biologics. Additionally, the surge in zoonotic disease concerns has accelerated the adoption of biologics to protect both pet and human health safety.
-
BY ROUTE OF ADMINISTRATIONBy route of administration, the market is segmented into injectable route of administration, oral route of administration, and other routes of administration. The injectable segment held the largest market share due to its high efficacy, quick onset of action, and accurate dosing. Injectable biologics are commonly used in both livestock and companion animals to prevent and treat infectious diseases. The segment’s growth is further boosted by advancements in needle-free injection technologies and the increasing emphasis on disease control programs in veterinary care.
-
BY APPLICATIONBy application, the market is divided into infectious disease prevention, dermatology, oncology, pain management, diagnostic testing, and other applications. The dermatology segment holds the largest share of the veterinary biologics market, driven by the increasing prevalence of skin infections and allergies among companion animals. Growing awareness about pet health, along with the rising demand for advanced biologic therapies for conditions like dermatitis, further boosts this segment growth.
-
BY END USERBy end user, the market is segmented into veterinary hospitals & clinics, veterinary diagnostic labs, and other end users. The veterinary hospitals and clinics segment held the largest market share, driven by the rising number of companion animals, increased awareness of preventive healthcare, and growing demand for specialized biologics and vaccines. Hospitals and clinics provide professional administration of biologics, ensuring proper dosing, safety, and effectiveness, which further boosts the segment’s dominance.
-
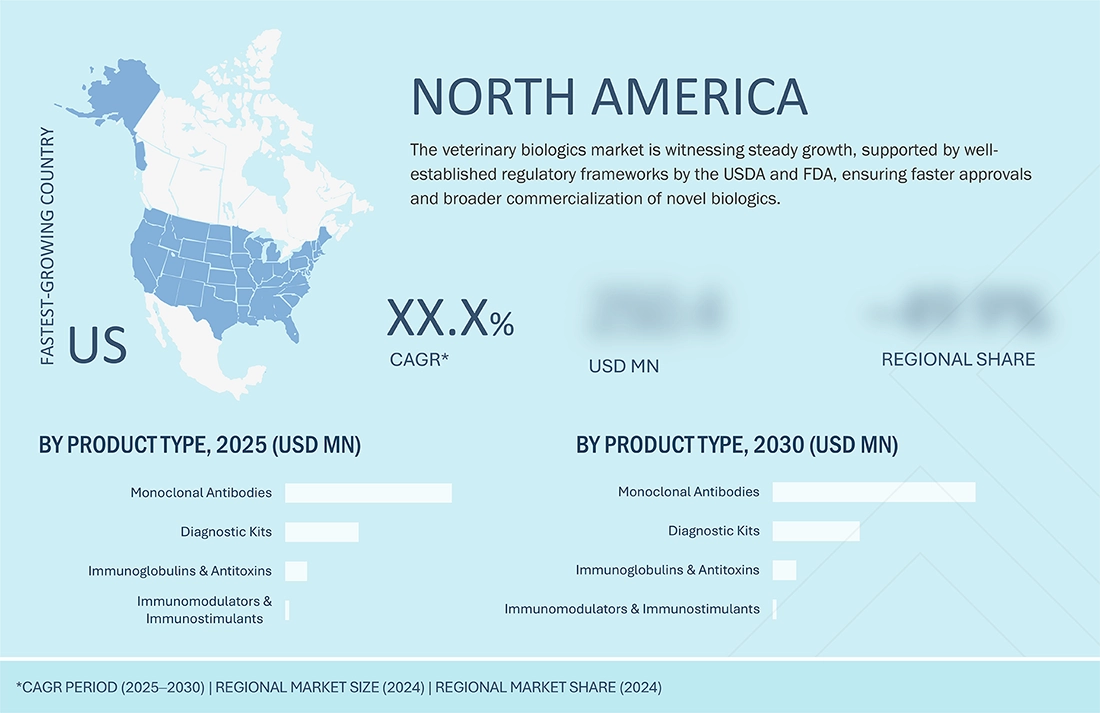
BY REGIONThe North American region is expected to witness the highest growth in the veterinary biologics market during the forecast period. This growth is driven by the increasing companion population, and growing awareness of animal health and disease prevention. Additionally, favorable government initiatives, investments in veterinary healthcare infrastructure, and the early approval and adoption of advanced biologics in US and Canada are fueling market expansion in the region.
-
COMPETITIVE LANDSCAPEThe major market players have adopted both organic and inorganic strategies, including partnerships and collaborations. For instance, in September 2024, Zoetis Services LLC (US) partnered with the Arthritis Foundation (US) to raise awareness about osteoarthritis (OA) pain in pets. Through this partnership, Zoetis highlights Librela, its FDA-approved, once-monthly injectable monoclonal antibody for dogs, as a breakthrough therapy for managing OA pain, promoting better mobility and quality of life.
The veterinary biologics market is expected to grow significantly in the coming years, fueled by the expanding populations of livestock and pets and the increasing demand for effective animal health solutions. As infectious diseases become more common and awareness of preventive healthcare rises, livestock farms and veterinary clinics are increasingly adopting biologics to improve animal health, productivity, and food safety. Supportive government policies, higher investments in veterinary healthcare infrastructure, and the focus on disease prevention and biosecurity further boost the market, making veterinary biologics a vital part of modern animal health management.
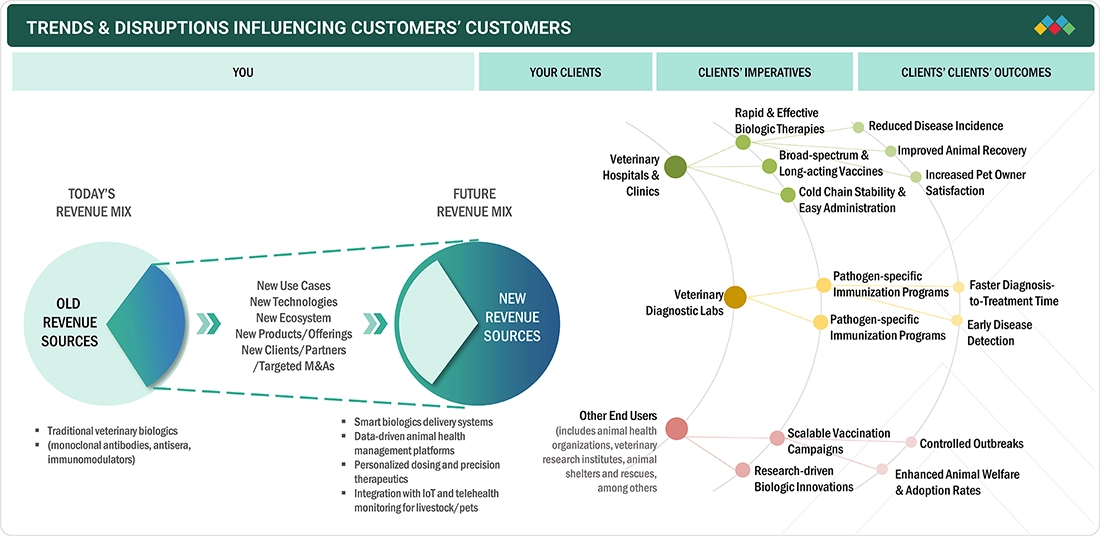
TRENDS & DISRUPTIONS IMPACTING CUSTOMERS' CUSTOMERS
The veterinary biologics market is shifting from traditional biologics like monoclonal antibodies, antisera, and immunomodulators toward smarter, more connected solutions. While current revenue mainly depends on one-time product sales, the future emphasizes data-driven delivery systems, personalized dosing, and IoT-enabled monitoring as key growth drivers. Veterinary clients, including pharmaceutical companies, specialty clinics, and livestock managers, prioritize regulatory compliance, enhanced therapeutic accuracy, remote monitoring support, and streamlined biologics administration. These efforts lead to better outcomes for animals, such as improved health, safer treatments, quicker interventions, and personalized care plans, while also lowering costs and operational complexity.
Source: Secondary Research, Interviews with Experts, MarketsandMarkets Analysis
MARKET DYNAMICS
Level
-
Surge in companion animal population and pet ownership

-
Increasing incidence of infectious zoonotic diseases

Level
-
High cost of veterinary diagnostic tests

-
Regulatory hurdles and long approval timelines

Level
-
Untapped growth potential in emerging economies

-
Evolving landscape of strategic collaborations and acquisitions

Level
-
Limited awareness and shortage of trained veterinarians in low-income countries

-
Stringent regulatory requirements for licensing veterinary biologics

Source: Secondary Research, Interviews with Experts, MarketsandMarkets Analysis
Driver: Surge in companion animal population and pet ownership
Urbanization and evolving lifestyles have significantly boosted pet ownership across the globe, especially in countries like India, Brazil, and the United States. This trend is fueled by increasing disposable incomes, the desire for emotional companionship, and changing perceptions of pets as family members. As a result, there is higher spending on preventive care and wellness, which in turn drives demand for veterinary treatments and products such as diagnostic kits, monoclonal antibody therapies, and immunomodulatory treatments that are crucial for pet health. The worldwide population of companion animals, including dogs and cats, has grown substantially in both developed areas like North America and emerging markets such as India and China. According to the 2023-2024 National Pet Owners Survey by the American Pet Products Association, about 66% of American households—approximately 86.9 million—own a pet, further fueling growth in the veterinary biologics sector and the larger pet care market.
Restraint: High cost of veterinary diagnostic tests
The high cost of advanced diagnostic tests and imaging systems poses a significant obstacle to adopting veterinary diagnostics. In the US, public health spending on rabies diagnostics, prevention, and control ranges from USD 245 million to 510 million annually, covering vaccination, testing, and biologics for rabies prevention, although the total expense, including healthcare and animal control, is even higher. Veterinary diagnostic imaging equipment is also expensive, with portable devices costing between USD 2,000 and 50,000, and additional accessories such as transducer probes and printers increasing costs. Since most veterinary practices are small or medium-sized with limited budgets, these high expenses, combined with the lack of reimbursement for veterinary procedures, considerably limit the growth and adoption of veterinary biologics in the market.
Opportunity: Evolving landscape of strategic collaborations and acquisitions
The veterinary biologics market is gaining momentum amid a rapidly evolving landscape of strategic partnerships and acquisitions. Market players are increasingly forming synergistic collaborations to boost innovation, diversify therapeutic options, and expand globally. These changes are reshaping the competitive environment and opening new therapeutic areas and delivery platforms in animal health. One of the most notable moves in this market is Dechra Pharmaceuticals' acquisition of Invetx in July 2024. This acquisition reflects Dechra’s strategic goal to go beyond traditional small-molecule therapies and focus more on chronic and complex diseases in companion animals, such as osteoarthritis, inflammation, and dermatological issues.
Challenge: Stringent regulatory requirements for licensing veterinary biologics
The veterinary biologics market is heavily influenced by strict regulatory frameworks that govern the development, testing, approval, and distribution of products like antitoxins and monoclonal antibodies. Agencies such as the USDA (Center for Veterinary Biologics), EMA, and other national authorities require comprehensive safety, efficacy, and quality data before granting approvals. These standards often involve lengthy clinical trials, detailed documentation, and significant investment in quality assurance systems, making product development slow and expensive. Additionally, the lack of unified regulatory standards across countries complicates global commercialization. Manufacturers must navigate different approval processes in each region, which increases compliance costs and delays product launches.
Veterinary Biologics Market: COMMERCIAL USE CASES ACROSS INDUSTRIES
| COMPANY | USE CASE DESCRIPTION | BENEFITS |
|---|---|---|
 |
Development and commercialization of monoclonal antibody therapies for pets | Targeted treatments for chronic conditions like osteoarthritis, fewer side effects |
 |
Immunomodulatory therapies and dermatology-related biologics for companion animals | Long-lasting allergy relief, improved immune regulation |
 |
Biologics targeting chronic inflammatory and parasitic diseases | Better disease control, increased pet quality of life |
 |
Development of novel biologics for companion animals focusing on chronic diseases | Enhances quality of life, extends lifespan, personalized treatment options |
 |
Diagnostic testing kits and platforms for early disease detection | Early diagnosis, preventive care, improved treatment outcomes |
Logos and trademarks shown above are the property of their respective owners. Their use here is for informational and illustrative purposes only.
MARKET ECOSYSTEM
The veterinary biologics market ecosystem comprises a complex network of stakeholders, including manufacturers of diagnostic kits, monoclonal antibodies, and antitoxins, along with research institutions, regulatory authorities, distributors, veterinary healthcare providers, and end users such as clinics, hospitals, diagnostic labs, and government agencies. Innovation is fueled by R&D collaborations, advances in biotechnology, and rising demand for preventive animal healthcare. Regulatory agencies ensure safety and compliance, while distribution partners are vital for market access and cold chain logistics. This interconnected ecosystem is influenced by disease prevalence, trends in livestock and pet populations, and evolving animal health policies across regions.
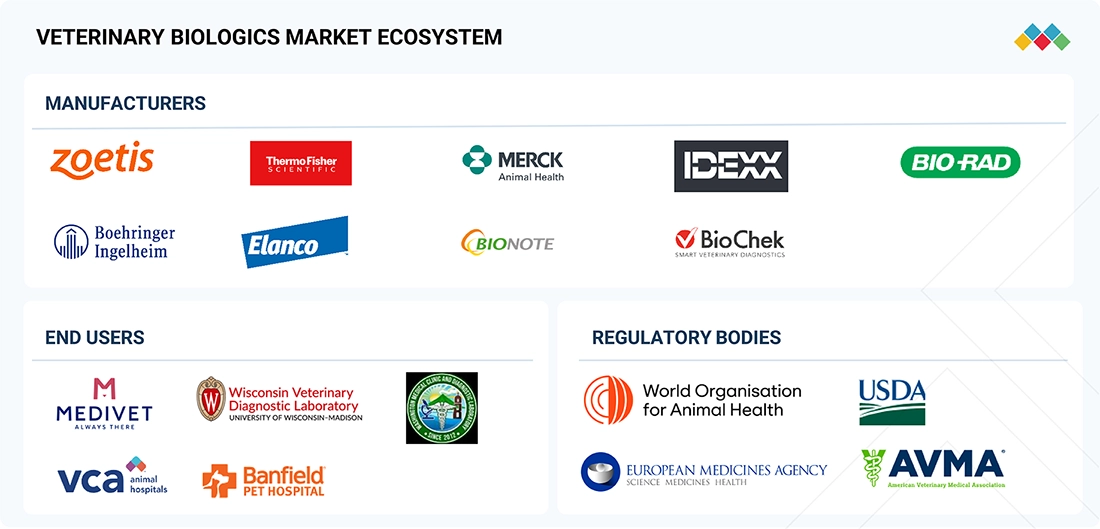
Logos and trademarks shown above are the property of their respective owners. Their use here is for informational and illustrative purposes only.
MARKET SEGMENTS
Source: Secondary Research, Interviews with Experts, MarketsandMarkets Analysis
Veterinary Biologics Market, By Product Type
In the veterinary biologics market, monoclonal antibodies hold the largest market share by product type because of their high specificity, effectiveness, and rising use in treating infectious and chronic conditions in animals. These biologics provide targeted therapy with fewer side effects compared to traditional drugs, leading to better treatment outcomes. Increasing R&D investments, regulatory approvals, and the broader application of monoclonal antibodies in both livestock and companion animals further strengthen their market dominance.
Veterinary Biologics Market, By Animal Type
In the veterinary biologics market, the livestock segment held a significant share due to high demand for diagnostics and immunological products that ensure herd health and productivity. Livestock such as cattle, poultry, and swine are essential for global food supply chains, making disease prevention and control a top priority. Rising meat and dairy consumption, along with government initiatives to curb zoonotic diseases and economic losses from outbreaks, further reinforce the dominance of livestock biologics over companion animal applications.
Veterinary Biologics Market, By Route of Administration
The injectable segment is expected to grow the fastest in the veterinary biologics market, driven by its effectiveness in providing quick and targeted immune responses. Injectables remain the preferred method for administering monoclonal antibodies and therapeutic biologics due to their higher bioavailability and controlled dosing. Rising demand for preventive care in livestock, especially against infectious diseases, is increasing the adoption of injectables. In companion animals, injectables are commonly used for dermatology and chronic disease management, further boosting their use. Additionally, ongoing innovations in long-acting injectables and combination biologics are enhancing treatment convenience and adherence. The strong pipeline of injectable veterinary biologics and expanding regulatory approvals are likely to accelerate market growth.
Veterinary Biologics Market, By Application
The dermatology segment held the largest share in the veterinary biologics market, driven by the high prevalence of chronic skin conditions in companion animals. The introduction of monoclonal antibody-based biologics targeting chronic skin diseases has further boosted this segment’s growth. Additionally, rising pet ownership, increasing awareness of animal health, and pet owners' greater willingness to spend on advanced therapies are fueling adoption. Furthermore, ongoing product innovations are improving accessibility and supporting market growth.
Veterinary Biologics Market, By End User
In the veterinary biologics market, veterinary hospitals and clinics hold the largest share by end user because they serve as the primary point of care for both companion animals and livestock. These facilities are the main channels for delivering diagnostics and advanced biologic therapies, supported by well-trained veterinary professionals and established infrastructure. The growing pet population, increased awareness of preventive healthcare, and rising expenditure on animal health further reinforce the dominance of hospitals and clinics in this segment.
REGION
North America is expected to be the fastest-growing region in the global veterinary biologics market during the forecast period.
North America is the fastest-growing region in the veterinary biologics market, fueled by the prominent presence of leading companies, strong R&D efforts, and widespread use of advanced monoclonal antibody therapies for companion animals. Additionally, rising pet ownership, a well-established veterinary infrastructure, and favorable reimbursement policies drive the adoption of high-cost biologics. Moreover, the increasing prevalence of zoonotic diseases and chronic conditions in animals is boosting the demand for targeted biologic treatments. Ongoing regulatory approvals and strategic collaborations among biopharma companies continue to support market growth.
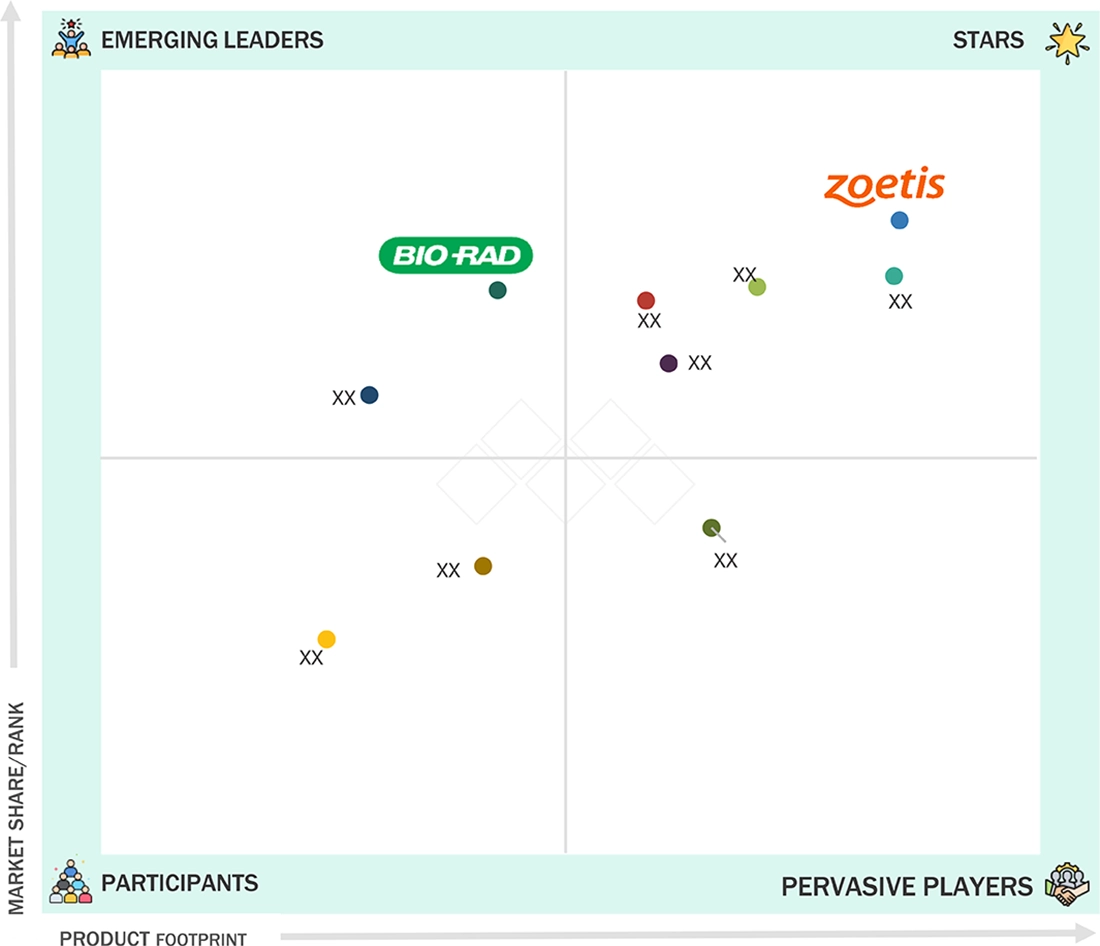
Veterinary Biologics Market: COMPANY EVALUATION MATRIX
In the veterinary biologics market matrix, Zoetis Services LLC (Star) leads with scale, widespread distribution, and a broad solutions portfolio. Bio-Rad Laboratories, Inc. (Emerging Leader) is gaining momentum with innovative diagnostic kits. While Zoetis dominates through extensive reach, Bio-Rad's innovation positions it for rapid growth toward the leaders’ quadrant.
Source: Secondary Research, Interviews with Experts, MarketsandMarkets Analysis
KEY MARKET PLAYERS
MARKET SCOPE
| REPORT METRIC | DETAILS |
|---|---|
| Market Size in 2024 (Value) | USD 2.61 Billion |
| Market Forecast in 2030 (Value) | USD 3.51 Billion |
| Growth Rate | CAGR of 5.2% from 2025-2030 |
| Years Considered | 2023–2030 |
| Base Year | 2024 |
| Forecast Period | 2025–2030 |
| Units Considered | Value (USD Million/Billion), Volume (Thousand units) |
| Report Coverage | Revenue forecast, company ranking, competitive landscape, growth factors, and trends |
| Segments Covered |
|
| Regions Covered | North America, Asia Pacific, Europe, Latin America, Middle East & Africa |
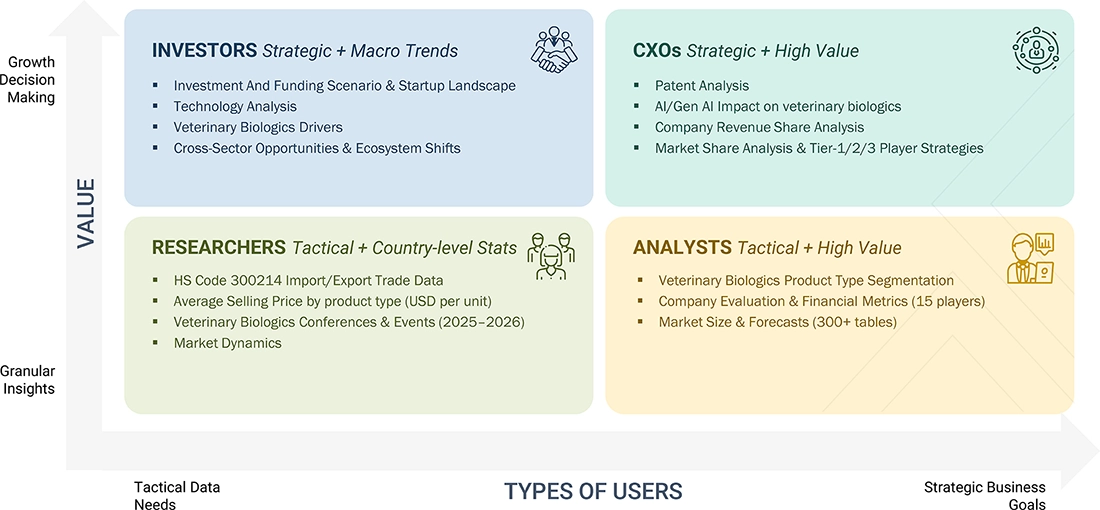
WHAT IS IN IT FOR YOU: Veterinary Biologics Market REPORT CONTENT GUIDE
DELIVERED CUSTOMIZATIONS
We have successfully delivered the following deep-dive customizations:
| CLIENT REQUEST | CUSTOMIZATION DELIVERED | VALUE ADDS |
|---|---|---|
| Product Analysis | Comparison of key veterinary biologics categories: monoclonal antibodies, Antisera, immunomodulators, and diagnostic kits | Identify biologic use-cases across species, storage/supply risks, and regulatory nuances |
| Company Information | Zoetis, Boehringer Ingelheim, Elanco, Merck Animal Health. Market share analysis of top 3–5 players in ASEAN & Europe | Competitive analysis for biologics portfolios, outsourcing trends in diagnostics & biologics, and localization strategies |
| Geographic Analysis | Detailed analysis for the Rest of Asia Pacific; the client is focused on ASEAN countries for country-level Veterinary Biologics market insights | Demand mapping for diagnostics and therapeutic biologics, local partnership potential, and biologics-specific regulatory assessment |
RECENT DEVELOPMENTS
- May 2025 : Zoetis Services LLC opened its largest diagnostics reference laboratory at the UPS Healthcare Labport in Louisville, Kentucky. This 32,000 sq. ft. facility, near UPS Worldport, enables rapid specimen processing and quicker diagnostic results for veterinarians across the country. The lab represents a major milestone in Zoetis Services LLC's dedication to advancing diagnostic services and improving animal care through cutting-edge technology, logistics, and expertise teams.
- October 2024 : Merck & Co., Inc. launched Gilvetmab (gil-VET-mab), a caninized monoclonal antibody for oncology-practicing veterinary specialists across the US. Gilvetmab previously received conditional license approval from the USDA Center for Veterinary Biologics (CVB) to treat dogs with mast cell tumors and melanoma.
- May 2023 : Zoetis Services LLC received FDA approval for Librela (bedinvetmab), the first and only monthly injectable monoclonal antibody targeting nerve growth factor (NGF) to control osteoarthritis pain in dogs. It offers lasting improvements in mobility and quality of life, as validated by clinical trials involving client-owned pets.
- May 2023 : Elanco introduced the first USDA conditionally approved monoclonal antibody treatment for canine parvovirus, a highly contagious and often deadly disease in puppies.
Table of Contents
 Exclusive indicates content/data unique to MarketsandMarkets and not available with any competitors.
Methodology
This study extensively used both primary and secondary sources. The research process examined various factors affecting the industry to identify segmentation types, industry trends, key players, competitive landscape, market dynamics, and strategies of major players.
Secondary Research
This research involved the use of comprehensive secondary sources, including directories; databases such as Bloomberg Business, Factiva, and Dun & Bradstreet; white papers; annual reports; company house documents; investor presentations; and SEC filings of companies. Secondary research was employed to gather information for an extensive, technical, market-focused, and commercial analysis of the veterinary biologics market. It also helped obtain crucial details about key players, market classification, and segmentation based on industry trends at the most detailed levels, as well as significant developments related to market and technology perspectives. Additionally, a database of major industry leaders was created using secondary research.
Primary Research
In the primary research process, various sources from both the supply and demand sides were interviewed to gather qualitative and quantitative information for this report. Primary sources from the supply side include project managers, sales managers, marketing managers, business development managers, presidents, CEOs, vice presidents, chairpersons, chief operating officers, chief strategy officers, directors, chief information officers, and chief medical information officers related to the veterinary biologics market. Primary sources from the demand side consist of professionals from veterinary hospitals and clinics, diagnostic labs, academic and research institutes, and pet owners.
A breakdown of the primary respondents is provided below:

Note 1: C-level primaries include CEOs, CFOs, COOs, and VPs.
Note 2: Other designations include sales managers, marketing managers, business development managers, product managers, distributors, and suppliers.
Note 3: Companies are classified into tiers based on their total revenue. As of 2024, Tier 1 = >USD 10.00 billion, Tier 2 = USD 1.00 billion to USD 10.00 billion, and Tier 3 = < USD 1.00 billion.
Source: MarketsandMarkets Analysis
To know about the assumptions considered for the study, download the pdf brochure
Market Size Estimation
The total size of the veterinary biologics market was determined through data triangulation from three different approaches, as outlined below. After each approach, a weighted average was calculated based on the level of assumptions used in each method.

Data Triangulation
After defining the market size, the total market was divided into several segments and subsegments. Data triangulation and market breakdown methods were used where applicable to complete the overall market analysis and determine accurate statistics for all segments and subsegments. The following figure illustrates the market validation, source structure, and data triangulation approach used in the market analysis process.
Market Definition
The veterinary biologics market includes all USDA-regulated biologic products, such as monoclonal antibodies, immunoglobulins, immunomodulators, and diagnostic kits, which are used for the prevention, diagnosis, or treatment of animal diseases. These products serve companion animals, livestock, and poultry across veterinary clinics, hospitals, diagnostic labs, and farm or herd settings, enabling veterinarians and animal health professionals to provide targeted immune-based interventions and rapid diagnostic testing. This allows infected animals to be identified quickly for faster treatment, containment, or herd management decisions.
Stakeholders
- Veterinary Biologics Manufacturers
- Animal Healthcare Product Manufacturers
- Veterinary Biologics Distributors and Wholesalers
- Animal Welfare Associations
- Veterinary Clinics and Care Centers
- Research And Consulting Firms
- Veterinary Research and Development Organizations
- Contract Manufacturing Organizations
- Venture Capitalists
Report Objectives
- To define, describe, and forecast the veterinary biologics market by product type, animal type, route of administration, application, end user, and region.
- To provide detailed information about the key factors, such as drivers, restraints, opportunities, challenges, and industry trends, influencing the market growth
- To strategically analyze the regulatory scenario, value chain analysis, supply chain analysis, Porter’s Five Forces analysis, ecosystem analysis, trade analysis, pricing analysis, patent analysis, impact of AI on veterinary biologics market, case study analysis, adjacent market analysis, unmet needs/end user expectations in veterinary biologics market, and trends/disruption impacting customer business in the market
- To analyze the micromarkets with respect to individual growth trends, prospects, and contributions to the overall market
- To strategically analyze the market in five regions: North America, Europe, the Asia Pacific, Latin America, and the Middle East & Africa
- To analyze market opportunities for stakeholders and provide details of the competitive landscape for key players
- To strategically profile the key players in this market and comprehensively analyze their market shares and core competencies
- To track and analyze competitive developments such as product launches and approvals, partnerships, and expansions in the market
Need a Tailored Report?
Customize this report to your needs
Get 10% FREE Customization
Customize This ReportPersonalize This Research
- Triangulate with your Own Data
- Get Data as per your Format and Definition
- Gain a Deeper Dive on a Specific Application, Geography, Customer or Competitor
- Any level of Personalization
Let Us Help You
- What are the Known and Unknown Adjacencies Impacting the Veterinary Biologics Market
- What will your New Revenue Sources be?
- Who will be your Top Customer; what will make them switch?
- Defend your Market Share or Win Competitors
- Get a Scorecard for Target Partners

Custom Market Research Services
We Will Customise The Research For You, In Case The Report Listed Above Does Not Meet With Your Requirements
Get 10% Free CustomisationTESTIMONIALS

JAYANT RAJPUROHIT
Director of Market Insights, Data and Analytics
SFI Health,
Leading Pharmaceutical Companywww.sfihealth.com/

We at SFI Health approached MarketsandMarkets for an Opportunity Assessment on "Incidence and Prevalence of Focus Indications" as we wanted to know the most attractive HCPs like Physician, Functional MD, Naturopath and Pharmacist. The project was critical for us to ensure our focus on the right target which would enable sustainable growth and profitability for SFI Health. The business insights provided exceeded our expectations and we were extremely impressed. The team at MarketsandMarkets is highly professional and detail oriented and very well understood our business needs. MarketsandMarkets offers a unique combination of expertise and dedicated engagement model. We identified 2 new products to be launched in coming months, based on the research findings provided by MarketsandMarkets. We are happy with the services and would strongly recommend MarketsandMarkets to my peers in the industry.

BEATRIZ DE LA CALLE
Head of Commercial Analytics
Qualicaps,
Leading Pharmaceutical Companywww.qualicaps.com/

We partnered with MarketsandMarkets for an assessment study on hard empty capsules. The team was extremely professional in understanding our business requirements and we received timely responses to all our queries. The market intelligence and the recommendations has met our business requirements. We were extremely impressed to see the final study results; it really exceeded our expectations. The market intelligence offered by MarketsandMarkets, and clarity on next steps will help us achieve our business objective for the Year 2021. We are happy with the services and would strongly recommend MarketsandMarkets to my peers in the industry.

Bob Williams,
Senior Director Business Development & Innovation
Bracco Diagnostics Inc.,
Italian Multinational in life sciences sector and a World Leader in imaging diagnosticsimaging.bracco.com/us-en
We were pleased with targeted insights that MarketsandMarkets identified from a custom study on the 'Radiation Dose Management Solutions Market'. Your team identified and characterized the market participants as well as underlying trends accurately. This study was useful to Bracco in formulating business strategies for our dose monitoring product lines and we thank MarketsandMarkets for the job well done.
Cody Coonradt,
Market Development and Strategy Manager
3M Health Information Systems,
Leader in Health care Coding, Payment & Analytics Solutions.www.3m.com/3M/en_US/health-information-systems-us
The value for our organization comes from three things: depth of research, specificity of segments and being easy to work with. As important as the first two are, the third can't be underestimated. MarketsandMarkets, maybe more than any other research vendor, wants to know what is top of mind for our team and what big questions we are grappling to answer.
Their customer first approach and high value engagement model, have given us great analysis and excellent value for money


Growth opportunities and latent adjacency in Veterinary Biologics Market