The virtual data room market research study involved extensive secondary sources, directories, journals, and paid databases. Primary sources were industry experts from the core and related industries, preferred virtual data room providers, third-party service providers, consulting service providers, end users, and other commercial enterprises. In-depth interviews were conducted with various primary respondents, including key industry participants and subject matter experts, to obtain and verify critical qualitative and quantitative information, and assess the market’s prospects.
Secondary Research
In the secondary research process, various sources were referred to, for identifying and collecting information for this study. Secondary sources included annual reports, press releases, and investor presentations of companies; white papers, journals, and certified publications; and articles from recognized authors, directories, and databases. The data was also collected from other secondary sources, such as journals, government websites, blogs, and vendors' websites. Additionally, virtual data room spending of various countries was extracted from the respective sources. Secondary research was mainly used to obtain key information related to the industry’s value chain and supply chain to identify key players based on software, services, market classification, and segmentation according to offerings of major players, industry trends related to software, deployment mode, services, document type, technology, application, end users, and regions, and key developments from both market- and technology-oriented perspectives.
Primary Research
In the primary research process, various primary sources from both the supply and demand sides were interviewed to obtain qualitative and quantitative information on the market. The primary sources from the supply side included various industry experts, including Chief Experience Officers (CXOs); Vice Presidents (VPs); directors from business development, marketing, and virtual data room expertise; related key executives from virtual data room solution vendors, SIs, professional service providers, and industry associations; and key opinion leaders.
Primary interviews were conducted to gather insights, such as market statistics, revenue data collected from software and services, market breakups, market size estimations, market forecasts, and data triangulation. Primary research also helped understand various trends related to technologies, applications, deployments, and regions. Stakeholders from the demand side, such as Chief Information Officers (CIOs), Chief Technology Officers (CTOs), Chief Strategy Officers (CSOs), and end users using virtual data room solutions, were interviewed to understand the buyer’s perspective on suppliers, products, service providers, and their current usage of virtual data room software and services, which would impact the overall virtual data room market.

To know about the assumptions considered for the study, download the pdf brochure
Market Size Estimation
In the bottom-up approach, the adoption rate of virtual data room solutions and services among different end users in key countries concerning their regions contributing the most to the market share was identified. For cross-validation, the adoption of virtual data room solutions and services among industries and different use cases concerning their regions was identified and extrapolated. Weightage was given to use cases identified in different regions for the market size calculation.
Based on the market numbers, the regional split was determined by primary and secondary sources. The procedure included the analysis of the virtual data room market’s regional penetration. Based on secondary research, the regional spending on Information and Communications Technology (ICT), socio-economic analysis of each country, strategic vendor analysis of major virtual data room providers, and organic and inorganic business development activities of regional and global players were estimated. With the data triangulation procedure and data validation through primaries, the exact values of the overall virtual data room market size and segments’ size were determined and confirmed using the study.
Global Virtual Data Room Market Size: Bottom-Up and Top-Down Approach:

Data Triangulation
Based on the market numbers, the regional split was determined by primary and secondary sources. The procedure included the analysis of the virtual data room market’s regional penetration. Based on secondary research, the regional spending on Information and Communications Technology (ICT), socio-economic analysis of each country, strategic vendor analysis of major virtual data room providers, and organic and inorganic business development activities of regional and global players were estimated. With the data triangulation procedure and data validation through primaries, the exact values of the overall virtual data room market size and segments’ size were determined and confirmed using the study.
Market Definition
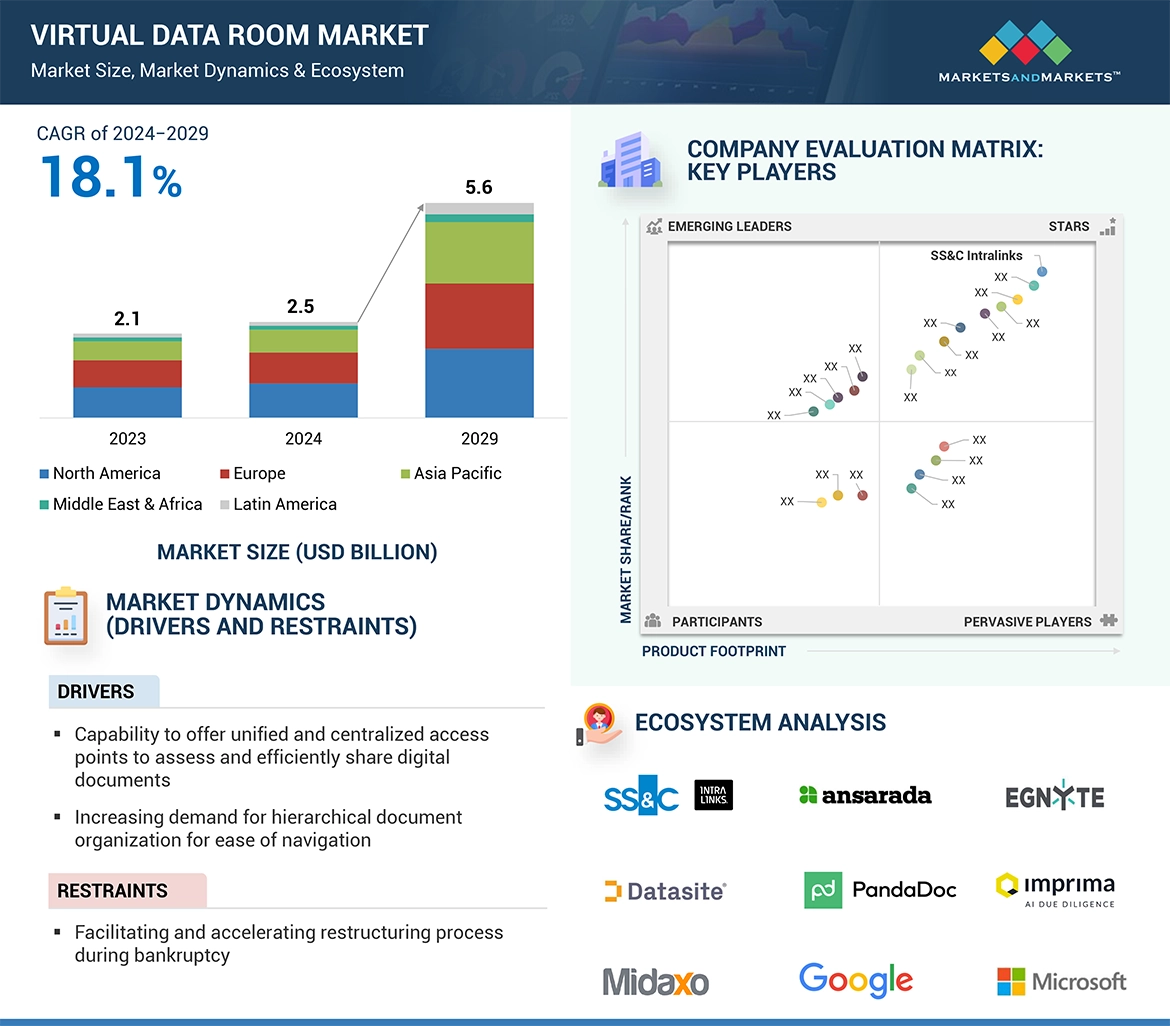
A virtual data room is a secure digital platform that allows easy and productive conduct of a high-value transaction such as merger, acquisition, IPO, capital rise or debt security offering by safely sharing confidential company information with potential buyers, advisors, and partners. As per CapLinked, a virtual data room provides secure storage for digital documents and limits access to only those who are authorized to view them. This type of online data room is used extensively for business transactions, including the due diligence process, M&As, IPOs, private equity agreements, banking, and investments. Stakeholders can securely access documents at specific times, from any platform, and from anywhere in the world with an internet connection. Businesses, governments, and other organizations have found a wide variety of uses for virtual data room for document sharing and collaboration.
STAKEHOLDERS
-
Risk assessment and software developers.
-
Virtual data room vendors
-
Cloud service providers
-
Consulting service providers
-
Business owners
-
Distributors and value-added resellers (VARs)
-
Independent software vendors (ISVs)
-
Managed service providers
-
Support & maintenance service providers.
-
System integrators (SIs)/Migration service providers
-
OEMs
-
Technology providers
Report Objectives
-
To define, describe, and predict the virtual data room market by offering (software [by type and deployment mode] and services), document type, technology, application, end user, and region.
-
To provide detailed information related to major factors (drivers, restraints, opportunities, and industry-specific challenges) influencing the market growth.
-
To analyze the micro markets with respect to individual growth trends, prospects, and their contributions to the total market
-
To analyze the opportunities in the market for stakeholders by identifying the high-growth segments of the virtual data room market
-
To analyze the opportunities in the market and provide details of the competitive landscape for stakeholders and market leaders.
-
To forecast the market size of five main regions: North America, Europe, Asia Pacific, the Middle East & Africa, and Latin America
-
To profile the key players and comprehensively analyze their market rankings and core competencies.
-
To analyze the competitive developments, such as partnerships, product launches, and mergers & acquisitions, in the virtual data room market
-
To analyze the impact of the recession across all regions in the virtual data room market
Available Customizations
With the given mrket data, MarketsandMarkets offers customizations as per your company’s specific needs. The following customization options are available for the report:
Product analysis
-
Product quadrant, which gives a detailed comparison of the product portfolio of each company.
Geographic analysis
-
Further breakup of the North American virtual data room market
-
Further breakup of the European market
-
Further breakup of the Asia Pacific market
-
Further breakup of the Middle Eastern & African market
-
Further breakup of the Latin America virtual data room market
Company information
-
Detailed analysis and profiling of additional market players (up to five)


Growth opportunities and latent adjacency in Virtual Data Room Market