Warehouse Management System (WMS) Market by Offering (Software, Services), Deployment (On-premises, Cloud), Tier (Advanced, Intermediate, Basic), Application (Supply Chain & Logistics, Inventory Tracking) - Global Forecast to 2032

icon1
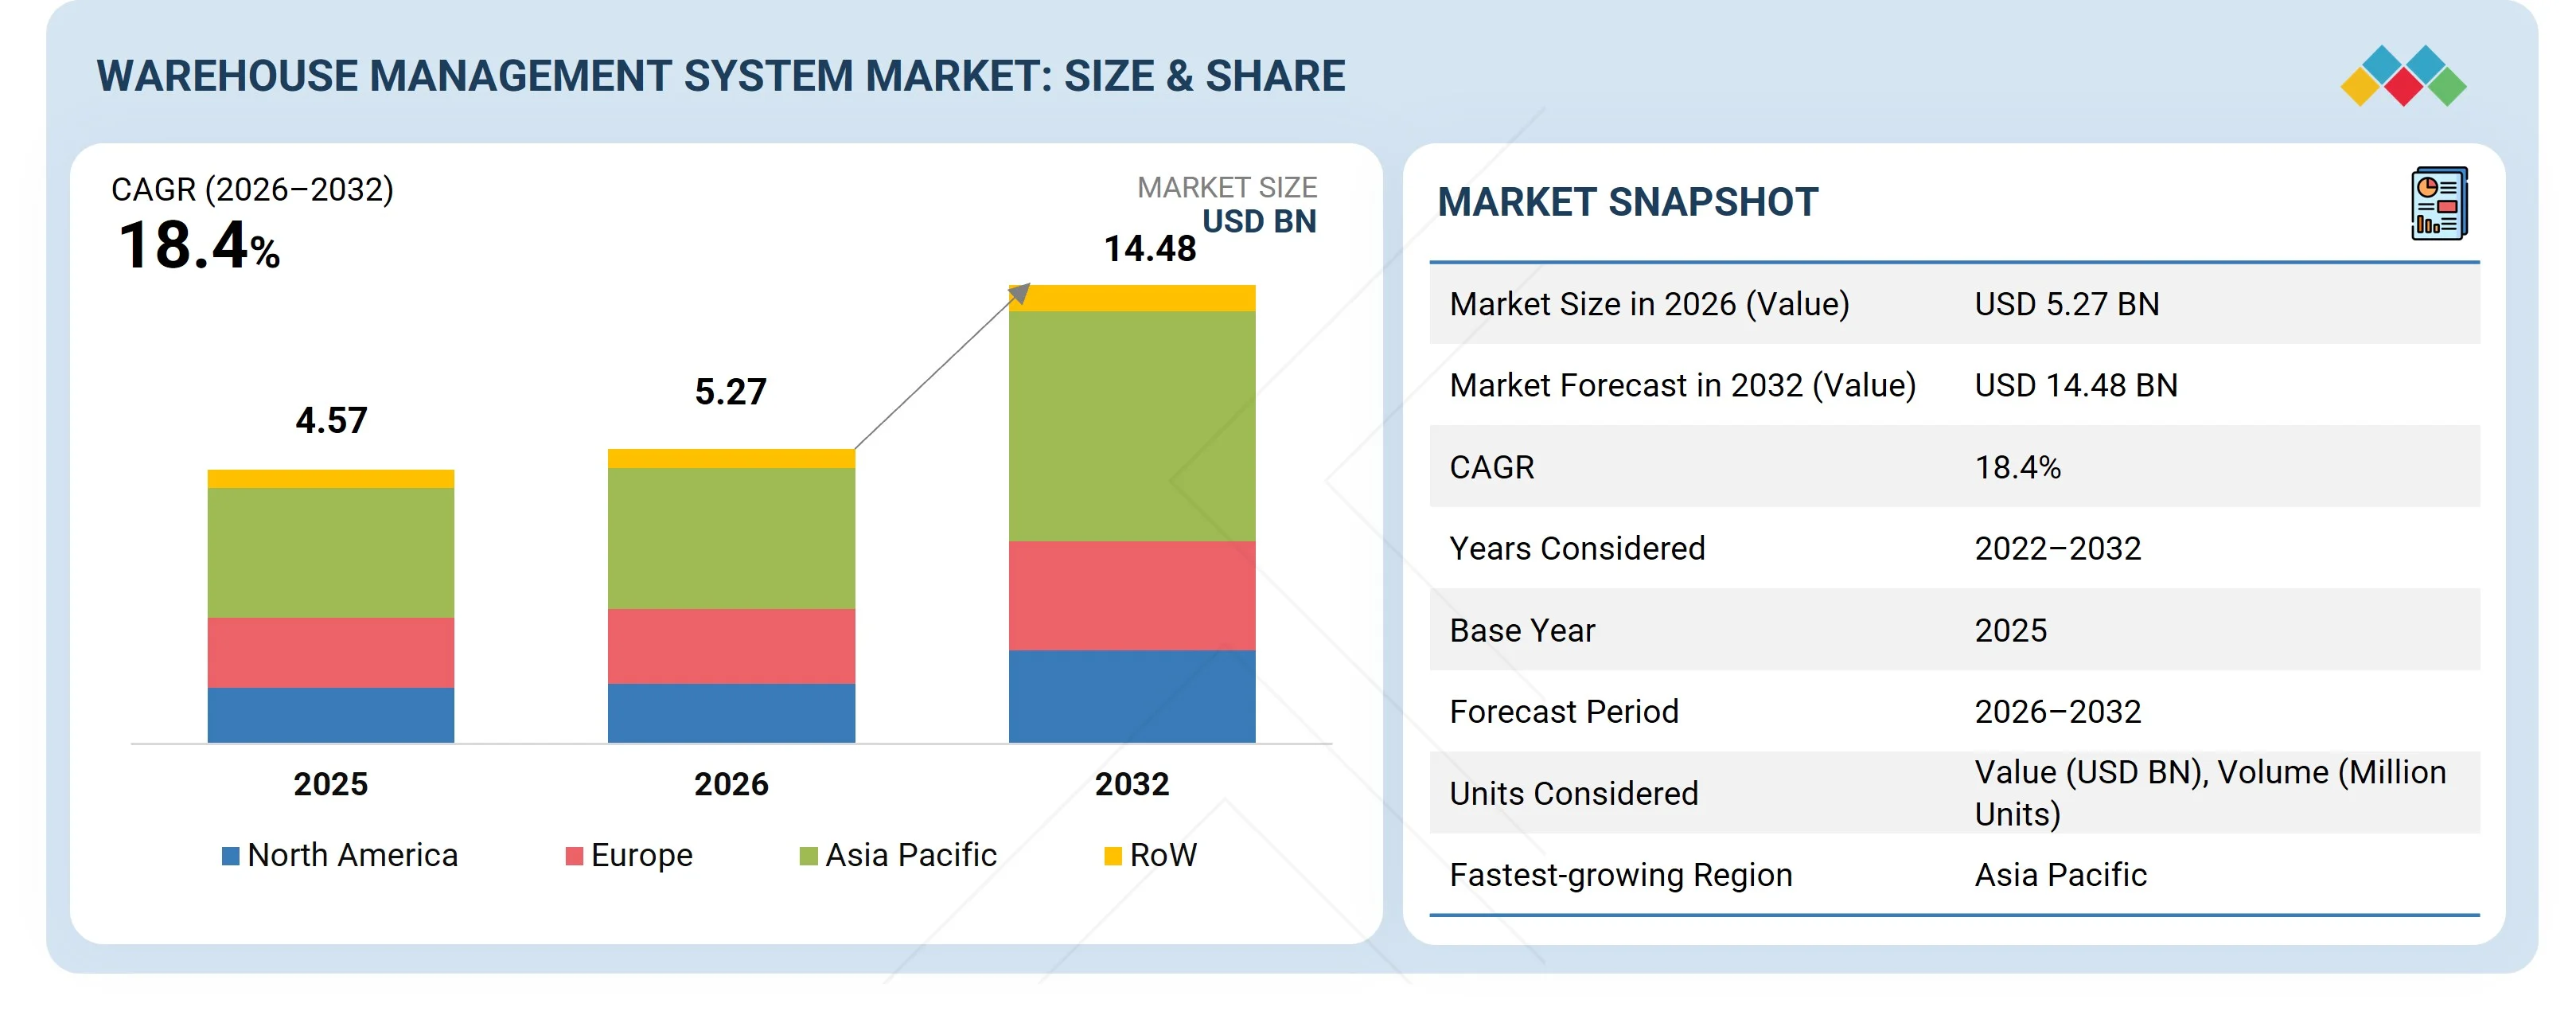
USD 14.48 Billion
MARKET SIZE, 2032
icon2
CAGR 18.4%
(2026-2032)
icon3
300
REPORT PAGES
icon4
250
MARKET TABLES

OVERVIEW

warehouse-management-system-market Overview

Source: Secondary Research, Interviews with Experts, MarketsandMarkets Analysis

The warehouse management system (WMS) market is projected to reach USD 14.48 billion by 2032 from USD 5.27 billion in 2026, at a CAGR of 18.4%. The market is witnessing steady growth as businesses increasingly focus on improving inventory accuracy, warehouse visibility, order fulfillment, and overall operational efficiency. The rapid expansion of e-commerce, growing warehouse networks, increasing order volumes, and the need to manage complex inventory and distribution operations are driving the adoption of WMS solutions across 3PL, automotive, food & beverages, healthcare, e-commerce, chemicals, electricals & electronics, and metals & machinery industries. In addition, the growing integration of WMS with warehouse automation technologies, including robots, automated storage and retrieval systems, conveyors and sortation systems, cranes, and automated guided vehicles, is helping organizations streamline material movement, reduce manual intervention, and improve warehouse productivity. The shift toward cloud-based WMS and the adoption of real-time data, analytics, and AI-enabled capabilities are further improving inventory visibility, order management, workforce utilization, and decision-making, thereby supporting market growth.

KEY TAKEAWAYS

  • By Region
    Asia Pacific is projected to be the fastest-growing region in the warehouse management system market during the forecast period, with a CAGR of 19.7%.
  • By Offering
    By offering, the software segment is expected to account for the largest share of the warehouse management system market during the forecast period.
  • By Deployment
    By deployment, the cloud-based segment is expected to register the highest CAGR of 19.9% in the warehouse management system market during the forecast period.
  • By Tier
    By tier, the advanced (Tier 1) segment is expected to register a 19.6% CAGR during the forecast period.
  • By Application
    By application, the supply chain & logistics optimization segment is expected to account for the largest share of the warehouse management system market during the forecast period.
  • By End User
    By end user, the e-commerce segment is expected to register the highest CAGR in the warehouse management system market during the forecast period.
  • COMPETITIVE LANDSCAPE (KEY PLAYERS)
    Manhattan Associates, Blue Yonder Group, Inc., Körber AG, Oracle Corporation, and SAP SE are identified as key players in the Warehouse Management System Market based on their WMS product offerings, warehouse management capabilities, integration with supply chain and enterprise systems, automation integration capabilities, software development activities, and presence across major end-user industries.
  • COMPETITIVE LANDSCAPE (STARTUPS/SMES)
    Infor, Ehrhardt + Partner GmbH & Co. KG (EPG), Microsoft Corporation, Tecsys Inc., PTC Inc., SSI SCHAEFER, Epicor, Extensiv, Datapel, Dematic, Generix, ecovium, Made4net, Microlistics, Mecalux, S.A., Softeon, Synergy Logistics, Vinculum Solutions Pvt. Ltd., and Technoforte Software Pvt. Ltd., among others, offer WMS software, warehouse automation integration, inventory management, order fulfillment, labor management, yard management, and related solutions. These companies focus on improving warehouse visibility, inventory accuracy, operational efficiency, automation integration, and real-time decision-making to address the evolving requirements of warehouse operators, logistics providers, retailers, and manufacturers.

The warehouse management system market is expected to grow steadily as businesses, logistics providers, retailers, manufacturers, and other end users seek to improve inventory accuracy, warehouse visibility, order fulfillment, and operational efficiency. Market growth is supported by the expansion of e-commerce, increasing warehouse and distribution network complexity, rising order volumes, and the growing need for real-time inventory and warehouse management. These factors are driving demand for WMS solutions covering supply chain and logistics optimization, asset and inventory tracking, order fulfillment and distribution, yard and dock management, and workforce/labor management. The increasing integration of WMS with robotics and automation technologies, including robots, automated storage and retrieval systems, conveyors and sortation systems, cranes, and automated guided vehicles, is further supporting warehouse modernization by improving material handling, reducing manual intervention, and enabling better coordination of warehouse activities. In addition, the shift toward cloud-based WMS and the adoption of analytics, artificial intelligence, IoT, and real-time data capabilities are enhancing inventory visibility, operational planning, and decision-making. Product enhancements, partnerships, and other strategic developments by key WMS providers are further supporting the adoption of these solutions across 3PL, automotive, food & beverages, healthcare, e-commerce, chemicals, electricals & electronics, and metals & machinery industries.

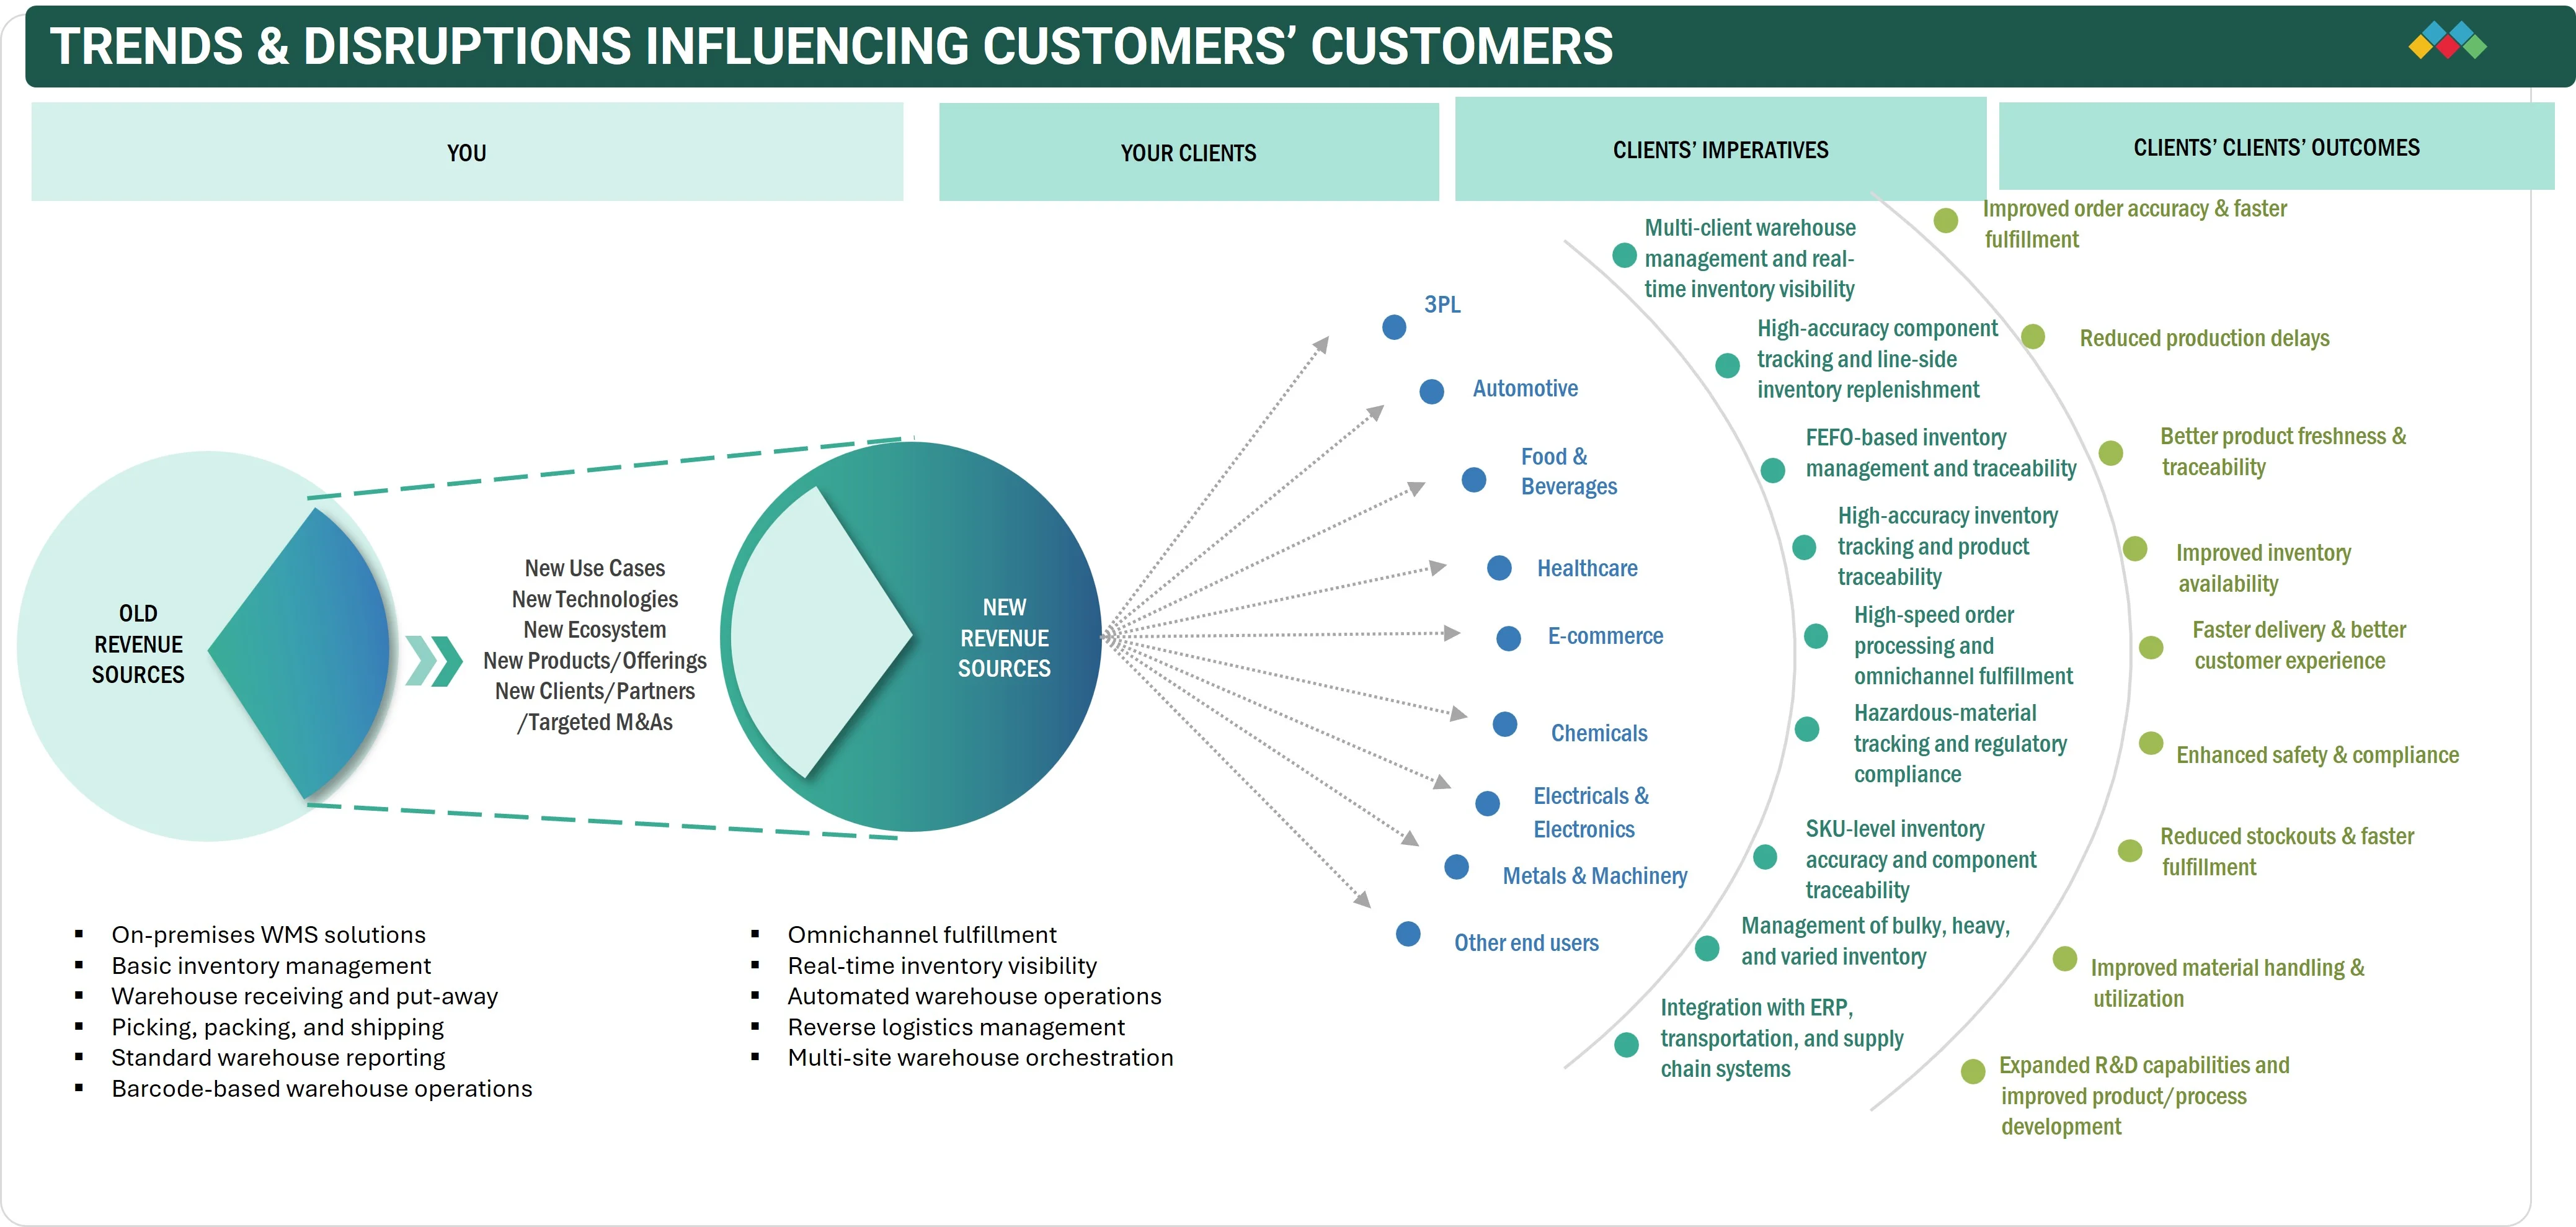
TRENDS & DISRUPTIONS IMPACTING CUSTOMERS' CUSTOMERS

Growing demand for real-time inventory visibility, omnichannel fulfillment, warehouse automation, and faster order processing is driving the development of advanced warehouse management systems (WMS). Cloud-based WMS, AI/ML, IoT, RFID, robotics, automated storage and retrieval systems (AS/RS), and real-time analytics are expanding applications across 3PL, automotive, food & beverages, healthcare, e-commerce, chemicals, electricals & electronics, and metals & machinery. These developments are helping customers achieve higher inventory accuracy, faster picking and fulfillment, improved warehouse utilization, reduced operating costs, and greater supply chain visibility. As customers increasingly focus on automation, scalability, integration, real-time tracking, and operational efficiency, WMS providers are developing more intelligent, connected, and industry-specific solutions. This shift is creating new revenue opportunities and supporting broader adoption of WMS across diverse warehouse and supply chain operations.
warehouse-management-system-market Disruptions

Source: Secondary Research, Interviews with Experts, MarketsandMarkets Analysis

MARKET DYNAMICS

Drivers
Impact
Level
  • Surging e-commerce landscape
  • Rising adoption of cloud-based WMS solutions
RESTRAINTS
Impact
Level
  • Lack of skilled personnel
  • Elevated implementation and maintenance costs of on-premises WMS for SMEs
OPPORTUNITIES
Impact
Level
  • Digital transformation in supply chain
  • Accelerated industrial growth and infrastructure investments in logistics sector
CHALLENGES
Impact
Level
  • Maintaining scalability to accommodate business expansion
  • Limited awareness resulting in low adoption of WMS solutions among small businesses

Source: Secondary Research, Interviews with Experts, MarketsandMarkets Analysis

Driver: Rising adoption of cloud-based WMS solutions

Cloud systems are among the safest and most secure solutions available today, whether for personal or professional use. Cloud WMS offers customers a wide range of plans to choose from, and these can be customized to their specific needs. Cloud WMS eliminates the need for on-premises devices, business licenses, and high capital investments.

Restraint: Lack of skilled personnel

The warehouse management system market is facing a challenge due to a shortage of skilled personnel proficient in implementing and maintaining these systems. As businesses increasingly adopt advanced WMS solutions to improve their operations, the demand for experts in this technology has surged. However, there is a limited pool of qualified professionals with the necessary expertise, making it difficult for companies to efficiently adopt and manage these systems.

Opportunity: Digital transformation in supply chain

Digitalization offers various advantages, including streamlined operations, improved efficiency, enhanced productivity, cost savings, better decision-making, and enhanced customer experience. The adoption of digital technologies is an effective way to reduce time wastage as they automate processes, enhance decision-making, and make it easier to identify and solve errors.

Challenge: Maintaining scalability to accommodate business expansion

Scalability in WMS refers to the system's ability to adapt and grow along with a business's evolving needs. When a business expands, whether in terms of inventory volume, number of locations, or complexity of operations, WMS should seamlessly accommodate these changes without major disruptions. For instance, a WMS that effectively manages a small warehouse with a limited range of products may struggle to keep up with the demands of a larger warehouse with diverse inventory needs and more intricate logistics.

WAREHOUSE MANAGEMENT SYSTEM (WMS) MARKET SIZE, SHARE & TRENDS: COMMERCIAL USE CASES ACROSS INDUSTRIES

COMPANY USE CASE DESCRIPTION BENEFITS
company logo
Manhattan Associates provides WMS solutions that unify inventory, labor, automation, and yard operations. Its warehouse management platform supports inbound and outbound processes, inventory visibility, fulfillment, labor management, slotting, and integration with warehouse automation. Improves inventory visibility and warehouse execution | Supports faster and more accurate order fulfillment | Helps optimize labor and warehouse resources | Supports integration with automation
company logo
Körber provides warehouse management solutions for managing warehouse processes, inventory, order fulfillment, and material flows. Its WMS portfolio is designed to support different warehouse operating environments and integration with automation and broader supply chain systems. Supports efficient warehouse process execution | Improves inventory and operational visibility | Supports automation integration | Helps manage complex warehouse operations
company logo
Blue Yonder provides WMS solutions covering inbound processing, inventory management, resource management, outbound processing, labor, yard management, and warehouse execution. Its platform also supports real-time orchestration of people, equipment, and robotics. Improves inventory visibility and accuracy | Supports efficient order picking and fulfillment | Helps optimize labor and warehouse resources | Enables coordination of people and automation
company logo
Oracle provides warehouse management solutions supporting inventory management, warehouse operations, and omnichannel fulfillment. Oracle WMS helps manage warehouse facilities and supports fulfillment of retail and e-commerce orders. Improves inventory visibility and control | Supports accurate order fulfillment | Helps manage warehouse facilities and inventory | Supports integration with broader enterprise operations
company logo
SAP provides SAP Extended Warehouse Management (EWM), which supports high-volume warehouse operations, inventory and storage-bin management, inbound and outbound processes, yard logistics, labor management, and warehouse automation. SAP EWM can also integrate warehouse operations with broader supply chain and enterprise processes. Improves inventory and process transparency | Supports efficient inbound and outbound operations | Helps optimize warehouse space and resources | Supports warehouse automation and supply chain integration

Logos and trademarks shown above are the property of their respective owners. Their use here is for informational and illustrative purposes only.

MARKET ECOSYSTEM

The Warehouse Management System ecosystem comprises WMS software and service providers, cloud service providers, and end users. WMS software and service providers offer solutions for inventory management, warehouse operations, order fulfillment, labor management, and supply chain optimization, while cloud service providers provide the infrastructure and computing environment required to deploy and operate cloud-based WMS solutions. Key participants include Manhattan Associates, SAP SE, Tecsys Inc., Blue Yonder Group, Inc., Oracle Corporation, Infor, and SSI SCHAEFER, along with cloud service providers such as Amazon Web Services (AWS), Microsoft Azure, and Google Cloud. End users such as Walmart, Amazon, UPS, and Unilever deploy WMS solutions to improve inventory visibility, warehouse efficiency, order fulfillment, and distribution operations across their supply chains.
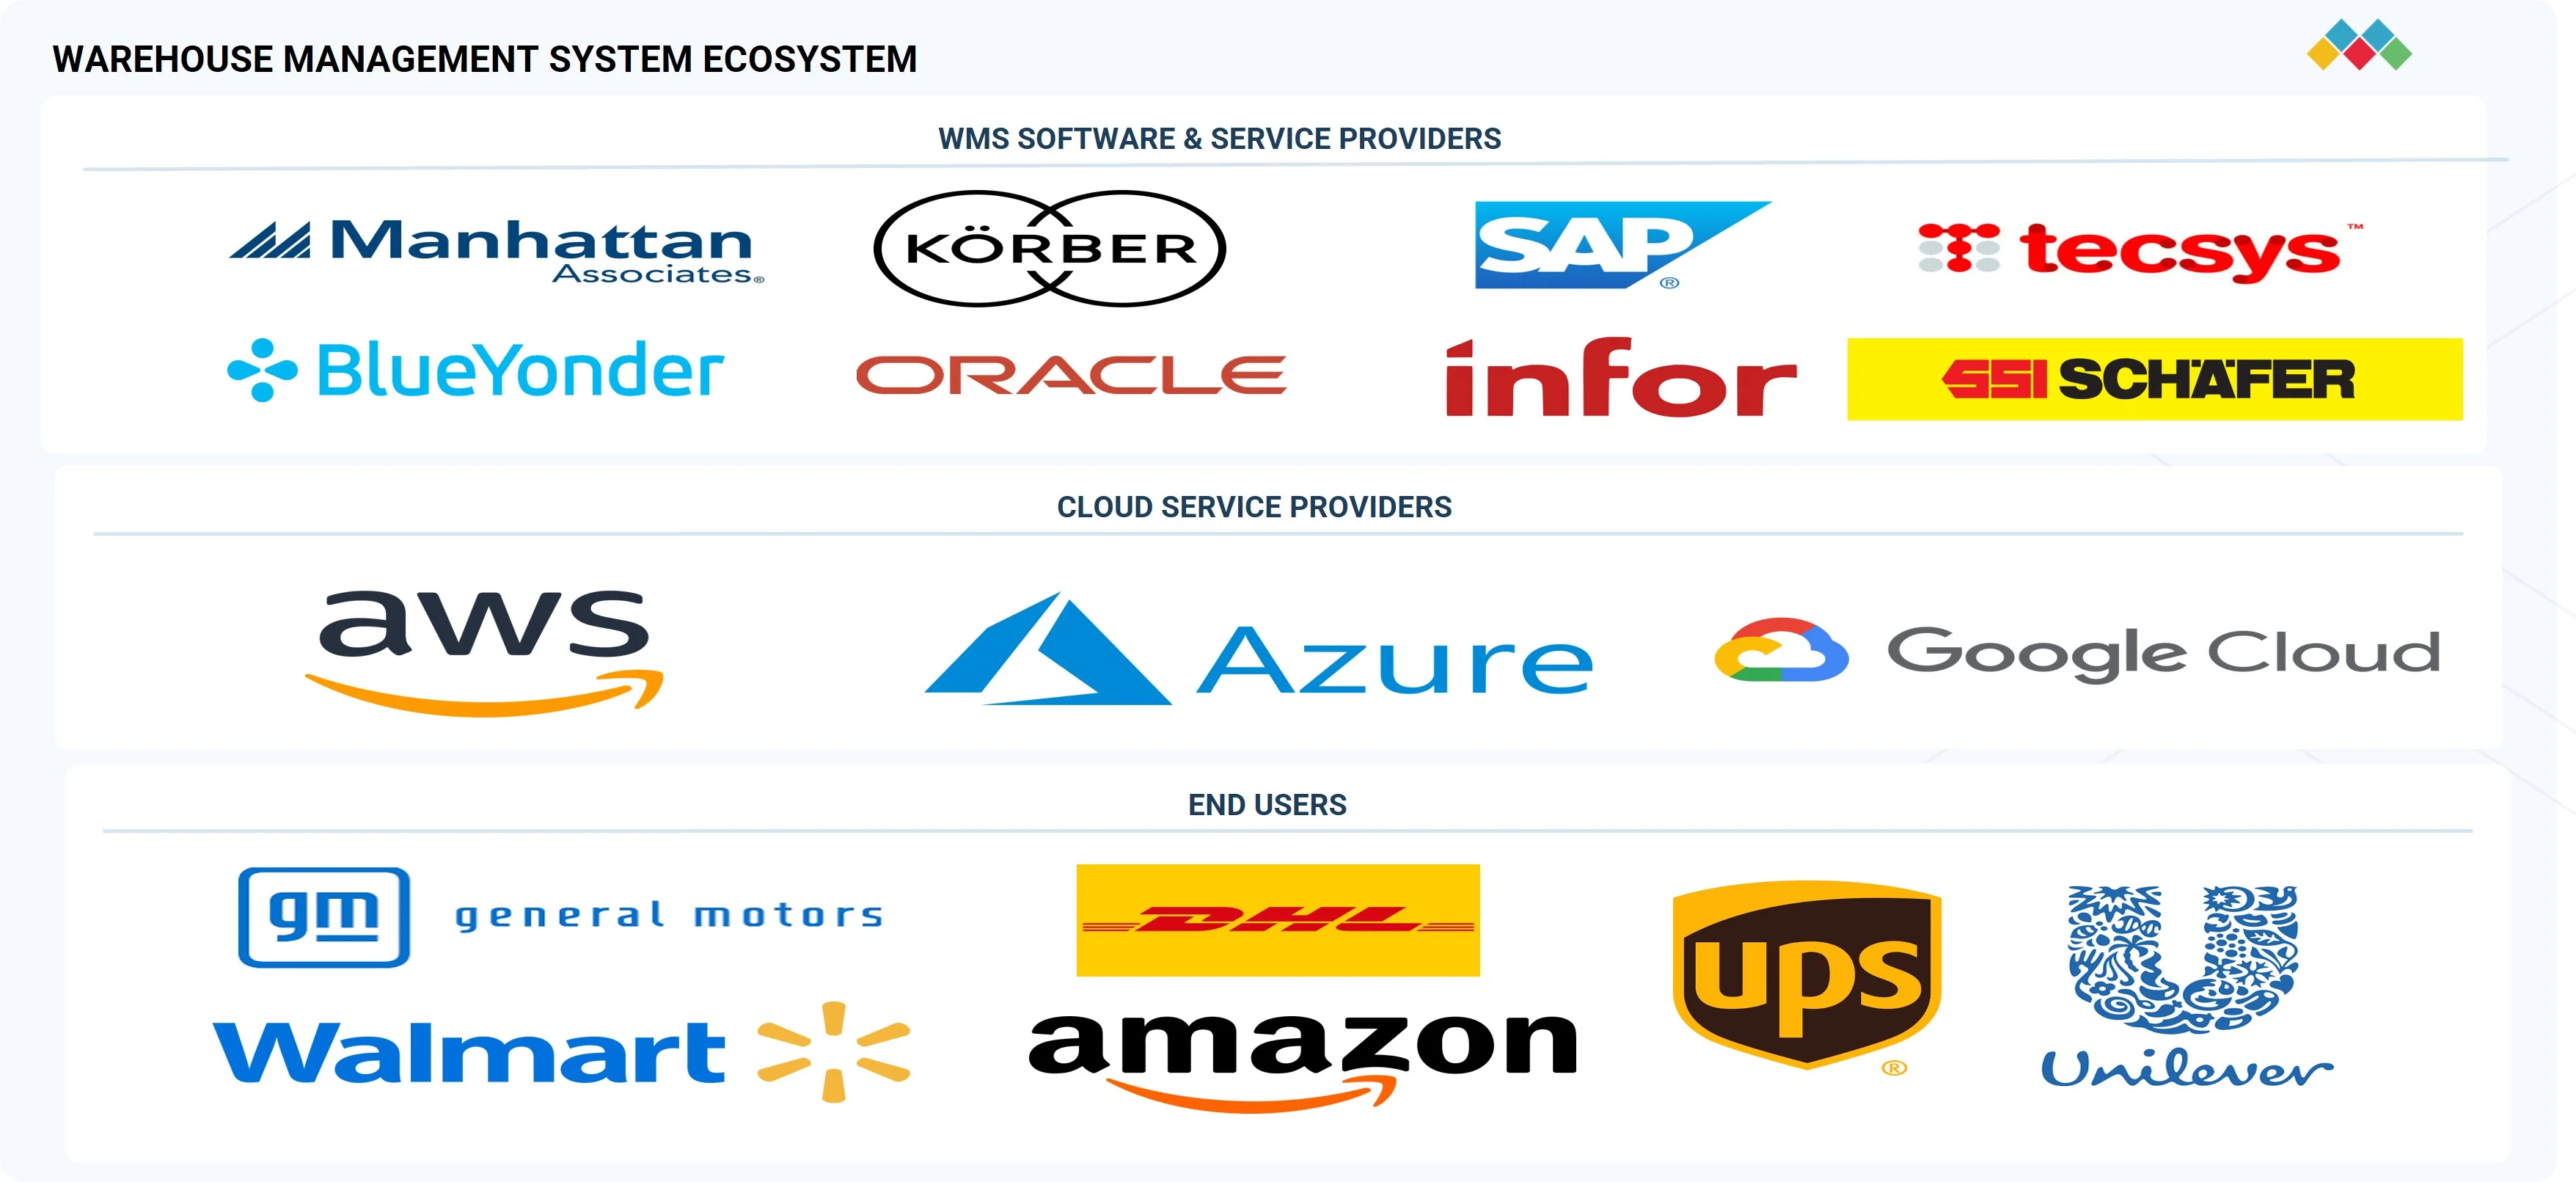
warehouse-management-system-market Ecosystem

Logos and trademarks shown above are the property of their respective owners. Their use here is for informational and illustrative purposes only.

MARKET SEGMENTS
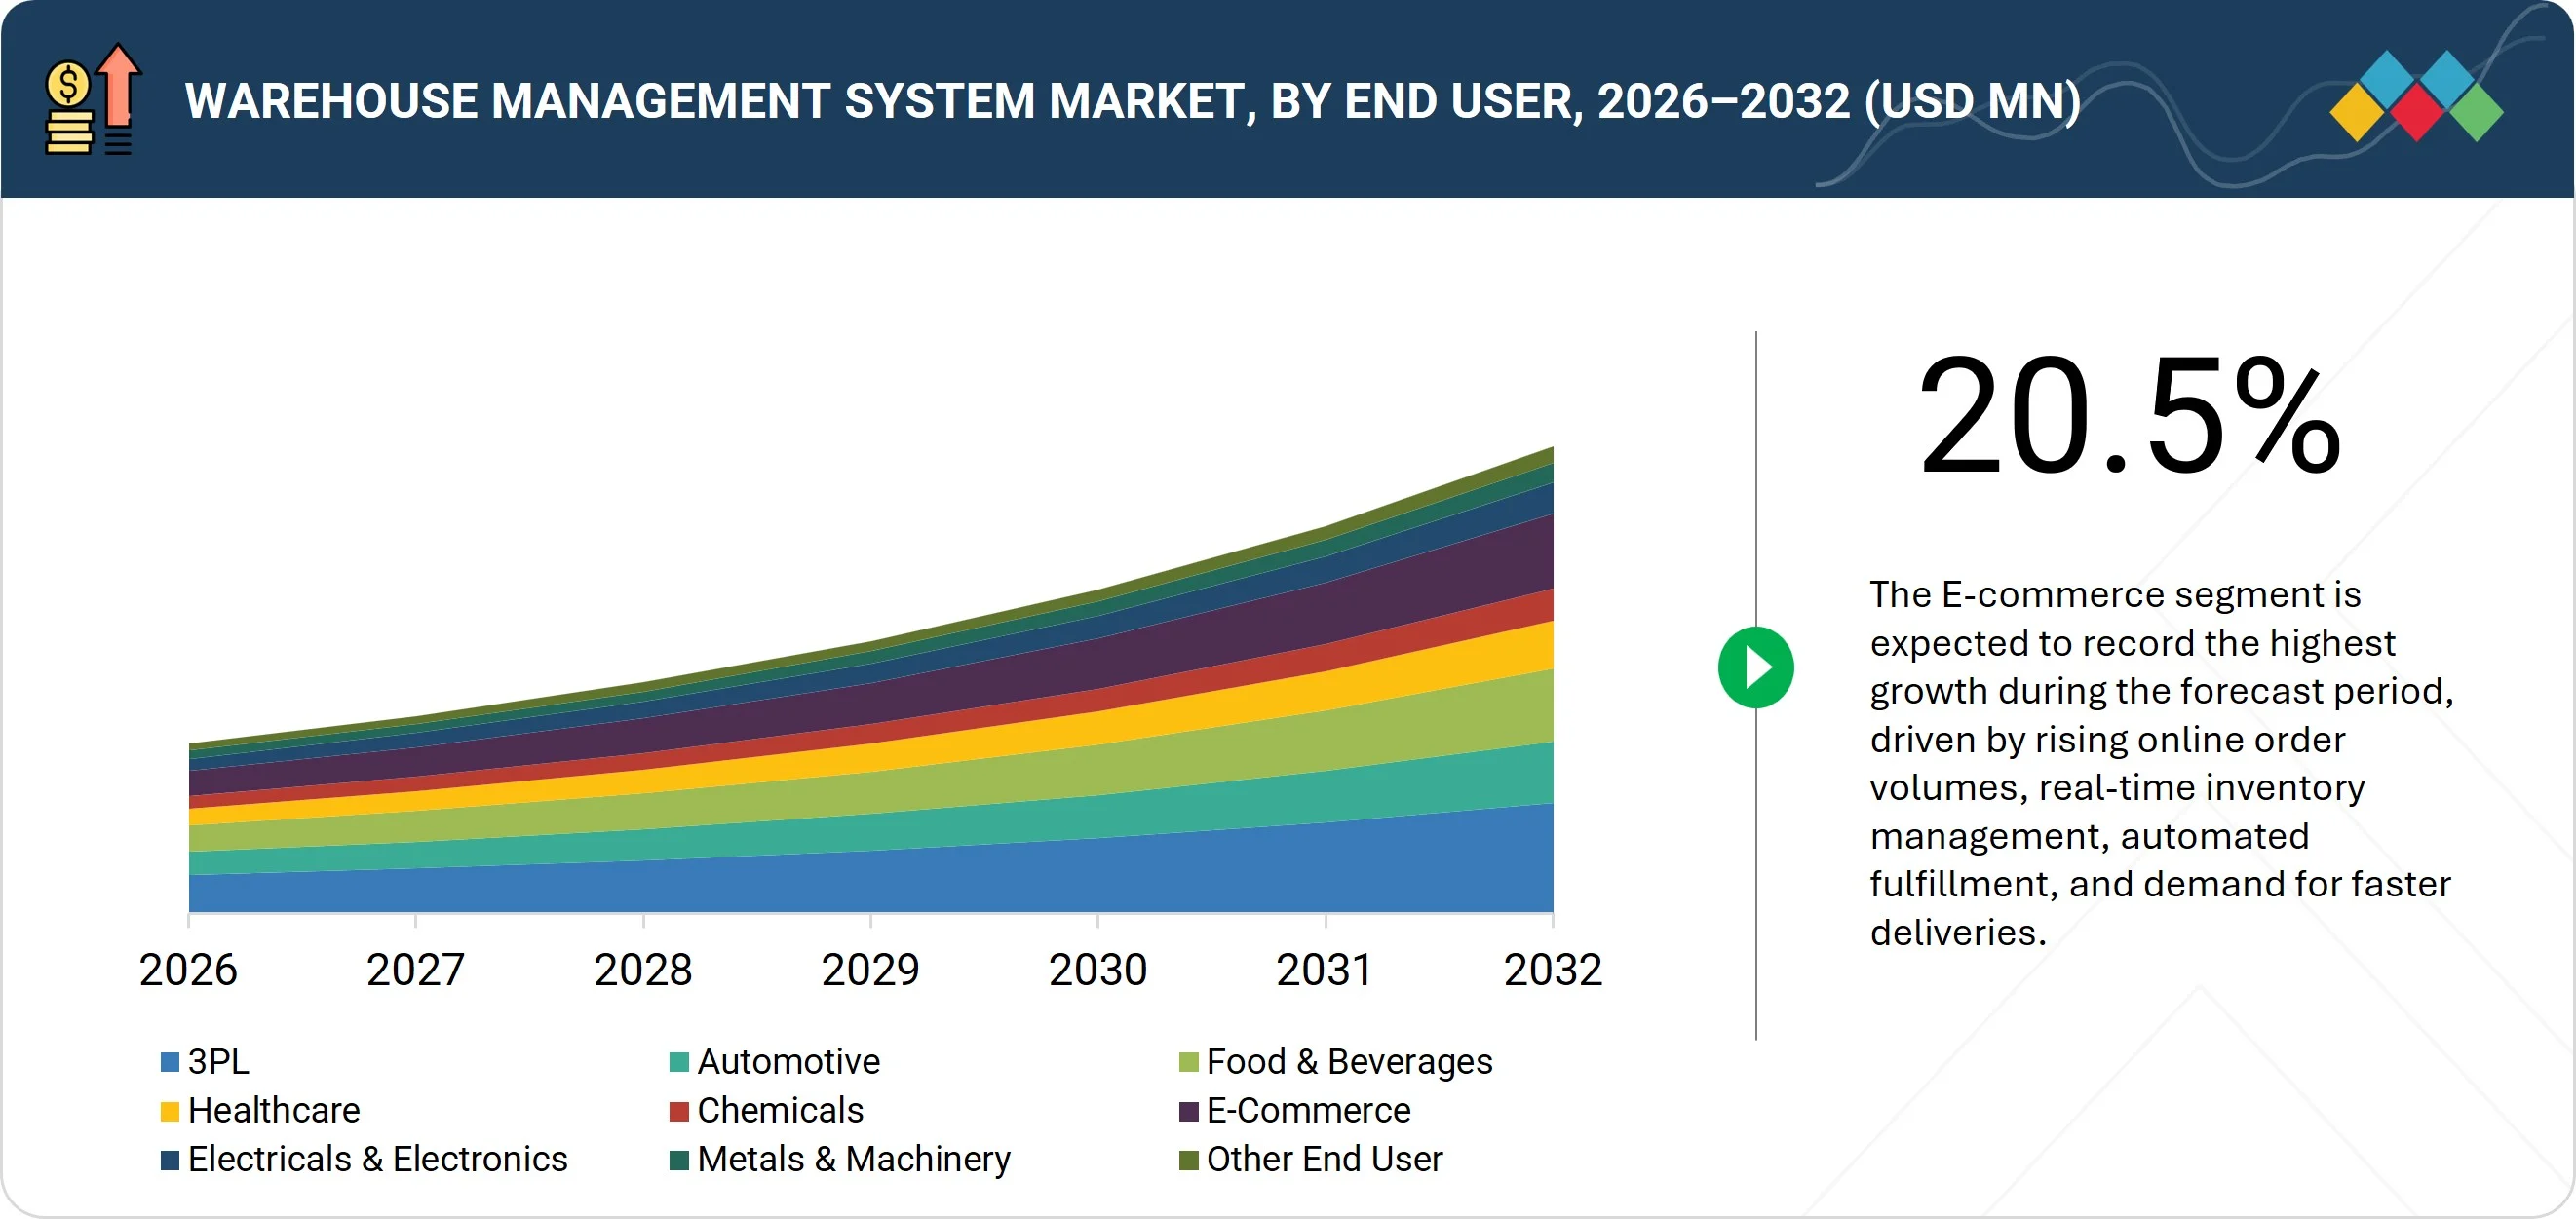
warehouse-management-system-market Segments

Source: Secondary Research, Interviews with Experts, MarketsandMarkets Analysis

By Region

North America is expected to account for the largest share of the warehouse management system market during the forecast period. The region has a well-developed logistics and warehousing infrastructure, with strong adoption of digital technologies across retail, manufacturing, and distribution operations. The growth of e-commerce, rising warehouse volumes, and the need to improve inventory visibility and order fulfillment are increasing demand for warehouse management systems. In addition, the growing use of warehouse automation and integration with robots, automated storage and retrieval systems, conveyors and sortation systems, cranes, and automated guided vehicles is supporting the modernization of warehouse operations. The presence of established technology providers and continued investment in digital supply chain and cloud technologies are further supporting market growth in the region.

By Offering

By offering, the software segment is expected to account for the largest share of the warehouse management system market during the forecast period. Software is the core component used to manage inventory, warehouse activities, order fulfillment, workforce, and other warehouse processes. Growing warehouse complexity and increasing order volumes are creating a need for better visibility and control over daily operations. Businesses are also connecting warehouse software with enterprise resource planning, transportation management, order management, and automation systems to improve coordination across the supply chain. These factors are supporting the continued demand for WMS software.

By Deployment

By deployment, the cloud-based segment is expected to register the highest CAGR during the forecast period. Businesses are increasingly moving toward cloud-based systems because they can be deployed across multiple warehouse locations without requiring extensive on-site IT infrastructure. Cloud deployment also provides easier access to data, software updates, system integration, and scalability as warehouse operations expand. The growing need for real-time visibility across multiple facilities and the increasing digitalization of supply chain operations are further supporting adoption.

By Tier

By tier, the advanced (Tier 1) segment is expected to account for the largest share of the warehouse management system market during the forecast period. Large organizations and logistics providers with complex warehouse networks, high inventory volumes, and automated operations generally require more comprehensive warehouse management capabilities. Advanced systems can support inventory management, order fulfillment, labor, yard operations, analytics, and integration with warehouse automation. The need to manage larger and more complex warehouse operations is therefore supporting demand for advanced (Tier 1) systems.

By Application

By application, the supply chain & logistics optimization segment is expected to account for the largest share of the warehouse management system market during the forecast period. Companies are increasingly using warehouse management systems to improve the flow of inventory and materials through their distribution operations. Growing supply chain complexity, higher order volumes, and expanding warehouse networks are increasing the need to coordinate warehouse activities with transportation, order management, and other logistics functions. The focus on improving inventory accuracy, reducing fulfillment time, and increasing warehouse productivity is further supporting this segment.

By End User

By end user, the e-commerce segment is expected to register the highest CAGR in the warehouse management system market during the forecast period. The rapid growth of online shopping and increasing order volumes are creating greater demand for efficient inventory management, order processing, picking, packing, and shipping. E-commerce fulfillment centers need to manage a large number of products and orders while maintaining accurate inventory visibility and meeting shorter delivery timelines. In addition, the increasing adoption of warehouse automation, including robots, automated storage and retrieval systems, conveyors and sortation systems, and automated guided vehicles, is driving the need for systems that can coordinate inventory, workers, and automated equipment. These factors are expected to support the strong growth of the e-commerce segment during the forecast period.

REGION

Asia Pacific to be the fastest-growing region in the warehouse management system market during the forecast period

Asia Pacific is expected to be the fastest-growing region in the warehouse management system market during the forecast period. Growing e-commerce, manufacturing, and logistics activities are increasing the number and complexity of warehouse operations across the region. Businesses are adopting WMS solutions to improve inventory accuracy, manage higher order volumes, and streamline picking, packing, and shipping activities. The expansion of organized warehousing and investments in warehouse automation are further supporting adoption. Countries such as China, Japan, South Korea, and India are witnessing increasing investments in logistics infrastructure, automated warehouses, and digital supply chain technologies. In addition, the growing use of robots, automated storage and retrieval systems, conveyors and sortation systems, and automated guided vehicles is increasing the need for WMS solutions that can coordinate warehouse processes and automation, supporting regional market growth.
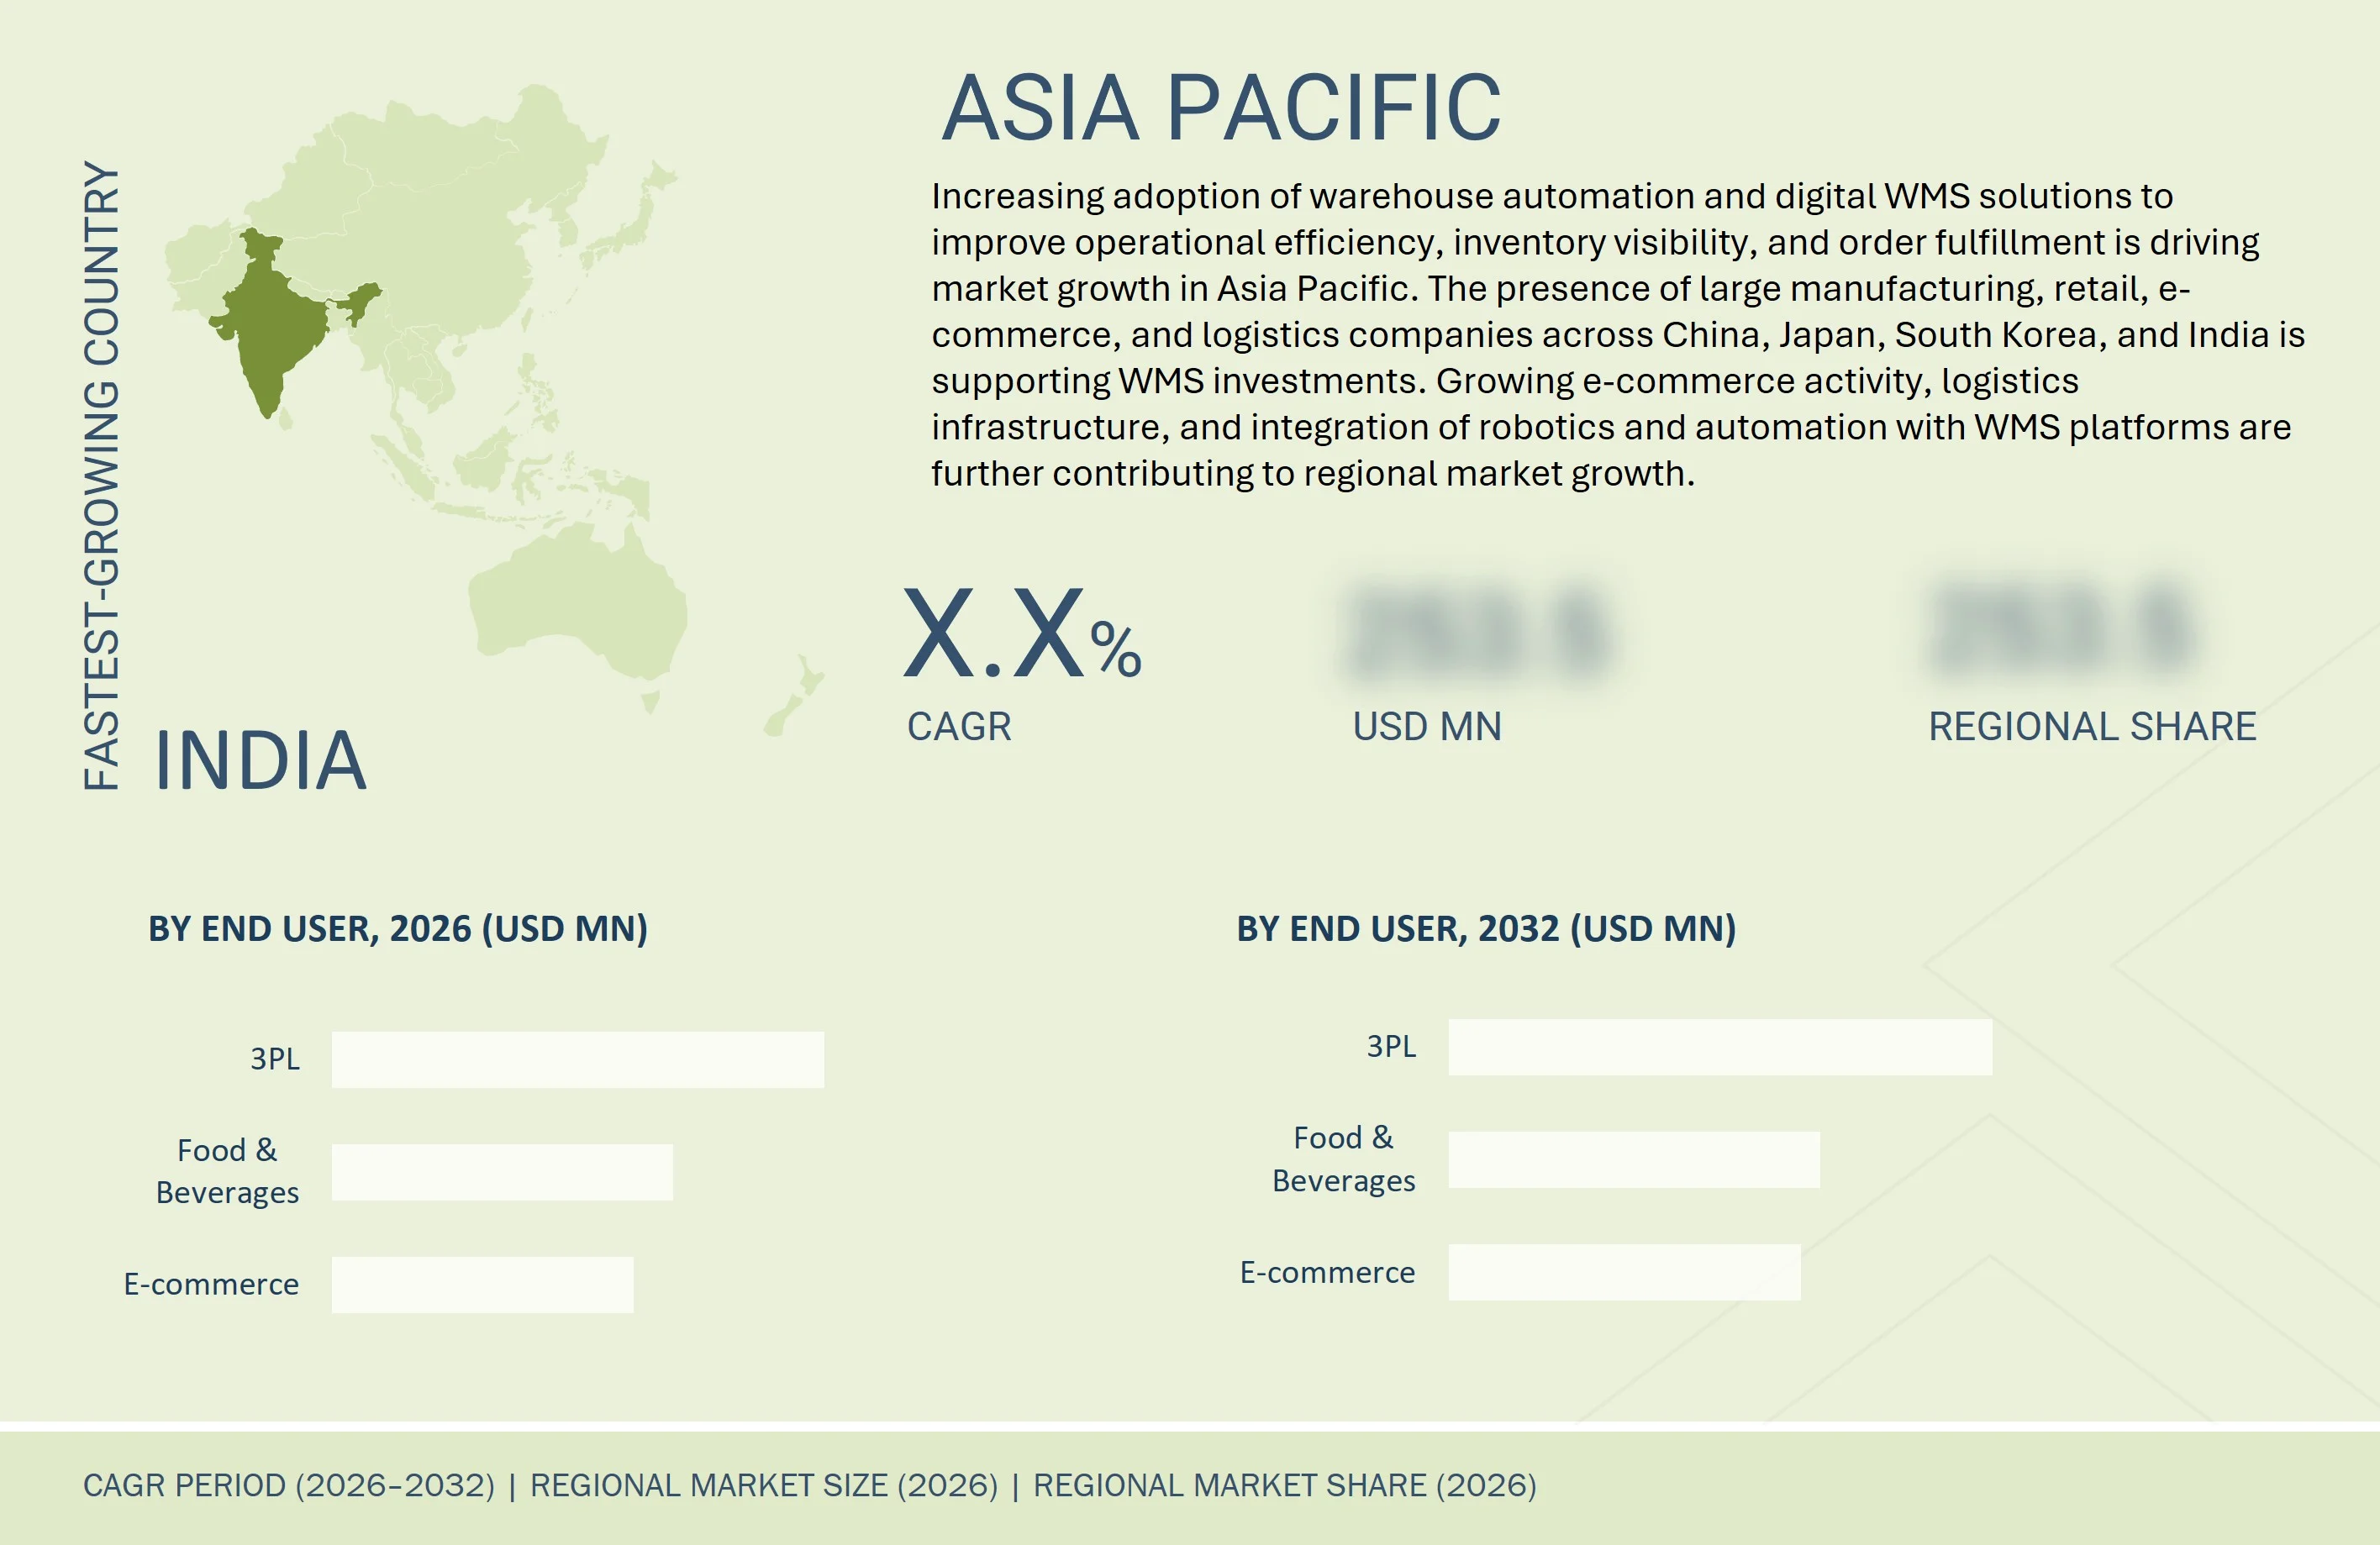
warehouse-management-system-market Region

WAREHOUSE MANAGEMENT SYSTEM (WMS) MARKET SIZE, SHARE & TRENDS: COMPANY EVALUATION MATRIX

In the warehouse management system market matrix, Manhattan Associates (Star) is positioned as a leading player, driven by its broad WMS capabilities covering inventory management, order fulfillment, labor management, warehouse execution, and automation integration. The company’s solutions help retailers, manufacturers, logistics providers, and e-commerce businesses manage complex warehouse operations, improve inventory visibility, and increase fulfillment efficiency. Körber AG (Star) is also positioned as a leading player, with a strong focus on managing warehouse processes, inventory, order fulfillment, material flows, and integration with automation technologies. Its WMS solutions support businesses in improving warehouse process efficiency, managing complex distribution operations, and coordinating warehouse activities with automated equipment.
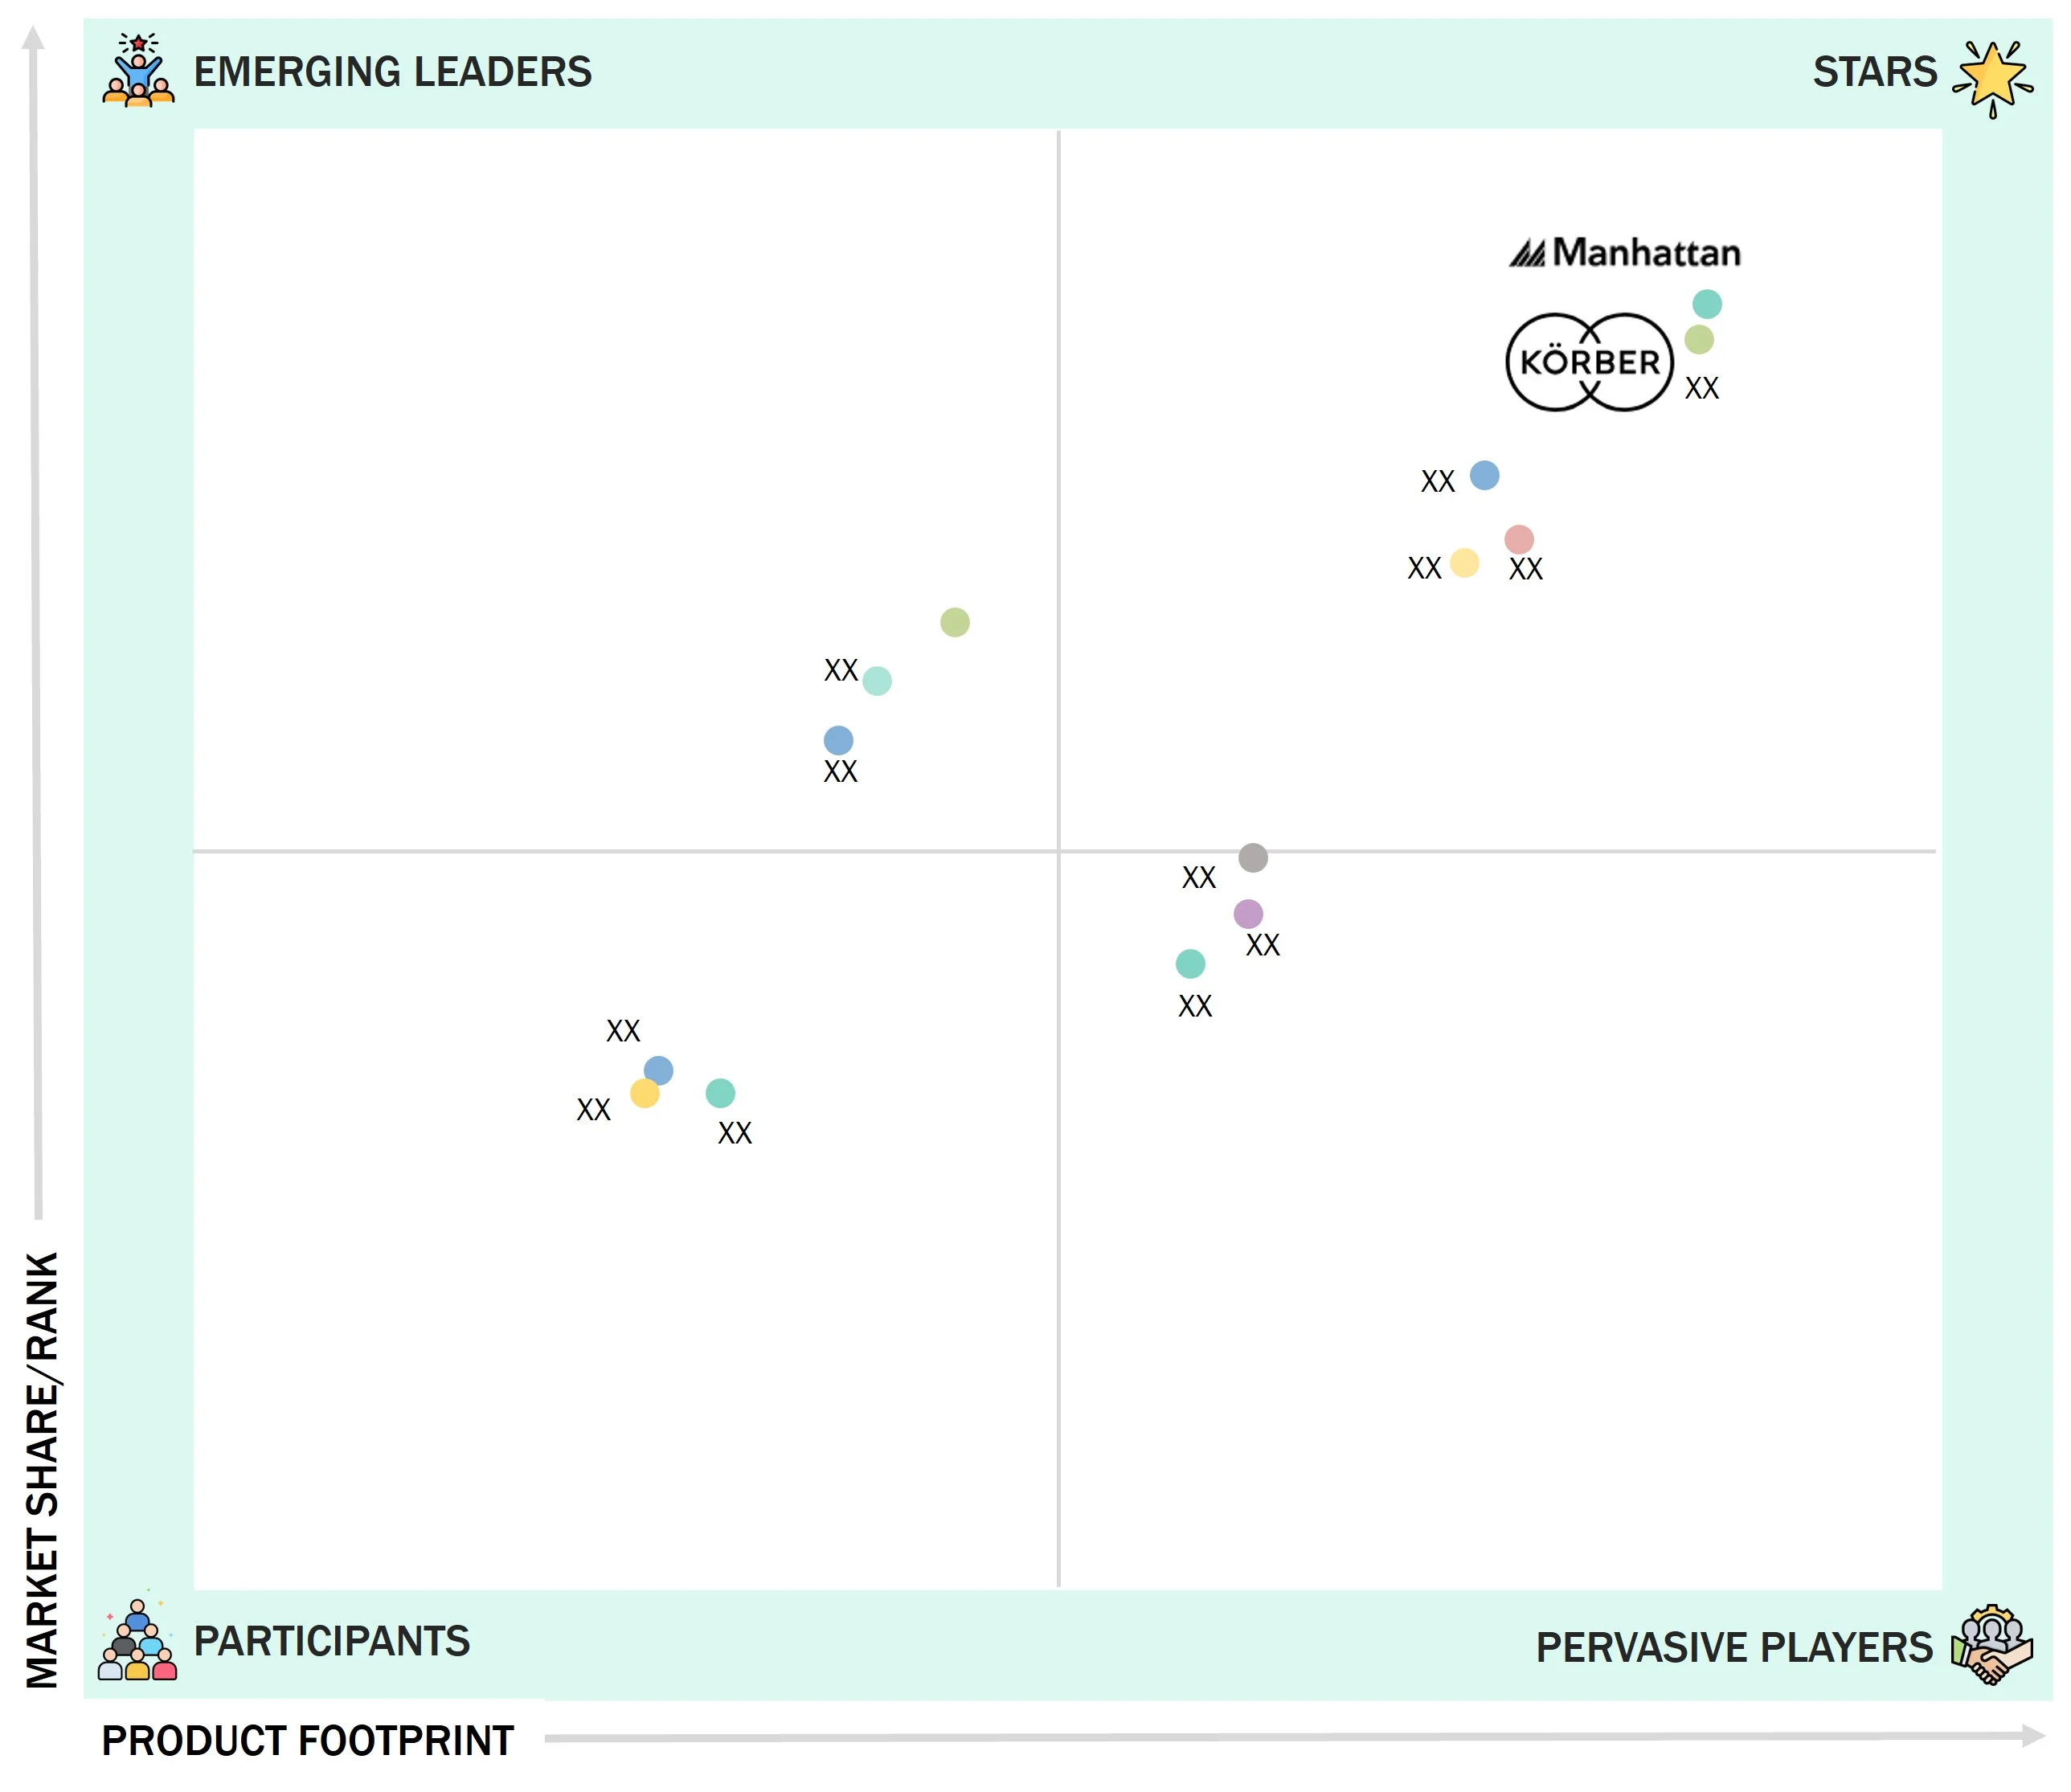
warehouse-management-system-market Evaluation Metrics

Source: Secondary Research, Interviews with Experts, MarketsandMarkets Analysis

KEY MARKET PLAYERS

MARKET SCOPE

REPORT METRIC DETAILS
Market Size in 2025 (Value) USD 4.57 Billion
Market Size in 2026 (Value) USD 5.27 Billion
Market Forecast in 2032 (Value) USD 14.48 Billion
Growth Rate CAGR of 18.4% from 2026–2032
Years Considered 2022–2032
Base Year 2025
Forecast Period 2026–2032
Units Considered Value (USD Million/Billion), Volume (Million Units)
Report Coverage Revenue Forecast, Company Ranking, Competitive Landscape, Growth Factors, and Trends
Segments Covered
  • By Integration of Robotics & Automation:
    • Robots
    • Automated Storage and Retrieval Systems (AS/RS)
    • Conveyors & Sortation
    • Cranes
    • Automated Guided Vehicles (AGV)
  • By Offering:
    • Software
    • Services
  • By Deployment:
    • On-premises
    • Cloud-based
  • By Tier:
    • Advanced (Tier 1)
    • Intermediate (Tier 2)
    • Basic (Tier 3)
  • By Application/Function:
    • Supply Chain & Logistics Optimization
    • Asset & Inventory Tracking
    • Order Fulfillment & Distribution
    • Yard & Dock Management
    • Workforce/Labor Management
    • Other Applications
  • By End User:
    • 3PL
    • Automotive
    • Food & Beverages
    • Healthcare
    • E-commerce
    • Chemicals
    • Electricals & Electronics
    • Metals & Machinery
    • Other End Users
Regions Covered North America, Europe, Asia Pacific, Rest of the World (RoW)

WHAT IS IN IT FOR YOU: WAREHOUSE MANAGEMENT SYSTEM (WMS) MARKET SIZE, SHARE & TRENDS REPORT CONTENT GUIDE
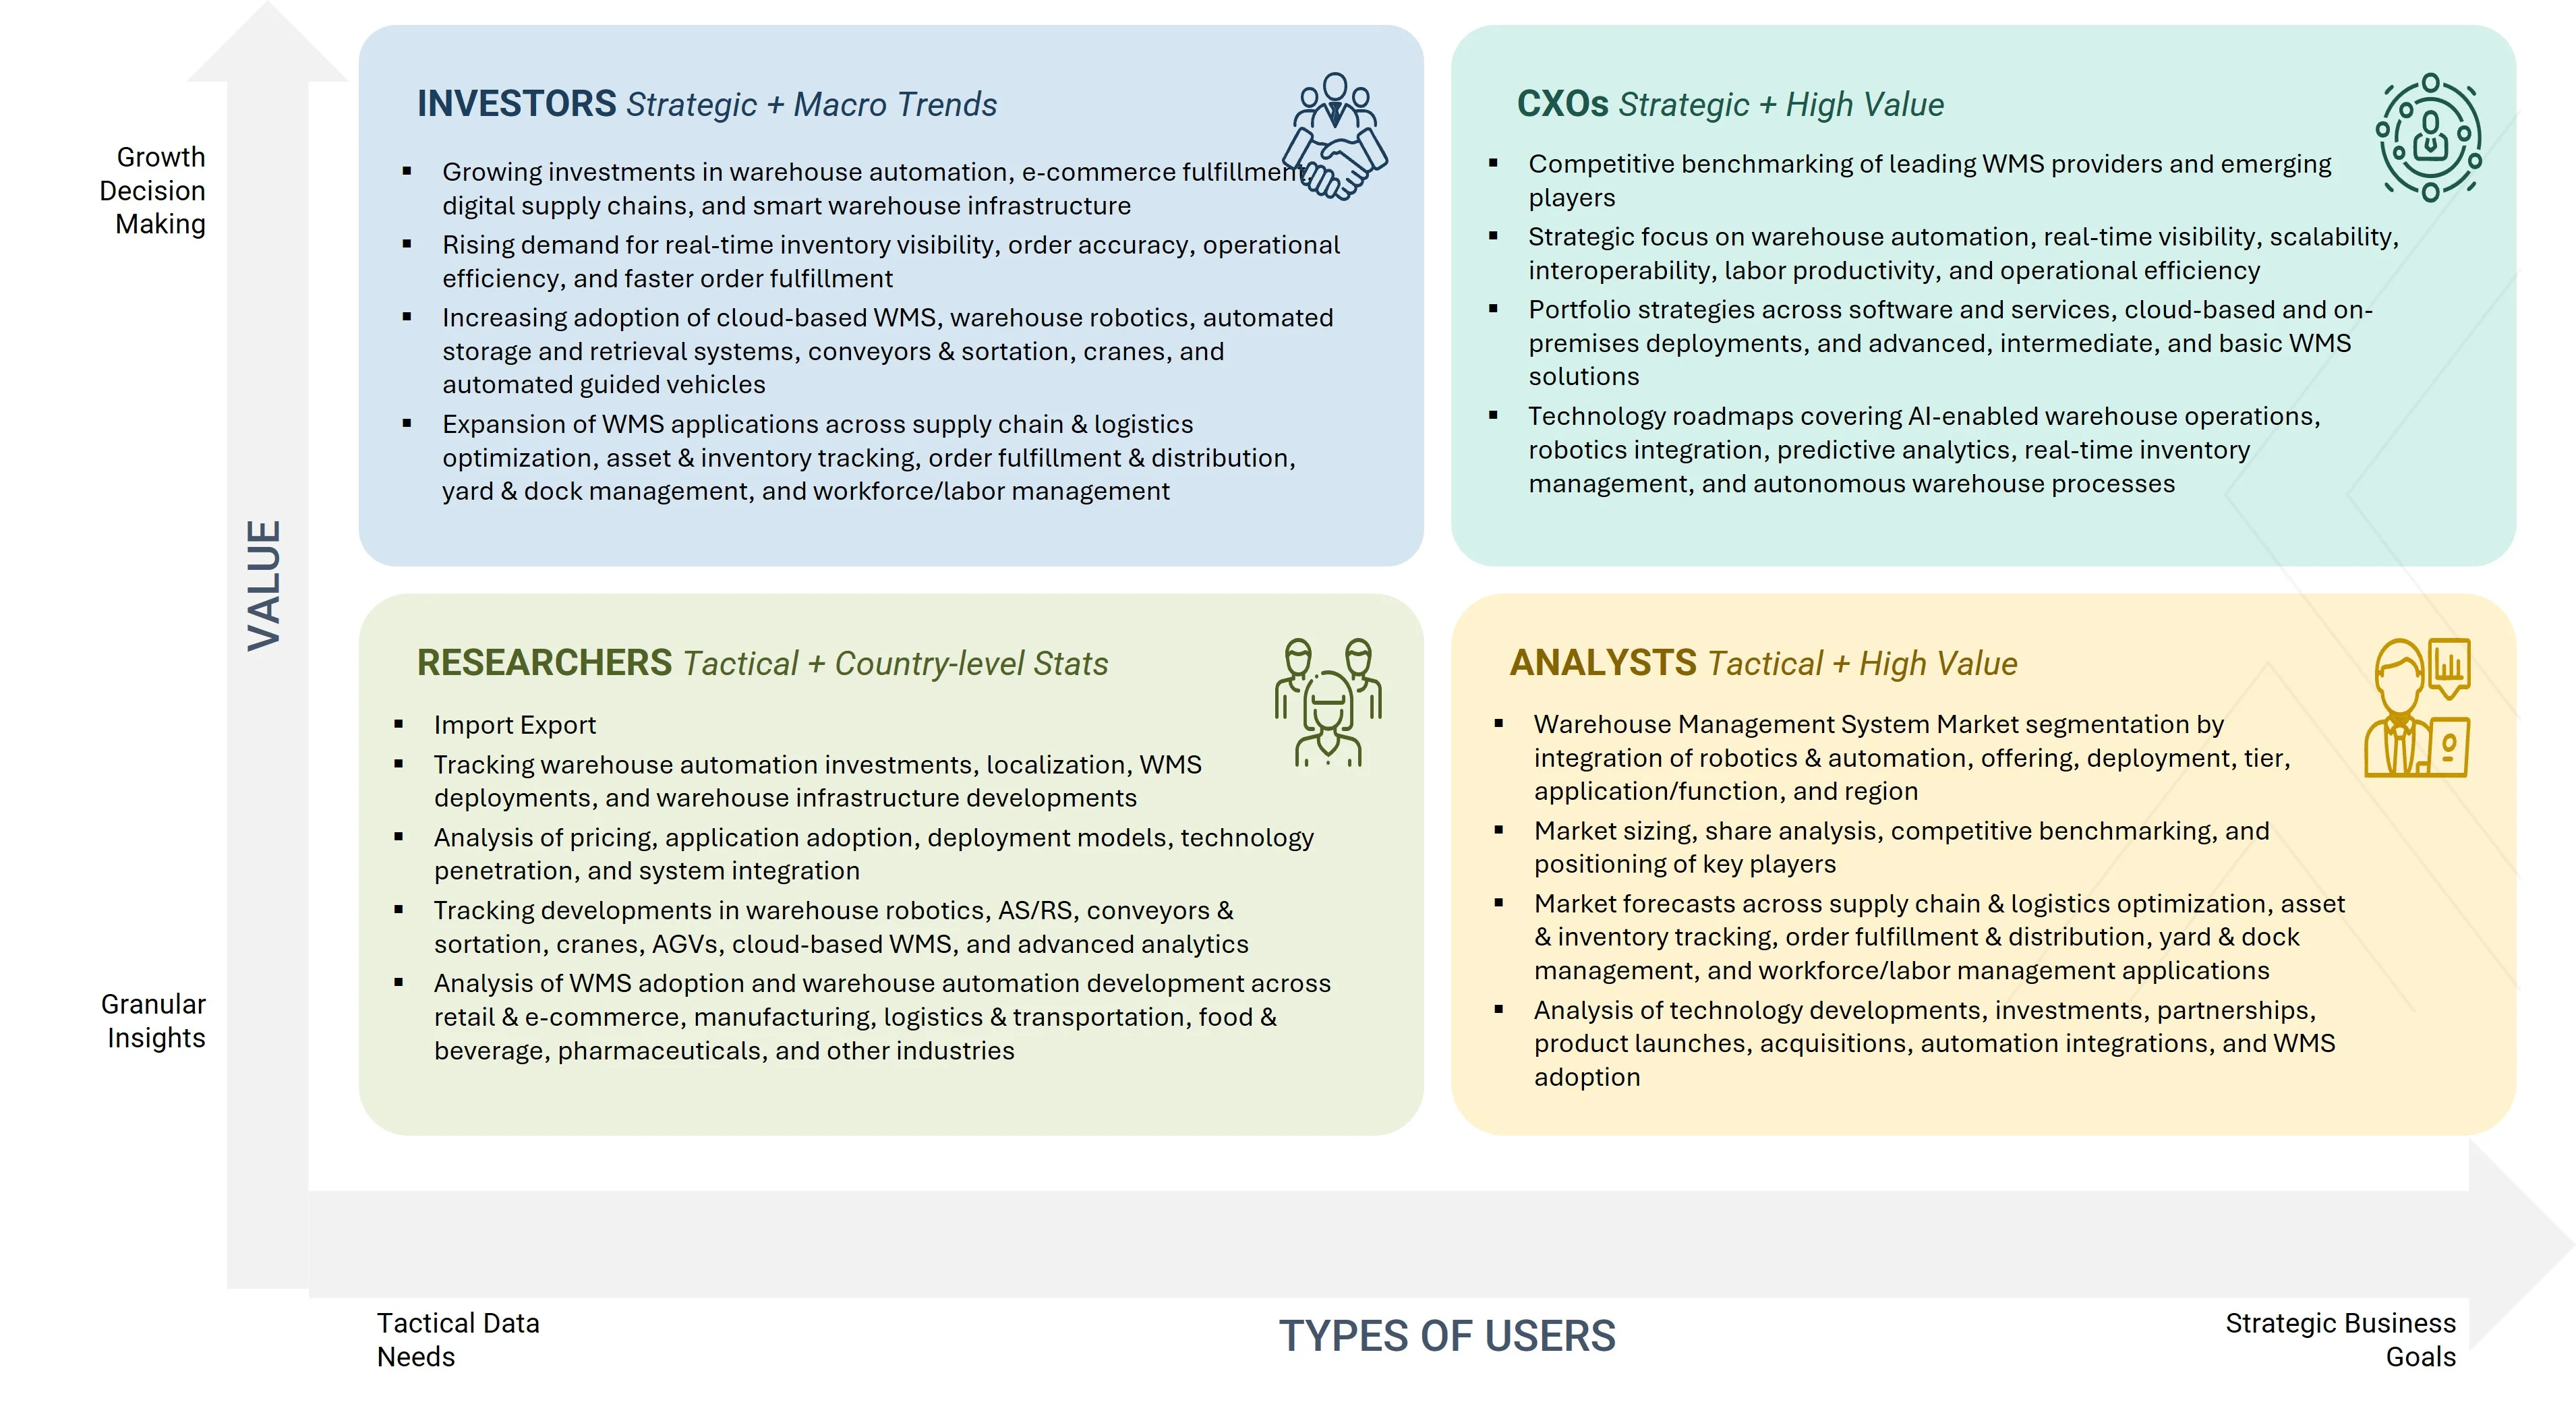
warehouse-management-system-market Content Guide

DELIVERED CUSTOMIZATIONS

We have successfully delivered the following deep-dive customizations:

CLIENT REQUEST CUSTOMIZATION DELIVERED VALUE ADDS
Warehouse Management System Provider Mapping and benchmarking WMS solutions based on deployment, functionality, automation integration, scalability, interoperability, and application requirements Helps identify product gaps, technology opportunities, and areas for portfolio expansion and solution development
Warehouse Automation Solution Provider Benchmarking warehouse automation technologies, including robots, AS/RS, conveyors & sortation, cranes, and AGVs, based on capabilities, applications, integration, and warehouse requirements Supports identification of technology gaps and helps align solution development with evolving warehouse automation requirements
Retailer/E-commerce Operator Assessing WMS requirements across inventory tracking, order fulfillment, supply chain optimization, yard & dock management, and workforce management Supports WMS selection, warehouse modernization planning, and identification of opportunities to improve operational efficiency and fulfillment performance
Logistics/Warehouse Infrastructure Provider Evaluating WMS providers based on functionality, automation integration, deployment model, scalability, interoperability, pricing, and technical support Supports informed technology selection and procurement decisions for warehouse management and automation infrastructure
Enterprise/Original Equipment Manufacturer/System Integrator Benchmarking leading companies across regions, offerings, deployment models, WMS tiers, applications, automation capabilities, and technology developments Helps validate market opportunities and identify potential investment, partnership, integration, and product development areas

RECENT DEVELOPMENTS

  • August 2026 : Oracle reiterated the planned transition from legacy SSH-based RF to Redwood Mobile WMS, encouraging customers to prepare for migration ahead of the scheduled retirement dates. This development further supports the shift toward browser-based, mobile, and modern user interfaces in cloud WMS platforms.
  • May 2026 : Manhattan Associates expanded its AI-enabled WMS capabilities, with Manhattan Active WM continuing to integrate warehouse execution, automation, and real-time operational data through its cloud-native platform. The company also reported recognition of Manhattan Active WM in the 2026 Gartner Magic Quadrant for Warehouse Management Systems.
  • March 2026 : Dematic launched Command Center, a vendor-agnostic warehouse intelligence platform that combines real-time monitoring, AI-enhanced decision support, and operational analytics. The platform brings together data from warehouse automation, software systems, and manual processes to provide a centralized view of warehouse operations and support faster operational decision-making.
  • March 2026 : Manhattan Associates highlighted AI-agent capabilities for supply chain operations, demonstrating how AI agents can automate repetitive activities, identify operational exceptions, and support real-time decision-making. The development reflects the growing integration of agentic AI into WMS and broader supply chain execution platforms.
  • January 2026 : Oracle stopped offering SSH-based RF to new customers and began directing new WMS customers toward Redwood Mobile WMS. Oracle has also announced a phased retirement of the legacy SSH-based RF application for existing customers beginning in January 2027, supporting the transition toward modern web-based warehouse interfaces.

Table of Contents

checkmarkExclusive indicates content/data unique to MarketsandMarkets and not available with any competitors.

TITLE
PAGE NO
1
INTRODUCTION


28
2
RESEARCH METHODOLOGY


33
3
EXECUTIVE SUMMARY


43
4
PREMIUM INSIGHTS


48
5
MARKET OVERVIEW
E-commerce surge and cloud WMS adoption drive transformative supply chain optimizations amid skilled labor shortages.


51
 
5.1
INTRODUCTION


5.2
MARKET DYNAMICS


5.2.1
DRIVERS


5.2.1.1
SURGE IN E-COMMERCE ACTIVITY


5.2.1.2
RISING ADOPTION OF CLOUD-BASED WMS SOLUTIONS


5.2.1.3
RAPID EXPANSION OF DISTRIBUTION CHANNELS


5.2.1.4
GROWING EMPHASIS ON OPTIMIZING SUPPLY CHAIN AND CUSTOMER EXPERIENCE


5.2.2
RESTRAINTS


5.2.2.1
SHORTAGE OF SKILLED PERSONNEL


5.2.2.2
HIGH IMPLEMENTATION AND MAINTENANCE COSTS OF ON-PREMISES WMS FOR SMES


5.2.2.3
CYBERSECURITY THREATS OF CLOUD WMS


5.2.3
OPPORTUNITIES


5.2.3.1
DIGITAL TRANSFORMATION IN SUPPLY CHAIN OPERATIONS


5.2.3.2
RAPID INDUSTRIALIZATION AND INFRASTRUCTURE INVESTMENTS IN EMERGING ECONOMIES


5.2.3.3
DEPLOYMENT OF VIDEO AI TECHNOLOGY IN WMS


5.2.4
CHALLENGES


5.2.4.1
ISSUES IN MAINTAINING SCALABILITY TO ACCOMMODATE LARGE WAREHOUSES


5.2.4.2
LIMITED AWARENESS AMONG SMALL-SIZED BUSINESSES


5.2.4.3
NEED FOR REGULAR SOFTWARE UPGRADES AND ROBUST SECURITY


5.3
TRENDS/DISRUPTIONS IMPACTING CUSTOMER BUSINESS


5.4
PRICING ANALYSIS


5.4.1
PRICING RANGE OF WAREHOUSE MANAGEMENT SYSTEMS, 2024


5.4.2
PRICING RANGE OF WAREHOUSE MANAGEMENT SYSTEMS OFFERED BY KEY PLAYERS, BY DEPLOYMENT MODE, 2024


5.4.3
AVERAGE SELLING PRICE TREND OF WAREHOUSE MANAGEMENT SYSTEMS, BY REGION, 2021–2024


5.5
VALUE CHAIN ANALYSIS


5.6
ECOSYSTEM ANALYSIS


5.7
INVESTMENT AND FUNDING SCENARIO


5.8
TECHNOLOGY ANALYSIS


5.8.1
KEY TECHNOLOGIES


5.8.1.1
RADIO-FREQUENCY IDENTIFICATION (RFID)


5.8.1.2
BARCODE SCANNING


5.8.1.3
AUTOMATION AND ROBOTICS


5.8.1.4
CLOUD COMPUTING


5.8.1.5
INTERNET OF THINGS (IOT)


5.8.2
COMPLIMENTARY TECHNOLOGIES


5.8.2.1
ENTERPRISE RESOURCE PLANNING (ERP)


5.8.2.2
TRANSPORTATION MANAGEMENT SYSTEMS (TMS)


5.8.2.3
DATA ANALYTICS AND BUSINESS INTELLIGENCE TOOLS


5.8.3
ADJACENT TECHNOLOGIES


5.8.3.1
AUGMENTED REALITY (AR) AND VIRTUAL REALITY (VR)


5.8.3.2
VOICE-DIRECTED PICKING


5.8.3.3
PREDICTIVE ANALYTICS AND MACHINE LEARNING


5.9
PATENT ANALYSIS


5.10
TRADE ANALYSIS


5.10.1
IMPORT SCENARIO (HS CODE 847950)


5.10.2
EXPORT SCENARIO (HS CODE 847950)


5.11
KEY CONFERENCES AND EVENTS, 2025–2026


5.12
CASE STUDY ANALYSIS


5.12.1
NAVICO GROUP ADOPTS ORACLE WAREHOUSE MANAGEMENT CLOUD TO IMPROVE WAREHOUSE OPERATIONS AND CUSTOMER SATISFACTION


5.12.2
BATA INDIA IMPLEMENTS ORACLE WAREHOUSE MANAGEMENT CLOUD TO ENHANCE PRODUCTION EFFICIENCY


5.12.3
PORCELANOSA GROUP COLLABORATES WITH MECALUX TO BOOST WAREHOUSE THROUGHPUT USING AUTOMATION SOLUTIONS


5.12.4
DHL SELECTS MANHATTAN ACTIVE WAREHOUSE MANAGEMENT FOR SCALABLE AND AGILE WAREHOUSE OPERATIONS


5.12.5
YKK USES ERHARDT PARTNER GROUP’S LFS WMS TO REDUCE INVENTORY DISCREPANCY AND ENHANCE OPERATIONAL EFFICIENCY


5.13
REGULATORY LANDSCAPE


5.13.1
REGULATORY BODIES, GOVERNMENT AGENCIES, AND OTHER ORGANIZATIONS


5.13.2
STANDARDS


5.14
PORTER'S FIVE FORCES ANALYSIS


5.14.1
THREAT OF NEW ENTRANTS


5.14.2
THREAT OF SUBSTITUTES


5.14.3
BARGAINING POWER OF SUPPLIERS


5.14.4
BARGAINING POWER OF BUYERS


5.14.5
INTENSITY OF COMPETITIVE RIVALRY


5.15
KEY STAKEHOLDERS AND BUYING CRITERIA


5.15.1
KEY STAKEHOLDERS IN BUYING PROCESS


5.15.2
BUYING CRITERIA


5.16
IMPACT OF AI/GEN AI ON WAREHOUSE MANAGEMENT SYSTEM MARKET


5.16.1
INTRODUCTION


5.16.2
AI/GEN AI USE CASES IN WAREHOUSE MANAGEMENT SYSTEM MARKET


5.16.3
FUTURE OF AI/GEN AI IN WAREHOUSE MANAGEMENT SYSTEM MARKET


5.17
IMPACT OF 2025 US TARIFF ON WAREHOUSE MANAGEMENT SYSTEM MARKET


5.17.1
INTRODUCTION


5.17.2
KEY TARIFF RATES


5.17.3
PRICE IMPACT ANALYSIS


5.17.4
IMPACT ON COUNTRIES/REGIONS


5.17.4.1
US


5.17.4.2
EUROPE


5.17.4.3
ASIA PACIFIC


5.17.5
IMPACT ON END USES


6
INTEGRATION OF ROBOTICS AND AUTOMATION INTO WAREHOUSE MANAGEMENT SYSTEMS
Revolutionize efficiency with robotics and automation seamlessly integrated into warehouse operations.


93
 
6.1
INTRODUCTION


6.2
ROBOTS


6.3
AUTOMATED STORAGE AND RETRIEVAL SYSTEMS


6.4
CONVEYORS AND SORTATION SYSTEMS


6.5
CRANES


6.6
AUTOMATED GUIDED VEHICLES


7
WAREHOUSE MANAGEMENT SYSTEM MARKET, BY OFFERING
Market Size & Growth Rate Forecast Analysis to 2030 in USD Million | 10 Data Tables


96
 
7.1
INTRODUCTION


7.2
SOFTWARE


7.2.1
GROWING COMPLEXITY OF SUPPLY CHAINS DUE TO GLOBALIZATION AND E-COMMERCE EXPANSION TO FUEL SEGMENTAL GROWTH


7.3
SERVICES


7.3.1
RISING EMPHASIS ON SMOOTH FUNCTIONING OF WMS TO AUGMENT SEGMENTAL GROWTH


7.3.2
CONSULTING AND INSTALLATION


7.3.3
TESTING


7.3.4
MAINTENANCE


7.3.5
TRAINING


7.3.6
UPGRADES


8
WAREHOUSE MANAGEMENT SYSTEM MARKET, BY DEPLOYMENT MODE
Market Size & Growth Rate Forecast Analysis to 2030 in USD Million | 11 Data Tables


105
 
8.1
INTRODUCTION


8.2
ON-PREMISES


8.2.1
INCREASED CONTROL OVER SERVERS AND ENHANCED SECURITY TO BOLSTER SEGMENTAL GROWTH


8.3
CLOUD-BASED


8.3.1
ENHANCED PROCESSING SPEED AND LOW INITIAL INVESTMENT TO FUEL SEGMENTAL GROWTH


9
WAREHOUSE MANAGEMENT SYSTEM MARKET, BY TIER
Market Size & Growth Rate Forecast Analysis to 2030 in USD Million | 2 Data Tables


113
 
9.1
INTRODUCTION


9.2
ADVANCED (TIER 1)


9.2.1
IDEAL FOR BUSINESSES WITH HIGHLY COMPLEX OPERATIONS TO FOSTER SEGMENTAL GROWTH


9.3
INTERMEDIATE (TIER 2)


9.3.1
HIGH RESPONSIVENESS AND LOW MAINTENANCE COSTS TO ACCELERATE SEGMENTAL GROWTH


9.4
BASIC (TIER 3)


9.4.1
APPLICATION SCOPE IN SMALL-SCALE BUSINESSES WITH BUDGET CONSTRAINTS TO FUEL SEGMENTAL GROWTH


10
WAREHOUSE MANAGEMENT SYSTEM MARKET, BY APPLICATION
Market Size & Growth Rate Forecast Analysis to 2030 in USD Million | 2 Data Tables


119
 
10.1
INTRODUCTION


10.2
SUPPLY CHAIN & LOGISTICS OPTIMIZATION


10.2.1
IMPLEMENTATION OF MANDATE FOR SUSTAINABILITY AND CARBON FOOTPRINT REDUCTIONS TO FOSTER SEGMENTAL GROWTH


10.3
ASSET & INVENTORY TRACKING


10.3.1
ABILITY TO SUPPORT SOPHISTICATED CYCLE COUNTING PROCESSES TO CONTRIBUTE TO SEGMENTAL GROWTH


10.4
ORDER FULFILLMENT & DISTRIBUTION


10.4.1
REQUIREMENT FOR PROCESSING EXTREMELY HIGH VOLUMES OF INDIVIDUALIZED E-COMMERCE ORDERS TO FUEL SEGMENTAL GROWTH


10.5
YARD & DOCK MANAGEMENT


10.5.1
INTEGRATION OF SECURITY AND COMPLIANCE PROTOCOLS TO ACCELERATE SEGMENTAL GROWTH


10.6
WORKFORCE/LABOR MANAGEMENT


10.6.1
NEED FOR IMPROVING EMPLOYEE ENGAGEMENT AND REDUCING SAFETY INCIDENTS TO BOLSTER SEGMENTAL GROWTH


10.7
OTHER APPLICATIONS


11
WAREHOUSE MANAGEMENT SYSTEM MARKET, BY END USE
Market Size & Growth Rate Forecast Analysis to 2030 in USD Million | 56 Data Tables


124
 
11.1
INTRODUCTION


11.2
3PL


11.2.1
ABILITY TO ADDRESS NEEDS OF COMPLEX SUPPLY CHAINS TO EXPEDITE SEGMENTAL GROWTH


11.3
AUTOMOTIVE


11.3.1
STRONG FOCUS ON EFFICIENT PRODUCT DELIVERY AND ORDER FULFILLMENT TO ACCELERATE SEGMENTAL GROWTH


11.4
FOOD & BEVERAGES


11.4.1
GROWING PREFERENCE FOR PACKAGED AND READY-TO-EAT FOODS TO BOOST SEGMENTAL GROWTH


11.5
HEALTHCARE


11.5.1
RISING NEED FOR CONTINUOUS INFORMATION SHARING AND VISIBILITY OF PROCESSES TO FUEL SEGMENTAL GROWTH


11.6
E-COMMERCE


11.6.1
INCREASING TREND OF ELECTRONIC FUND TRANSFER AND INTERNET MARKETING TO CONTRIBUTE TO SEGMENTAL GROWTH


11.7
CHEMICALS


11.7.1
RISING NEED TO COMPLY WITH REGULATIONS TO ACCELERATE SEGMENTAL GROWTH


11.8
ELECTRICALS & ELECTRONICS


11.8.1
INCREASING DEPLOYMENT OF IOT AND AI TECHNOLOGIES TO FOSTER SEGMENTAL GROWTH


11.9
METALS & MACHINERY


11.9.1
RISING AWARENESS ABOUT FINANCIAL LOSSES DUE TO DELAY IN RAW MATERIAL DISTRIBUTION TO BOLSTER SEGMENTAL GROWTH


11.10
OTHER END USES


12
WAREHOUSE MANAGEMENT SYSTEM MARKET, BY REGION
Comprehensive coverage of 8 Regions with country-level deep-dive of 19 Countries | 78 Data Tables.


149
 
12.1
INTRODUCTION


12.2
NORTH AMERICA


12.2.1
MACROECONOMIC OUTLOOK FOR NORTH AMERICA


12.2.2
US


12.2.2.1
PRESENCE OF ADVANCED MANUFACTURING AND WAREHOUSING FACILITIES TO ACCELERATE MARKET GROWTH


12.2.3
CANADA


12.2.3.1
RISING E-COMMERCE ACTIVITIES TO BOOST MARKET GROWTH


12.2.4
MEXICO


12.2.4.1
SHIFTING PREFERENCE TOWARD ONLINE RETAILING TO CREATE LUCRATIVE MARKET GROWTH OPPORTUNITIES


12.3
EUROPE


12.3.1
MACROECONOMIC OUTLOOK FOR EUROPE


12.3.2
GERMANY


12.3.2.1
INCREASING INVESTMENT IN ADVANCED TECHNOLOGIES TO IMPROVE VEHICLES TO FUEL MARKET GROWTH


12.3.3
UK


12.3.3.1
RISING ADOPTION OF OMNICHANNEL RETAIL STRATEGIES TO DRIVE MARKET


12.3.4
FRANCE


12.3.4.1
INCREASING DEPLOYMENT OF INDUSTRIAL AUTOMATION AND ROBOTICS TO EXPEDITE MARKET GROWTH


12.3.5
ITALY


12.3.5.1
RAPID EXPANSION OF E-COMMERCE SECTOR AND INDUSTRIAL MODERNIZATION TO BOOST MARKET GROWTH


12.3.6
SPAIN


12.3.6.1
RISING ADOPTION OF WMS IN 3PL AND HEALTHCARE INDUSTRIES TO FUEL MARKET GROWTH


12.3.7
NORDICS


12.3.7.1
GROWING EMPHASIS ON EFFICIENCY AND TECHNOLOGICAL INNOVATION TO BOLSTER MARKET GROWTH


12.3.8
REST OF EUROPE


12.4
ASIA PACIFIC


12.4.1
MACROECONOMIC OUTLOOK FOR ASIA PACIFIC


12.4.2
CHINA


12.4.2.1
RISE IN INDUSTRIAL MANUFACTURING TO CONTRIBUTE TO MARKET GROWTH


12.4.3
JAPAN


12.4.3.1
HIGH INTERNET PENETRATION AND DEVELOPED DISTRIBUTION INFRASTRUCTURE TO AUGMENT MARKET GROWTH


12.4.4
INDIA


12.4.4.1
GROWTH OF E-COMMERCE SECTOR AND INFRASTRUCTURE DEVELOPMENT TO BOLSTER MARKET GROWTH


12.4.5
SOUTH KOREA


12.4.5.1
THRIVING ELECTRONICS SECTOR TO CONTRIBUTE TO MARKET GROWTH


12.4.6
AUSTRALIA


12.4.6.1
BOOMING E-COMMERCE SECTOR AND PERSISTENT LABOR SHORTAGES TO DRIVE MARKET


12.4.7
REST OF ASIA PACIFIC


12.5
ROW


12.5.1
MACROECONOMIC OUTLOOK FOR ROW


12.5.2
SOUTH AMERICA


12.5.2.1
BRAZIL


12.5.2.1.1
EXPANDING RETAIL SECTOR AND FOCUS ON SUPPLY CHAIN OPTIMIZATION TO BOOST DEMAND


12.5.2.2
ARGENTINA


12.5.2.2.1
GROWING EMPHASIS ON MANAGING COMPLEX SUPPLY CHAINS IN INDUSTRIES TO CONTRIBUTE TO MARKET GROWTH


12.5.2.3
REST OF SOUTH AMERICA


12.5.3
MIDDLE EAST


12.5.3.1
SAUDI ARABIA


12.5.3.1.1
STRONG FOCUS ON TRANSFORMING LOGISTICS HUB TO ACCELERATE MARKET GROWTH


12.5.3.2
UAE


12.5.3.2.1
RAPID ADVANCES IN LOGISTICS INFRASTRUCTURE TO FOSTER MARKET GROWTH


12.5.3.3
QATAR


12.5.3.3.1
INCREASING INVESTMENT IN LOGISTICS AND SUPPLY CHAIN TO DRIVE MARKET


12.5.3.4
OMAN


12.5.3.4.1
BOOMING E-COMMERCE SECTOR AND ECONOMIC DIVERSIFICATION TO EXPEDITE MARKET GROWTH


12.5.3.5
BAHRAIN


12.5.3.5.1
HIGH EMPHASIS ON STREAMLINING SUPPLY CHAINS AND ENHANCING INVENTORY ACCURACY TO ACCELERATE MARKET GROWTH


12.5.3.6
KUWAIT


12.5.3.6.1
STRONG FOCUS ON MODERNIZING SUPPLY CHAIN INFRASTRUCTURE TO BOOST MARKET GROWTH


12.5.3.7
REST OF MIDDLE EAST


12.5.4
AFRICA


12.5.4.1
SOUTH AFRICA


12.5.4.1.1
THRIVING E-COMMERCE AND RETAIL SECTOR TO OFFER LUCRATIVE OPPORTUNITIES FOR MARKET PLAYERS


12.5.4.2
REST OF SOUTH AFRICA


13
COMPETITIVE LANDSCAPE
Uncover key players' winning strategies and market dominance through comprehensive revenue and market share insights.


200
 
13.1
OVERVIEW


13.2
KEY PLAYER STRATEGIES/RIGHT TO WIN, 2021–2025


13.3
REVENUE ANALYSIS, 2020–2024


13.4
MARKET SHARE ANALYSIS, 2024


13.5
COMPANY VALUATION AND FINANCIAL METRICS


13.6
PRODUCT COMPARISON


13.7
COMPANY EVALUATION MATRIX: KEY PLAYERS, 2024


13.7.1
STARS


13.7.2
EMERGING LEADERS


13.7.3
PERVASIVE PLAYERS


13.7.4
PARTICIPANTS


13.7.5
COMPANY FOOTPRINT: KEY PLAYERS, 2024


13.7.5.1
COMPANY FOOTPRINT


13.7.5.2
REGION FOOTPRINT


13.7.5.3
END USE FOOTPRINT


13.7.5.4
OFFERING FOOTPRINT


13.7.5.5
DEPLOYMENT MODE FOOTPRINT


13.8
COMPANY EVALUATION MATRIX: STARTUPS/SMES, 2024


13.8.1
PROGRESSIVE COMPANIES


13.8.2
RESPONSIVE COMPANIES


13.8.3
DYNAMIC COMPANIES


13.8.4
STARTING BLOCKS


13.8.5
COMPETITIVE BENCHMARKING: STARTUPS/SMES, 2024


13.8.5.1
DETAILED LIST OF KEY STARTUPS/SMES


13.8.5.2
COMPETITIVE BENCHMARKING OF KEY STARTUPS/SMES


13.9
COMPETITIVE SCENARIO


13.9.1
PRODUCT LAUNCHES/ENHANCEMENTS


13.9.2
DEALS


13.9.3
OTHER DEVELOPMENTS


14
COMPANY PROFILES
In-depth Company Profiles of Leading Market Players with detailed Business Overview, Product and Service Portfolio, Recent Developments, and Unique Analyst Perspective (MnM View)


224
 
14.1
KEY PLAYERS


14.1.1
MANHATTAN ASSOCIATES


14.1.1.1
BUSINESS OVERVIEW


14.1.1.2
PRODUCTS/SOLUTIONS/SERVICES OFFERED


14.1.1.3
RECENT DEVELOPMENTS


14.1.1.3.1
PRODUCT LAUNCHES/ENHANCEMENTS


14.1.1.3.2
DEALS


14.1.1.3.3
OTHER DEVELOPMENTS


14.1.1.4
MNM VIEW


14.1.1.4.1
KEY STRENGTHS/RIGHT TO WIN


14.1.1.4.2
STRATEGIC CHOICES


14.1.1.4.3
WEAKNESSES/COMPETITIVE THREATS


14.1.2
BLUE YONDER GROUP, INC.


14.1.3
KÖRBER AG


14.1.4
ORACLE


14.1.5
SAP SE


14.1.6
INFOR


14.1.7
EHRHARDT + PARTNER GMBH & CO. KG


14.1.8
MICROSOFT


14.1.9
TECSYS INC.


14.1.10
PTC


14.1.11
REPLY


14.1.12
DEMATIC


14.1.13
SSI SCHAEFER


14.2
OTHER PLAYERS


14.2.1
EPICOR SOFTWARE CORPORATION


14.2.2
EXTENSIV


14.2.3
DATAPEL SYSTEMS


14.2.4
GENERIX GROUP


14.2.5
ECOVIUM


14.2.6
MADE4NET


14.2.7
MICROLISTICS


14.2.8
MECALUX, S.A.


14.2.9
SOFTEON


14.2.10
SYNERGY LOGISTICS LTD


14.2.11
VINCULUM SOLUTIONS PVT. LTD.


14.2.12
TECHNOFORTE


15
APPENDIX


285
 
15.1
INSIGHTS FROM INDUSTRY EXPERTS


15.2
DISCUSSION GUIDE


15.3
KNOWLEDGESTORE: MARKETSANDMARKETS’ SUBSCRIPTION PORTAL


15.4
CUSTOMIZATION OPTIONS


15.5
RELATED REPORTS


15.6
AUTHOR DETAILS


LIST OF TABLES


TABLE 1
WAREHOUSE MANAGEMENT SYSTEM MARKET: INCLUSIONS AND EXCLUSIONS


TABLE 2
WAREHOUSE MANAGEMENT SYSTEM MARKET: SUMMARY OF CHANGES


TABLE 3
WAREHOUSE MANAGEMENT SYSTEM MARKET: MAJOR SECONDARY SOURCES


TABLE 4
WAREHOUSE MANAGEMENT SYSTEM MARKET: PRIMARY INTERVIEW PARTICIPANTS


TABLE 5
WAREHOUSE MANAGEMENT SYSTEM MARKET: RESEARCH ASSUMPTIONS


TABLE 6
WAREHOUSE MANAGEMENT SYSTEM MARKET: RISK ANALYSIS


TABLE 7
PRICING RANGE OF WAREHOUSE MANAGEMENT SYSTEMS, 2024 (USD)


TABLE 8
PRICING RANGE OF WAREHOUSE MANAGEMENT SYSTEMS PROVIDED BY KEY PLAYERS, BY DEPLOYMENT MODE, 2024 (USD)


TABLE 9
AVERAGE SELLING PRICE TREND OF WAREHOUSE MANAGEMENT SYSTEMS, BY REGION, 2021–2024 (USD MILLION)


TABLE 10
ROLE OF COMPANIES IN WAREHOUSE MANAGEMENT SYSTEM ECOSYSTEM


TABLE 11
LIST OF MAJOR PATENTS, 2021–2024


TABLE 12
IMPORT DATA FOR HS CODE 847950-COMPLIANT PRODUCTS, BY COUNTRY, 2020–2024 (USD MILLION)


TABLE 13
EXPORT DATA FOR HS CODE 847950-COMPLIANT PRODUCTS, BY COUNTRY, 2020–2024 (USD MILLION)


TABLE 14
LIST OF KEY CONFERENCES AND EVENTS, 2025–2026


TABLE 15
NORTH AMERICA: LIST OF REGULATORY BODIES, GOVERNMENT AGENCIES, AND OTHER ORGANIZATIONS


TABLE 16
EUROPE: LIST OF REGULATORY BODIES, GOVERNMENT AGENCIES, AND OTHER ORGANIZATIONS


TABLE 17
ASIA PACIFIC: LIST OF REGULATORY BODIES, GOVERNMENT AGENCIES, AND OTHER ORGANIZATIONS


TABLE 18
ROW: LIST OF REGULATORY BODIES, GOVERNMENT AGENCIES, AND OTHER ORGANIZATIONS


TABLE 19
STANDARDS RELATED TO WAREHOUSE MANAGEMENT SYSTEMS


TABLE 20
IMPACT OF PORTER'S FIVE FORCES


TABLE 21
INFLUENCE OF STAKEHOLDERS ON BUYING PROCESS FOR TOP THREE END USES (%)


TABLE 22
KEY BUYING CRITERIA FOR END USES


TABLE 23
US-ADJUSTED RECIPROCAL TARIFF RATES


TABLE 24
WAREHOUSE MANAGEMENT SYSTEM MARKET, BY OFFERING, 2021–2024 (USD MILLION)


TABLE 25
WAREHOUSE MANAGEMENT SYSTEM MARKET, BY OFFERING, 2025–2030 (USD MILLION)


TABLE 26
SOFTWARE: WAREHOUSE MANAGEMENT SYSTEM MARKET, BY END USE, 2021–2024 (USD MILLION)


TABLE 27
SOFTWARE: WAREHOUSE MANAGEMENT SYSTEM MARKET, BY END USE, 2025–2030 (USD MILLION)


TABLE 28
SOFTWARE: WAREHOUSE MANAGEMENT SYSTEM MARKET, BY REGION, 2021–2024 (USD MILLION)


TABLE 29
SOFTWARE: WAREHOUSE MANAGEMENT SYSTEM MARKET, BY REGION, 2025–2030 (USD MILLION)


TABLE 30
SERVICES: WAREHOUSE MANAGEMENT SYSTEM MARKET, BY END USE, 2021–2024 (USD MILLION)


TABLE 31
SERVICES: WAREHOUSE MANAGEMENT SYSTEM MARKET, BY END USE, 2025–2030 (USD MILLION)


TABLE 32
SERVICES: WAREHOUSE MANAGEMENT SYSTEM MARKET, BY REGION, 2021–2024 (USD MILLION)


TABLE 33
SERVICES: WAREHOUSE MANAGEMENT SYSTEM MARKET, BY REGION, 2025–2030 (USD MILLION)


TABLE 34
WAREHOUSE MANAGEMENT SYSTEM MARKET, BY DEPLOYMENT MODE, 2021–2024 (USD MILLION)


TABLE 35
WAREHOUSE MANAGEMENT SYSTEM MARKET, BY DEPLOYMENT MODE, 2025–2030 (USD MILLION)


TABLE 36
ON-PREMISES: WAREHOUSE MANAGEMENT SYSTEM MARKET, BY END USE, 2021–2024 (USD MILLION)


TABLE 37
ON-PREMISES: WAREHOUSE MANAGEMENT SYSTEM MARKET, BY END USE, 2025–2030 (USD MILLION)


TABLE 38
ON-PREMISES: WAREHOUSE MANAGEMENT SYSTEM MARKET, BY REGION, 2021–2024 (USD MILLION)


TABLE 39
ON-PREMISES: WAREHOUSE MANAGEMENT SYSTEM MARKET, BY REGION, 2025–2030 (USD MILLION)


TABLE 40
CLOUD-BASED: WAREHOUSE MANAGEMENT SYSTEM MARKET, BY END USE, 2021–2024 (USD MILLION)


TABLE 41
CLOUD-BASED: WAREHOUSE MANAGEMENT SYSTEM MARKET, BY END USE, 2025–2030 (USD MILLION)


TABLE 42
CLOUD-BASED: WAREHOUSE MANAGEMENT SYSTEM MARKET, BY REGION, 2021–2024 (USD MILLION)


TABLE 43
CLOUD-BASED: WAREHOUSE MANAGEMENT SYSTEM MARKET, BY REGION, 2025–2030 (USD MILLION)


TABLE 44
ON-PREMISES VS. CLOUD-BASED DEPLOYMENT MODES


TABLE 45
WAREHOUSE MANAGEMENT SYSTEM MARKET, BY TIER, 2021–2024 (USD MILLION)


TABLE 46
WAREHOUSE MANAGEMENT SYSTEM MARKET, BY TIER, 2025–2030 (USD MILLION)


TABLE 47
WAREHOUSE MANAGEMENT SYSTEM MARKET, BY APPLICATION, 2021–2024 (USD MILLION)


TABLE 48
WAREHOUSE MANAGEMENT SYSTEM MARKET, BY APPLICATION, 2025–2030 (USD MILLION)


TABLE 49
WAREHOUSE MANAGEMENT SYSTEM MARKET, BY END USE, 2021–2024 (USD MILLION)


TABLE 50
WAREHOUSE MANAGEMENT SYSTEM MARKET, BY END USE, 2025–2030 (USD MILLION)


TABLE 51
3PL: WAREHOUSE MANAGEMENT SYSTEM MARKET, BY OFFERING, 2021–2024 (USD MILLION)


TABLE 52
3PL: WAREHOUSE MANAGEMENT SYSTEM MARKET, BY OFFERING, 2025–2030 (USD MILLION)


TABLE 53
3PL: WAREHOUSE MANAGEMENT SYSTEM MARKET, BY DEPLOYMENT MODE, 2021–2024 (USD MILLION)


TABLE 54
3PL: WAREHOUSE MANAGEMENT SYSTEM MARKET, BY DEPLOYMENT MODE, 2025–2030 (USD MILLION)


TABLE 55
3PL: WAREHOUSE MANAGEMENT SYSTEM MARKET, BY REGION, 2021–2024 (USD MILLION)


TABLE 56
3PL: WAREHOUSE MANAGEMENT SYSTEM MARKET, BY REGION, 2025–2030 (USD MILLION)


TABLE 57
AUTOMOTIVE: WAREHOUSE MANAGEMENT SYSTEM MARKET, BY OFFERING, 2021–2024 (USD MILLION)


TABLE 58
AUTOMOTIVE: WAREHOUSE MANAGEMENT SYSTEM MARKET, BY OFFERING, 2025–2030 (USD MILLION)


TABLE 59
AUTOMOTIVE: WAREHOUSE MANAGEMENT SYSTEM MARKET, BY DEPLOYMENT MODE, 2021–2024 (USD MILLION)


TABLE 60
AUTOMOTIVE: WAREHOUSE MANAGEMENT SYSTEM MARKET, BY DEPLOYMENT MODE, 2025–2030 (USD MILLION)


TABLE 61
AUTOMOTIVE: WAREHOUSE MANAGEMENT SYSTEM MARKET, BY REGION, 2021–2024 (USD MILLION)


TABLE 62
AUTOMOTIVE: WAREHOUSE MANAGEMENT SYSTEM MARKET, BY REGION, 2025–2030 (USD MILLION)


TABLE 63
FOOD & BEVERAGES: WAREHOUSE MANAGEMENT SYSTEM MARKET, BY OFFERING, 2021–2024 (USD MILLION)


TABLE 64
FOOD & BEVERAGES: WAREHOUSE MANAGEMENT SYSTEM MARKET, BY OFFERING, 2025–2030 (USD MILLION)


TABLE 65
FOOD & BEVERAGES: WAREHOUSE MANAGEMENT SYSTEM MARKET, BY DEPLOYMENT MODE, 2021–2024 (USD MILLION)


TABLE 66
FOOD & BEVERAGES: WAREHOUSE MANAGEMENT SYSTEM MARKET, BY DEPLOYMENT MODE, 2025–2030 (USD MILLION)


TABLE 67
FOOD & BEVERAGES: WAREHOUSE MANAGEMENT SYSTEM MARKET, BY REGION, 2021–2024 (USD MILLION)


TABLE 68
FOOD & BEVERAGES: WAREHOUSE MANAGEMENT SYSTEM MARKET, BY REGION, 2025–2030 (USD MILLION)


TABLE 69
HEALTHCARE: WAREHOUSE MANAGEMENT SYSTEM MARKET, BY OFFERING, 2021–2024 (USD MILLION)


TABLE 70
HEALTHCARE: WAREHOUSE MANAGEMENT SYSTEM MARKET, BY OFFERING, 2025–2030 (USD MILLION)


TABLE 71
HEALTHCARE: WAREHOUSE MANAGEMENT SYSTEM MARKET, BY DEPLOYMENT MODE, 2021–2024 (USD MILLION)


TABLE 72
HEALTHCARE: WAREHOUSE MANAGEMENT SYSTEM MARKET, BY DEPLOYMENT MODE, 2025–2030 (USD MILLION)


TABLE 73
HEALTHCARE: WAREHOUSE MANAGEMENT SYSTEM MARKET, BY REGION, 2021–2024 (USD MILLION)


TABLE 74
HEALTHCARE: WAREHOUSE MANAGEMENT SYSTEM MARKET, BY REGION, 2025–2030 (USD MILLION)


TABLE 75
E-COMMERCE: WAREHOUSE MANAGEMENT SYSTEM MARKET, BY OFFERING, 2021–2024 (USD MILLION)


TABLE 76
E-COMMERCE: WAREHOUSE MANAGEMENT SYSTEM MARKET, BY OFFERING, 2025–2030 (USD MILLION)


TABLE 77
E-COMMERCE: WAREHOUSE MANAGEMENT SYSTEM MARKET, BY DEPLOYMENT MODE, 2021–2024 (USD MILLION)


TABLE 78
E-COMMERCE: WAREHOUSE MANAGEMENT SYSTEM MARKET, BY DEPLOYMENT MODE, 2025–2030 (USD MILLION)


TABLE 79
E-COMMERCE: WAREHOUSE MANAGEMENT SYSTEM MARKET, BY REGION, 2021–2024 (USD MILLION)


TABLE 80
E-COMMERCE: WAREHOUSE MANAGEMENT SYSTEM MARKET, BY REGION, 2025–2030 (USD MILLION)


TABLE 81
CHEMICALS: WAREHOUSE MANAGEMENT SYSTEM MARKET, BY OFFERING, 2021–2024 (USD MILLION)


TABLE 82
CHEMICALS: WAREHOUSE MANAGEMENT SYSTEM MARKET, BY OFFERING, 2025–2030 (USD MILLION)


TABLE 83
CHEMICALS: WAREHOUSE MANAGEMENT SYSTEM MARKET, BY DEPLOYMENT MODE, 2021–2024 (USD MILLION)


TABLE 84
CHEMICALS: WAREHOUSE MANAGEMENT SYSTEM MARKET, BY DEPLOYMENT MODE, 2025–2030 (USD MILLION)


TABLE 85
CHEMICALS: WAREHOUSE MANAGEMENT SYSTEM MARKET, BY REGION, 2021–2024 (USD MILLION)


TABLE 86
CHEMICALS: WAREHOUSE MANAGEMENT SYSTEM MARKET, BY REGION, 2025–2030 (USD MILLION)


TABLE 87
ELECTRICALS & ELECTRONICS: WAREHOUSE MANAGEMENT SYSTEM MARKET, BY OFFERING, 2021–2024 (USD MILLION)


TABLE 88
ELECTRICALS & ELECTRONICS: WAREHOUSE MANAGEMENT SYSTEM MARKET, BY OFFERING, 2025–2030 (USD MILLION)


TABLE 89
ELECTRICALS & ELECTRONICS: WAREHOUSE MANAGEMENT SYSTEM MARKET, BY DEPLOYMENT MODE, 2021–2024 (USD MILLION)


TABLE 90
ELECTRICALS & ELECTRONICS: WAREHOUSE MANAGEMENT SYSTEM MARKET, BY DEPLOYMENT MODE, 2025–2030 (USD MILLION)


TABLE 91
ELECTRICALS & ELECTRONICS: WAREHOUSE MANAGEMENT SYSTEM MARKET, BY REGION, 2021–2024 (USD MILLION)


TABLE 92
ELECTRICALS & ELECTRONICS: WAREHOUSE MANAGEMENT SYSTEM MARKET, BY REGION, 2025–2030 (USD MILLION)


TABLE 93
METALS & MACHINERY: WAREHOUSE MANAGEMENT SYSTEM MARKET, BY OFFERING, 2021–2024 (USD MILLION)


TABLE 94
METALS & MACHINERY: WAREHOUSE MANAGEMENT SYSTEM MARKET, BY OFFERING, 2025–2030 (USD MILLION)


TABLE 95
METALS & MACHINERY: WAREHOUSE MANAGEMENT SYSTEM MARKET, BY DEPLOYMENT MODE, 2021–2024 (USD MILLION)


TABLE 96
METALS & MACHINERY: WAREHOUSE MANAGEMENT SYSTEM MARKET, BY DEPLOYMENT MODE, 2025–2030 (USD MILLION)


TABLE 97
METALS & MACHINERY: WAREHOUSE MANAGEMENT SYSTEM MARKET, BY REGION, 2021–2024 (USD MILLION)


TABLE 98
METALS & MACHINERY: WAREHOUSE MANAGEMENT SYSTEM MARKET, BY REGION, 2025–2030 (USD MILLION)


TABLE 99
OTHER END USES: WAREHOUSE MANAGEMENT SYSTEM MARKET, BY OFFERING, 2021–2024 (USD MILLION)


TABLE 100
OTHER END USES: WAREHOUSE MANAGEMENT SYSTEM MARKET, BY OFFERING, 2025–2030 (USD MILLION)


TABLE 101
OTHER END USES: WAREHOUSE MANAGEMENT SYSTEM MARKET, BY DEPLOYMENT MODE, 2021–2024 (USD MILLION)


TABLE 102
OTHER END USES: WAREHOUSE MANAGEMENT SYSTEM MARKET, BY DEPLOYMENT MODE, 2025–2030 (USD MILLION)


TABLE 103
OTHER END USES: WAREHOUSE MANAGEMENT SYSTEM MARKET, BY REGION, 2021–2024 (USD MILLION)


TABLE 104
OTHER END USES: WAREHOUSE MANAGEMENT SYSTEM MARKET, BY REGION, 2025–2030 (USD MILLION)


TABLE 105
WAREHOUSE MANAGEMENT SYSTEM MARKET, BY REGION, 2021–2024 (USD MILLION)


TABLE 106
WAREHOUSE MANAGEMENT SYSTEM MARKET, BY REGION, 2025–2030 (USD MILLION)


TABLE 107
NORTH AMERICA: WAREHOUSE MANAGEMENT SYSTEM MARKET, BY COUNTRY, 2021–2024 (USD MILLION)


TABLE 108
NORTH AMERICA: WAREHOUSE MANAGEMENT SYSTEM MARKET, BY COUNTRY, 2025–2030 (USD MILLION)


TABLE 109
NORTH AMERICA: WAREHOUSE MANAGEMENT SYSTEM MARKET, BY OFFERING, 2021–2024 (USD MILLION)


TABLE 110
NORTH AMERICA: WAREHOUSE MANAGEMENT SYSTEM MARKET, BY OFFERING, 2025–2030 (USD MILLION)


TABLE 111
NORTH AMERICA: WAREHOUSE MANAGEMENT SYSTEM MARKET, BY DEPLOYMENT MODE, 2021–2024 (USD MILLION)


TABLE 112
NORTH AMERICA: WAREHOUSE MANAGEMENT SYSTEM MARKET, BY DEPLOYMENT MODE, 2025–2030 (USD MILLION)


TABLE 113
NORTH AMERICA: WAREHOUSE MANAGEMENT SYSTEM MARKET, BY END USE, 2021–2024 (USD MILLION)


TABLE 114
NORTH AMERICA: WAREHOUSE MANAGEMENT SYSTEM MARKET, BY END USE, 2025–2030 (USD MILLION)


TABLE 115
US: WAREHOUSE MANAGEMENT SYSTEM MARKET, BY END USE, 2021–2024 (USD MILLION)


TABLE 116
US: WAREHOUSE MANAGEMENT SYSTEM MARKET, BY END USE, 2025–2030 (USD MILLION)


TABLE 117
CANADA: WAREHOUSE MANAGEMENT SYSTEM MARKET, BY END USE, 2021–2024 (USD MILLION)


TABLE 118
CANADA: WAREHOUSE MANAGEMENT SYSTEM MARKET, BY END USE, 2025–2030 (USD MILLION)


TABLE 119
MEXICO: WAREHOUSE MANAGEMENT SYSTEM MARKET, BY END USE, 2021–2024 (USD MILLION)


TABLE 120
MEXICO: WAREHOUSE MANAGEMENT SYSTEM MARKET, BY END USE, 2025–2030 (USD MILLION)


TABLE 121
EUROPE: WAREHOUSE MANAGEMENT SYSTEM MARKET, BY COUNTRY, 2021–2024 (USD MILLION)


TABLE 122
EUROPE: WAREHOUSE MANAGEMENT SYSTEM MARKET, BY COUNTRY, 2025–2030 (USD MILLION)


TABLE 123
EUROPE: WAREHOUSE MANAGEMENT SYSTEM MARKET, BY OFFERING, 2021–2024 (USD MILLION)


TABLE 124
EUROPE: WAREHOUSE MANAGEMENT SYSTEM MARKET, BY OFFERING, 2025–2030 (USD MILLION)


TABLE 125
EUROPE: WAREHOUSE MANAGEMENT SYSTEM MARKET, BY DEPLOYMENT MODE, 2021–2024 (USD MILLION)


TABLE 126
EUROPE: WAREHOUSE MANAGEMENT SYSTEM MARKET, BY DEPLOYMENT MODE, 2025–2030 (USD MILLION)


TABLE 127
EUROPE: WAREHOUSE MANAGEMENT SYSTEM MARKET, BY END USE, 2021–2024 (USD MILLION)


TABLE 128
EUROPE: WAREHOUSE MANAGEMENT SYSTEM MARKET, BY END USE, 2025–2030 (USD MILLION)


TABLE 129
GERMANY: WAREHOUSE MANAGEMENT SYSTEM MARKET, BY END USE, 2021–2024 (USD MILLION)


TABLE 130
GERMANY: WAREHOUSE MANAGEMENT SYSTEM MARKET, BY END USE, 2025–2030 (USD MILLION)


TABLE 131
UK: WAREHOUSE MANAGEMENT SYSTEM MARKET, BY END USE, 2021–2024 (USD MILLION)


TABLE 132
UK: WAREHOUSE MANAGEMENT SYSTEM MARKET, BY END USE, 2025–2030 (USD MILLION)


TABLE 133
FRANCE: WAREHOUSE MANAGEMENT SYSTEM MARKET, BY END USE, 2021–2024 (USD MILLION)


TABLE 134
FRANCE: WAREHOUSE MANAGEMENT SYSTEM MARKET, BY END USE, 2025–2030 (USD MILLION)


TABLE 135
ITALY: WAREHOUSE MANAGEMENT SYSTEM MARKET, BY END USE, 2021–2024 (USD MILLION)


TABLE 136
ITALY: WAREHOUSE MANAGEMENT SYSTEM MARKET, BY END USE, 2025–2030 (USD MILLION)


TABLE 137
SPAIN: WAREHOUSE MANAGEMENT SYSTEM MARKET, BY END USE, 2021–2024 (USD MILLION)


TABLE 138
SPAIN: WAREHOUSE MANAGEMENT SYSTEM MARKET, BY END USE, 2025–2030 (USD MILLION)


TABLE 139
NORDICS: WAREHOUSE MANAGEMENT SYSTEM MARKET, BY END USE, 2021–2024 (USD MILLION)


TABLE 140
NORDICS: WAREHOUSE MANAGEMENT SYSTEM MARKET, BY END USE, 2025–2030 (USD MILLION)


TABLE 141
REST OF EUROPE: WAREHOUSE MANAGEMENT SYSTEM MARKET, BY END USE, 2021–2024 (USD MILLION)


TABLE 142
REST OF EUROPE: WAREHOUSE MANAGEMENT SYSTEM MARKET, BY END USE, 2025–2030 (USD MILLION)


TABLE 143
ASIA PACIFIC: WAREHOUSE MANAGEMENT SYSTEM MARKET, BY COUNTRY, 2021–2024 (USD MILLION)


TABLE 144
ASIA PACIFIC: WAREHOUSE MANAGEMENT SYSTEM MARKET, BY COUNTRY, 2025–2030 (USD MILLION)


TABLE 145
ASIA PACIFIC: WAREHOUSE MANAGEMENT SYSTEM MARKET, BY OFFERING, 2021–2024 (USD MILLION)


TABLE 146
ASIA PACIFIC: WAREHOUSE MANAGEMENT SYSTEM MARKET, BY OFFERING, 2025–2030 (USD MILLION)


TABLE 147
ASIA PACIFIC: WAREHOUSE MANAGEMENT SYSTEM MARKET, BY DEPLOYMENT MODE, 2021–2024 (USD MILLION)


TABLE 148
ASIA PACIFIC: WAREHOUSE MANAGEMENT SYSTEM MARKET, BY DEPLOYMENT MODE, 2025–2030 (USD MILLION)


TABLE 149
ASIA PACIFIC: WAREHOUSE MANAGEMENT SYSTEM MARKET, BY END USE, 2021–2024 (USD MILLION)


TABLE 150
ASIA PACIFIC: WAREHOUSE MANAGEMENT SYSTEM MARKET, BY END USE, 2025–2030 (USD MILLION)


TABLE 151
CHINA: WAREHOUSE MANAGEMENT SYSTEM MARKET, BY END USE, 2021–2024 (USD MILLION)


TABLE 152
CHINA: WAREHOUSE MANAGEMENT SYSTEM MARKET, BY END USE, 2025–2030 (USD MILLION)


TABLE 153
JAPAN: WAREHOUSE MANAGEMENT SYSTEM MARKET, BY END USE, 2021–2024 (USD MILLION)


TABLE 154
JAPAN: WAREHOUSE MANAGEMENT SYSTEM MARKET, BY END USE, 2025–2030 (USD MILLION)


TABLE 155
INDIA: WAREHOUSE MANAGEMENT SYSTEM MARKET, BY END USE, 2021–2024 (USD MILLION)


TABLE 156
INDIA: WAREHOUSE MANAGEMENT SYSTEM MARKET, BY END USE, 2025–2030 (USD MILLION)


TABLE 157
SOUTH KOREA: WAREHOUSE MANAGEMENT SYSTEM MARKET, BY END USE, 2021–2024 (USD MILLION)


TABLE 158
SOUTH KOREA: WAREHOUSE MANAGEMENT SYSTEM MARKET, BY END USE, 2025–2030 (USD MILLION)


TABLE 159
AUSTRALIA: WAREHOUSE MANAGEMENT SYSTEM MARKET, BY END USE, 2021–2024 (USD MILLION)


TABLE 160
AUSTRALIA: WAREHOUSE MANAGEMENT SYSTEM MARKET, BY END USE, 2025–2030 (USD MILLION)


TABLE 161
REST OF ASIA PACIFIC: WAREHOUSE MANAGEMENT SYSTEM MARKET, BY END USE, 2021–2024 (USD MILLION)


TABLE 162
REST OF ASIA PACIFIC: WAREHOUSE MANAGEMENT SYSTEM MARKET, BY END USE, 2025–2030 (USD MILLION)


TABLE 163
ROW: WAREHOUSE MANAGEMENT SYSTEM MARKET, BY REGION, 2021–2024 (USD MILLION)


TABLE 164
ROW: WAREHOUSE MANAGEMENT SYSTEM MARKET, BY REGION, 2025–2030 (USD MILLION)


TABLE 165
ROW: WAREHOUSE MANAGEMENT SYSTEM MARKET, BY OFFERING, 2021–2024 (USD MILLION)


TABLE 166
ROW: WAREHOUSE MANAGEMENT SYSTEM MARKET, BY OFFERING, 2025–2030 (USD MILLION)


TABLE 167
ROW: WAREHOUSE MANAGEMENT SYSTEM MARKET, BY DEPLOYMENT MODE, 2021–2024 (USD MILLION)


TABLE 168
ROW: WAREHOUSE MANAGEMENT SYSTEM MARKET, BY DEPLOYMENT MODE, 2025–2030 (USD MILLION)


TABLE 169
ROW: WAREHOUSE MANAGEMENT SYSTEM MARKET, BY END USE, 2021–2024 (USD MILLION)


TABLE 170
ROW: WAREHOUSE MANAGEMENT SYSTEM MARKET, BY END USE, 2025–2030 (USD MILLION)


TABLE 171
SOUTH AMERICA: WAREHOUSE MANAGEMENT SYSTEM MARKET, BY COUNTRY, 2021–2024 (USD MILLION)


TABLE 172
SOUTH AMERICA: WAREHOUSE MANAGEMENT SYSTEM MARKET, BY REGION, 2025–2030 (USD MILLION)


TABLE 173
SOUTH AMERICA: WAREHOUSE MANAGEMENT SYSTEM MARKET, BY END USE, 2021–2024 (USD MILLION)


TABLE 174
SOUTH AMERICA: WAREHOUSE MANAGEMENT SYSTEM MARKET, BY END USE, 2025–2030 (USD MILLION)


TABLE 175
MIDDLE EAST: WAREHOUSE MANAGEMENT SYSTEM MARKET, BY COUNTRY, 2021–2024 (USD MILLION)


TABLE 176
MIDDLE EAST: WAREHOUSE MANAGEMENT SYSTEM MARKET, BY COUNTRY, 2025–2030 (USD MILLION)


TABLE 177
MIDDLE EAST: WAREHOUSE MANAGEMENT SYSTEM MARKET, BY END USE, 2021–2024 (USD MILLION)


TABLE 178
MIDDLE EAST: WAREHOUSE MANAGEMENT SYSTEM MARKET, BY END USE, 2025–2030 (USD MILLION)


TABLE 179
AFRICA: WAREHOUSE MANAGEMENT SYSTEM MARKET, BY COUNTRY, 2021–2024 (USD MILLION)


TABLE 180
AFRICA: WAREHOUSE MANAGEMENT SYSTEM MARKET, BY COUNTRY, 2025–2030 (USD MILLION)


TABLE 181
AFRICA: WAREHOUSE MANAGEMENT SYSTEM MARKET, BY END USE, 2021–2024 (USD MILLION)


TABLE 182
AFRICA: WAREHOUSE MANAGEMENT SYSTEM MARKET, BY END USE, 2025–2030 (USD MILLION)


TABLE 183
WAREHOUSE MANAGEMENT SYSTEM MARKET: OVERVIEW OF STRATEGIES ADOPTED BY KEY PLAYERS, JANUARY 2021–JULY 2025


TABLE 184
WAREHOUSE MANAGEMENT SYSTEM MARKET: DEGREE OF COMPETITION, 2024


TABLE 185
WAREHOUSE MANAGEMENT SYSTEM MARKET: REGION FOOTPRINT


TABLE 186
WAREHOUSE MANAGEMENT SYSTEM MARKET: END USE FOOTPRINT


TABLE 187
WAREHOUSE MANAGEMENT SYSTEM MARKET: OFFERING FOOTPRINT


TABLE 188
WAREHOUSE MANAGEMENT SYSTEM MARKET: DEPLOYMENT MODE FOOTPRINT


TABLE 189
WAREHOUSE MANAGEMENT SYSTEM MARKET: DETAILED LIST OF KEY STARTUPS/SMES


TABLE 190
WAREHOUSE MANAGEMENT SYSTEM MARKET: COMPETITIVE BENCHMARKING OF KEY STARTUPS/SMES


TABLE 191
WAREHOUSE MANAGEMENT SYSTEM MARKET: PRODUCT LAUNCHES/ENHANCEMENTS, JANUARY 2021–JULY 2025


TABLE 192
WAREHOUSE MANAGEMENT SYSTEM MARKET: DEALS, JANUARY 2021–JULY 2025


TABLE 193
WAREHOUSE MANAGEMENT SYSTEM MARKET: OTHER DEVELOPMENTS, JANUARY 2021–JULY 2025


TABLE 194
MANHATTAN ASSOCIATES: COMPANY OVERVIEW


TABLE 195
MANHATTAN ASSOCIATES: PRODUCTS/SOLUTIONS/SERVICES OFFERED


TABLE 196
MANHATTAN ASSOCIATES: PRODUCT LAUNCHES/ENHANCEMENTS


TABLE 197
MANHATTAN ASSOCIATES: DEALS


TABLE 198
MANHATTAN ASSOCIATES: OTHER DEVELOPMENTS


TABLE 199
BLUE YONDER GROUP, INC.: COMPANY OVERVIEW


TABLE 200
BLUE YONDER GROUP, INC.: PRODUCTS/SOLUTIONS/SERVICES OFFERED


TABLE 201
BLUE YONDER GROUP, INC.: PRODUCT LAUNCHES/ENHANCEMENTS


TABLE 202
BLUE YONDER GROUP, INC.: DEALS


TABLE 203
BLUE YONDER GROUP, INC.: OTHER DEVELOPMENTS


TABLE 204
KÖRBER AG: COMPANY OVERVIEW


TABLE 205
KÖRBER AG: PRODUCTS/SOLUTIONS/SERVICES OFFERED


TABLE 206
KÖRBER AG: PRODUCT LAUNCHES/ENHANCEMENTS


TABLE 207
KÖRBER AG: DEALS


TABLE 208
KÖRBER AG: OTHER DEVELOPMENTS


TABLE 209
ORACLE: COMPANY OVERVIEW


TABLE 210
ORACLE: PRODUCTS/SOLUTIONS/SERVICES OFFERED


TABLE 211
ORACLE: PRODUCT LAUNCHES/ENHANCEMENTS


TABLE 212
SAP SE: COMPANY OVERVIEW


TABLE 213
SAP SE: PRODUCTS/SOLUTIONS/SERVICES OFFERED


TABLE 214
SAP SE: PRODUCT LAUNCHES/ENHANCEMENTS


TABLE 215
SAP SE: DEALS


TABLE 216
SAP SE: OTHER DEVELOPMENTS


TABLE 217
INFOR: COMPANY OVERVIEW


TABLE 218
INFOR: PRODUCTS/SOLUTIONS/SERVICES OFFERED


TABLE 219
INFOR: PRODUCT LAUNCHES/ENHANCEMENTS


TABLE 220
INFOR: OTHER DEVELOPMENTS


TABLE 221
EHRHARDT + PARTNER GMBH & CO. KG: COMPANY OVERVIEW


TABLE 222
EHRHARDT + PARTNER GMBH & CO. KG: PRODUCTS/SOLUTIONS/SERVICES OFFERED


TABLE 223
EHRHARDT + PARTNER GMBH & CO. KG: PRODUCT LAUNCHES/ENHANCEMENTS


TABLE 224
EHRHARDT + PARTNER GMBH & CO. KG: OTHER DEVELOPMENTS


TABLE 225
MICROSOFT: COMPANY OVERVIEW


TABLE 226
MICROSOFT: PRODUCTS/SOLUTIONS/SERVICES OFFERED


TABLE 227
MICROSOFT: PRODUCT LAUNCHES/ENHANCEMENTS


TABLE 228
TECSYS INC.: COMPANY OVERVIEW


TABLE 229
TECSYS INC.: PRODUCTS/SOLUTIONS/SERVICES OFFERED


TABLE 230
TECSYS INC.: PRODUCT LAUNCHES/ENHANCEMENTS


TABLE 231
TECSYS INC.: OTHER DEVELOPMENTS


TABLE 232
PTC: COMPANY OVERVIEW


TABLE 233
PTC: PRODUCTS/SOLUTIONS/SERVICES OFFERED


TABLE 234
REPLY: COMPANY OVERVIEW


TABLE 235
REPLY: PRODUCTS/SOLUTIONS/SERVICES OFFERED


TABLE 236
DEMATIC: COMPANY OVERVIEW


TABLE 237
DEMATIC: PRODUCTS/SOLUTIONS/SERVICES OFFERED


TABLE 238
SSI SCHAEFER: COMPANY OVERVIEW


TABLE 239
SSI SCHAEFER: PRODUCTS/SOLUTIONS/SERVICES OFFERED


TABLE 240
EPICOR SOFTWARE CORPORATION: COMPANY OVERVIEW


TABLE 241
EXTENSIV: COMPANY OVERVIEW


TABLE 242
DATAPEL SYSTEMS: COMPANY OVERVIEW


TABLE 243
GENERIX GROUP: COMPANY OVERVIEW


TABLE 244
ECOVIUM: COMPANY OVERVIEW


TABLE 245
MADE4NET: COMPANY OVERVIEW


TABLE 246
MICROLISTICS: COMPANY OVERVIEW


TABLE 247
MECALUX, S.A.: COMPANY OVERVIEW


TABLE 248
SOFTEON: COMPANY OVERVIEW


TABLE 249
SYNERGY LOGISTICS LTD: COMPANY OVERVIEW


TABLE 250
VINCULUM SOLUTIONS PVT. LTD.: COMPANY OVERVIEW


TABLE 251
TECHNOFORTE: COMPANY OVERVIEW


LIST OF FIGURES


FIGURE 1
WAREHOUSE MANAGEMENT SYSTEM MARKET SEGMENTATION AND REGIONAL SCOPE


FIGURE 2
WAREHOUSE MANAGEMENT SYSTEM MARKET: DURATION CONSIDERED


FIGURE 3
WAREHOUSE MANAGEMENT SYSTEM MARKET: RESEARCH DESIGN


FIGURE 4
WAREHOUSE MANAGEMENT SYSTEM MARKET: RESEARCH APPROACH


FIGURE 5
WAREHOUSE MANAGEMENT SYSTEM MARKET: DATA CAPTURED FROM SECONDARY SOURCES


FIGURE 6
WAREHOUSE MANAGEMENT SYSTEM MARKET: DATA CAPTURED FROM PRIMARY SOURCES


FIGURE 7
WAREHOUSE MANAGEMENT SYSTEM MARKET: CORE FINDINGS FROM INDUSTRY EXPERTS


FIGURE 8
WAREHOUSE MANAGEMENT SYSTEM MARKET: BREAKDOWN OF PRIMARY INTERVIEWS, BY COMPANY TYPE, DESIGNATION, AND REGION


FIGURE 9
WAREHOUSE MANAGEMENT SYSTEM MARKET: BOTTOM-UP APPROACH


FIGURE 10
WAREHOUSE MANAGEMENT SYSTEM MARKET: TOP-DOWN APPROACH


FIGURE 11
WAREHOUSE MANAGEMENT SYSTEM MARKET SIZE ESTIMATION


FIGURE 12
WAREHOUSE MANAGEMENT SYSTEM MARKET: DATA TRIANGULATION


FIGURE 13
WAREHOUSE MANAGEMENT SYSTEM MARKET SIZE, IN TERMS OF VALUE, 2021–2030


FIGURE 14
SOFTWARE SEGMENT TO HOLD LARGER MARKET SHARE IN 2025 AND 2030


FIGURE 15
CLOUD-BASED SEGMENT TO RECORD HIGHER CAGR DURING FORECAST PERIOD


FIGURE 16
3PL SEGMENT TO DOMINATE WAREHOUSE MANAGEMENT SYSTEM MARKET FROM 2025 TO 2030


FIGURE 17
SUPPLY CHAIN & LOGISTICS OPTIMIZATION SEGMENT TO DOMINATE MARKET FROM 2025 TO 2030


FIGURE 18
ASIA PACIFIC TO EXHIBIT HIGHEST CAGR BETWEEN 2025 AND 2030


FIGURE 19
GROWING EMPHASIS ON AUTOMATION AND EFFICIENT SUPPLY CHAIN TO DRIVE WAREHOUSE MANAGEMENT SYSTEM MARKET


FIGURE 20
SOFTWARE SEGMENT TO RECORD HIGHER CAGR FROM 2025 TO 2030


FIGURE 21
3PL SEGMENT TO DOMINATE WAREHOUSE MANAGEMENT SYSTEM MARKET BETWEEN 2025 AND 2030


FIGURE 22
3PL SEGMENT AND US ACCOUNTED FOR LARGEST SHARE OF NORTH AMERICAN WAREHOUSE MANAGEMENT SYSTEM MARKET IN 2024


FIGURE 23
INDIA TO REGISTER HIGHEST CAGR IN GLOBAL WAREHOUSE MANAGEMENT SYSTEM MARKET DURING FORECAST PERIOD


FIGURE 24
DRIVERS, RESTRAINTS, OPPORTUNITIES, AND CHALLENGES


FIGURE 25
IMPACT ANALYSIS: DRIVERS


FIGURE 26
IMPACT ANALYSIS: RESTRAINTS


FIGURE 27
TRADITIONAL VS. DIGITAL SUPPLY CHAIN


FIGURE 28
IMPACT ANALYSIS: OPPORTUNITIES


FIGURE 29
IMPACT ANALYSIS: CHALLENGES


FIGURE 30
TRENDS/DISRUPTIONS INFLUENCING CUSTOMER BUSINESS


FIGURE 31
AVERAGE SELLING PRICE TREND OF WAREHOUSE MANAGEMENT SYSTEMS IN DIFFERENT REGIONS, 2021−2024


FIGURE 32
VALUE CHAIN ANALYSIS


FIGURE 33
WAREHOUSE MANAGEMENT SYSTEM ECOSYSTEM


FIGURE 34
INVESTMENT AND FUNDING SCENARIO, 2021–2024


FIGURE 35
PATENTS APPLIED AND GRANTED, 2015–2024


FIGURE 36
IMPORT DATA FOR HS CODE 847950-COMPLIANT PRODUCTS FOR TOP FIVE COUNTRIES, 2020–2024


FIGURE 37
EXPORT DATA FOR HS CODE 847950-COMPLIANT PRODUCTS FOR TOP FIVE COUNTRIES, 2020–2024


FIGURE 38
PORTER'S FIVE FORCES ANALYSIS


FIGURE 39
INFLUENCE OF STAKEHOLDERS ON BUYING PROCESS FOR TOP THREE END USES


FIGURE 40
KEY BUYING CRITERIA FOR TOP THREE END USES


FIGURE 41
AI USE CASES IN WAREHOUSE MANAGEMENT SYSTEM MARKET


FIGURE 42
WAREHOUSE MANAGEMENT SYSTEM MARKET, BY OFFERING


FIGURE 43
SOFTWARE SEGMENT TO HOLD LARGER MARKET SHARE IN 2030


FIGURE 44
WAREHOUSE MANAGEMENT SYSTEM MARKET, BY DEPLOYMENT MODE


FIGURE 45
CLOUD-BASED SEGMENT TO REGISTER HIGHER CAGR DURING FORECAST PERIOD


FIGURE 46
WAREHOUSE MANAGEMENT SYSTEM MARKET, BY TIER


FIGURE 47
ADVANCED (TIER 1) SEGMENT TO DOMINATE WAREHOUSE MANAGEMENT SYSTEM MARKET FROM 2025 TO 2030


FIGURE 48
WAREHOUSE MANAGEMENT SYSTEM MARKET, BY APPLICATION


FIGURE 49
ORDER FULFILLMENT & DISTRIBUTION SEGMENT TO EXHIBIT HIGHEST CAGR DURING FORECAST PERIOD


FIGURE 50
WAREHOUSE MANAGEMENT SYSTEM MARKET, BY END USE


FIGURE 51
3PL SEGMENT TO CAPTURE LARGEST SHARE OF WAREHOUSE MANAGEMENT SYSTEM MARKET IN 2030


FIGURE 52
WAREHOUSE MANAGEMENT SYSTEM MARKET, BY REGION


FIGURE 53
INDIA TO EXHIBIT HIGHEST CAGR IN GLOBAL WAREHOUSE MANAGEMENT SYSTEM MARKET FROM 2025 TO 2030


FIGURE 54
NORTH AMERICA: WAREHOUSE MANAGEMENT SYSTEM MARKET SNAPSHOT


FIGURE 55
US TO CAPTURE LARGEST SHARE OF NORTH AMERICAN WAREHOUSE MANAGEMENT SYSTEM MARKET IN 2030


FIGURE 56
EUROPE: WAREHOUSE MANAGEMENT SYSTEM MARKET SNAPSHOT


FIGURE 57
GERMANY TO ACCOUNT FOR LARGEST SHARE OF EUROPEAN WAREHOUSE MANAGEMENT SYSTEM MARKET IN 2025


FIGURE 58
ASIA PACIFIC: WAREHOUSE MANAGEMENT SYSTEM MARKET SNAPSHOT


FIGURE 59
INDIA TO RECORD HIGHEST CAGR IN ASIA PACIFIC MARKET DURING FORECAST PERIOD


FIGURE 60
ROW: WAREHOUSE MANAGEMENT SYSTEM MARKET SNAPSHOT


FIGURE 61
SOUTH AMERICA TO ACCOUNT FOR LARGEST SHARE OF WAREHOUSE MANAGEMENT SYSTEM MARKET IN ROW IN 2030


FIGURE 62
WAREHOUSE MANAGEMENT SYSTEM MARKET: REVENUE ANALYSIS OF TOP THREE PLAYERS, 2020–2024


FIGURE 63
MARKET SHARE ANALYSIS OF COMPANIES OFFERING WAREHOUSE MANAGEMENT SYSTEMS, 2024


FIGURE 64
COMPANY VALUATION


FIGURE 65
FINANCIAL METRICS (EV/EBITDA)


FIGURE 66
PRODUCT COMPARISON


FIGURE 67
WAREHOUSE MANAGEMENT SYSTEM MARKET: COMPANY EVALUATION MATRIX (KEY PLAYERS), 2024


FIGURE 68
WAREHOUSE MANAGEMENT SYSTEM MARKET: COMPANY FOOTPRINT


FIGURE 69
WAREHOUSE MANAGEMENT SYSTEM MARKET: COMPANY EVALUATION MATRIX (STARTUPS/SMES), 2024


FIGURE 70
MANHATTAN ASSOCIATES: COMPANY SNAPSHOT


FIGURE 71
KÖRBER AG: COMPANY SNAPSHOT


FIGURE 72
ORACLE: COMPANY SNAPSHOT


FIGURE 73
SAP SE: COMPANY SNAPSHOT


FIGURE 74
MICROSOFT: COMPANY SNAPSHOT


FIGURE 75
TECSYS INC.: COMPANY SNAPSHOT


FIGURE 76
PTC: COMPANY SNAPSHOT


FIGURE 77
REPLY: COMPANY SNAPSHOT


FIGURE 78
INSIGHTS FROM INDUSTRY EXPERTS


Methodology

The study involved four major activities to estimate the current size of the Warehouse Management System market. Extensive secondary research was conducted to gather information on the WMS market, related industries, and the broader warehouse automation, supply chain, logistics, e-commerce, and digital warehouse ecosystem. Primary research was then conducted with stakeholders across the value chain, including WMS software providers, warehouse automation companies, system integrators, logistics service providers, retailers, e-commerce companies, manufacturers, warehouse operators, and other end users to validate market estimates and assumptions. Both top-down and bottom-up approaches were used to estimate the overall market size, followed by market breakdown and data triangulation to determine the size of individual segments and subsegments. Secondary and primary research were combined to provide a comprehensive analysis of the Warehouse Management System market.

Secondary Research

Various secondary sources were referred to during the secondary research process to identify and collect information relevant to the Warehouse Management System market. These sources included annual reports, press releases, investor presentations of key companies, product brochures, solution pages, technical documents, white papers, industry journals, certified publications, industry associations, company websites, trade directories, government databases, and warehouse automation, supply chain, logistics, and e-commerce industry sources. Secondary research was conducted to obtain key insights into the market’s supply chain, value chain, competitive landscape, and segmentation across integration of robotics & automation, offering, deployment, tier, application/function, and region. It also helped analyze industry trends and the adoption of WMS software and services, cloud-based solutions, warehouse robotics, AS/RS, conveyors & sortation, cranes, and AGVs across retail & e-commerce, manufacturing, logistics & transportation, food & beverage, pharmaceuticals, and other applications.

The collected data was further analyzed to estimate the overall market size and validate findings, which were subsequently refined through primary research with industry experts and key stakeholders.

Primary Research

Extensive primary research was conducted after gaining knowledge about the current scenario of the Warehouse Management System market through secondary research. Several primary interviews were conducted with experts from the demand and supply sides across four major regions: North America, Europe, Asia Pacific, and RoW. This primary data was collected through questionnaires, emails, and telephonic interviews.

BREAKDOWN OF PRIMARY INTERVIEW PARTICIPANTS
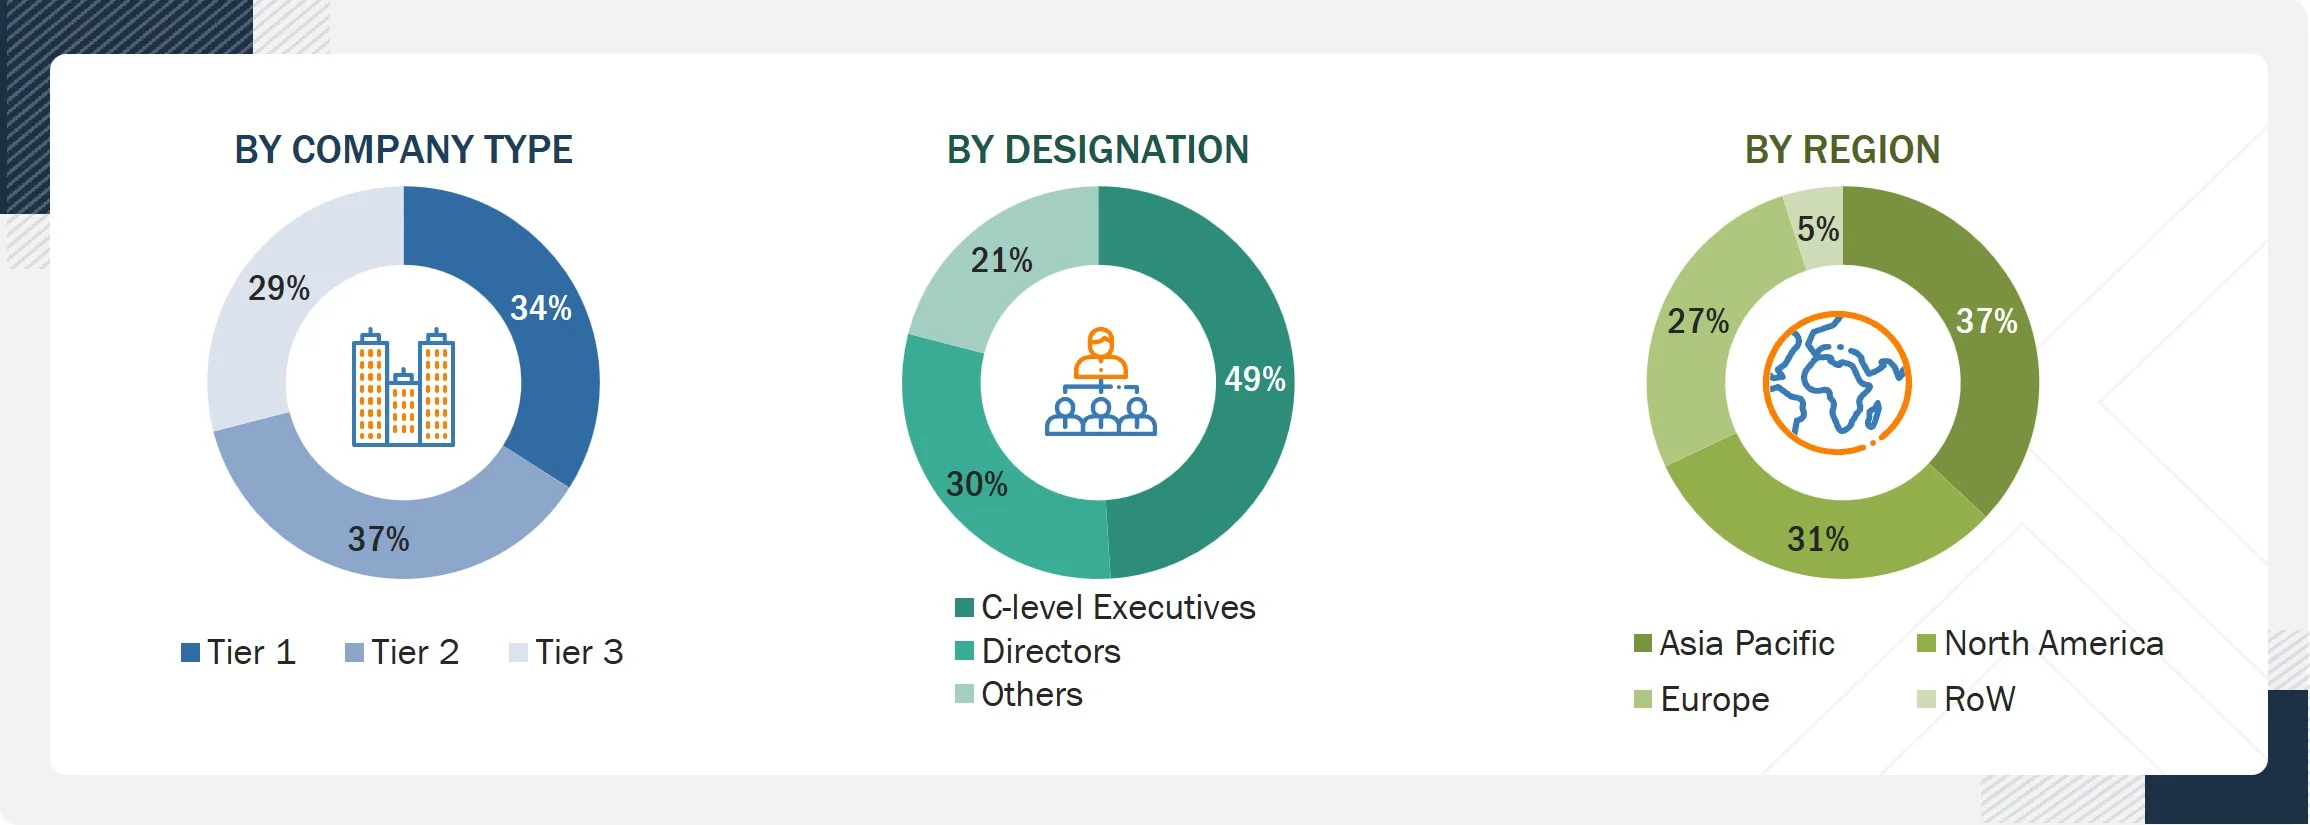
Warehouse Management System (WMS) Market  Size, and Share

Note: The three tiers of companies are defined based on their total revenue in 2025: Tier 1 - revenue greater than or equal to USD 1 billion; Tier 2 - revenue between USD 100 million and USD 1 billion; and Tier 3 - revenue less than or equal to USD 100 million. Other designations include sales managers, marketing managers, and product managers.

To know about the assumptions considered for the study, download the pdf brochure

Market Size Estimation

Both top-down and bottom-up approaches were used to estimate and validate the total size of the Warehouse Management System market. These approaches were also used extensively to estimate the size of various segments and subsegments in the market. The following research methodology was used to estimate the market size:

  • Major players in the Warehouse Management System industry and related warehouse automation and supply chain technology markets were identified through extensive secondary research.
  • The industry value chain and market size (in terms of value) were determined through primary and secondary research processes.
  • All percentage shares, splits, and segment-level breakdowns across integration of robotics & automation, offering, deployment, tier, application/function, and region were determined using secondary sources and validated through primary research.

Warehouse Management System (WMS) Market : Top-Down and Bottom-Up Approach

Warehouse Management System (WMS) Market  Top Down and Bottom Up Approach

Data Triangulation

After arriving at the overall size of the Warehouse Management System market through the market size estimation process described above, the total market was divided into relevant segments and subsegments. Data triangulation and market breakdown procedures were used, wherever applicable, to complete the overall market engineering process and derive statistics for all segments and subsegments. The data was triangulated by analyzing various factors and trends from both the demand and supply sides, including integration of robotics & automation, offering, deployment, tier, application/function, and regional developments. In addition, the market size was validated using both top-down and bottom-up approaches to ensure consistency across the overall market and individual segments.

Market Definition

A Warehouse Management System (WMS) is a software solution used to manage, control, and optimize warehouse operations, including inventory movement, storage, order processing, picking, packing, shipping, and workforce activities. WMS solutions provide real-time visibility into warehouse operations and help organizations improve inventory accuracy, order fulfillment, space utilization, labor productivity, and overall operational efficiency. WMS offerings include software and related services deployed through cloud-based or on-premises models.

WMS solutions are particularly important for operations that require accurate inventory tracking, efficient order fulfillment, real-time warehouse visibility, and integration with automation systems. They support supply chain and logistics optimization, asset and inventory tracking, order fulfillment and distribution, yard and dock management, and workforce/labor management. A typical WMS environment may integrate with warehouse automation technologies such as robots, automated storage and retrieval systems (AS/RS), conveyors and sortation systems, cranes, and automated guided vehicles (AGVs), as well as enterprise resource planning (ERP), transportation management, and other supply chain systems. The configuration and functionality of WMS solutions vary depending on warehouse size, operational complexity, deployment model, automation level, application requirements, and industry.

Key Stakeholders

  • Associations, forums, and alliances related to warehouse management systems.
  • End users from industries such as 3PL, e-commerce, automotive, chemicals, food & beverages, metals & machinery, and electricals & electronics.
  • Manufacturers of material handling systems, such as robots, AGVs, ASRS, cranes, and conveyors & sortation systems.
  • Research organizations and consulting companies.
  • System integrators.
  • Venture capitalists and private equity firms.
  • Warehouse management system software designers and developers.
  • Warehouse management system service providers.
  • Cloud service providers.
  • Market research and consulting firms.

Report Objectives

  • To define, describe, and forecast the Warehouse Management System market in terms of value based on integration of robotics & automation, offering, deployment, tier, application/function, and region.
  • To forecast the market size, in terms of value, across four major regions—North America, Europe, Asia Pacific, and Rest of the World.
  • To provide detailed information regarding the major factors influencing the growth of the Warehouse Management System market, including drivers, restraints, opportunities, and challenges.
  • To analyze the micromarkets¹ for individual growth trends, prospects, and contributions to the overall market.
  • To provide a detailed overview of the value chain of the Warehouse Management System market.
  • To analyze opportunities for various stakeholders by identifying high-growth segments of the market.
  • To profile key players and comprehensively analyze their market positions in terms of ranking and core competencies², along with detailing the competitive landscape of the market.
  • To analyze competitive developments, such as product launches and developments, partnerships, acquisitions, contracts, expansions, and research and development activities in the Warehouse Management System market.

Available customizations:

With the given market data, MarketsandMarkets offers customizations according to the company’s specific needs. The following customization options are available for the report:

Company Information

  • Detailed analysis and profiling of additional market players (up to 5)


Key Questions Addressed by the Report

What is the market size of the Warehouse Management System (WMS) market?

The global WMS market is valued at approximately USD 3.1 billion in 2024 and is projected to reach around USD 8.6 billion by 2030.

What is the expected CAGR of the WMS market?

The market is expected to grow at a CAGR of around 18.5% from 2024 to 2030.

What are the key growth drivers of the WMS market?

Key drivers include rapid e-commerce growth, rising demand for real-time inventory visibility, increasing warehouse automation, and adoption of cloud-based WMS solutions.

Which deployment type is dominating the market?

Cloud-based WMS solutions are leading due to lower cost, scalability, flexibility, and ease of integration compared to on-premises systems.

Which industries are major users of WMS?

Major industries include retail & e-commerce, manufacturing, logistics & 3PL, healthcare, automotive, and food & beverages.

Which region dominates the WMS market?

North America holds the largest share, while Asia Pacific is the fastest-growing region due to rapid industrialization and e-commerce expansion.

What are the key trends in the WMS market?

Key trends include AI-driven warehouse automation, IoT integration, robotics adoption, cloud migration, and real-time analytics for supply chain optimization.

Which companies are key players in the market?

Leading companies include SAP SE, Oracle Corporation, Blue Yonder, Manhattan Associates, and Infor.

What is driving cloud WMS adoption?

Cloud WMS is driven by lower upfront costs, reduced IT infrastructure needs, higher scalability, and improved accessibility from any location.

What is the future outlook of the WMS market?

The market is expected to grow strongly due to increasing warehouse automation, digital supply chain transformation, and rising global logistics complexity.

Personalize This Research

  • Triangulate with your Own Data
  • Get Data as per your Format and Definition
  • Gain a Deeper Dive on a Specific Application, Geography, Customer or Competitor
  • Any level of Personalization
Request A Free Customisation

Let Us Help You

  • What are the Known and Unknown Adjacencies Impacting the Warehouse Management System (WMS) Market

  • What will your New Revenue Sources be?
  • Who will be your Top Customer; what will make them switch?
  • Defend your Market Share or Win Competitors
  • Get a Scorecard for Target Partners
Customized Workshop Request

Custom Market Research Services

We Will Customise The Research For You, In Case The Report Listed Above Does Not Meet With Your Requirements

Get 10% Free Customisation

TESTIMONIALS

Growth opportunities and latent adjacency in Warehouse Management System (WMS) Market

avtar

Thomas

Sep, 2020

Nice brief, as already mentioned as question below: the potential of ECommerce growth is not even represented in your numbers, keeping in mind that only the biggest of companies can afford the mentioned solutions, no the average merchant that has 5-20 people inside his warehouse. Imagine what the real market size and potential is in fact.Best regards, Thomas Kircheis, PULPO WMS.

avtar

User

Sep, 2019

The e-commerce industry is expected to grow at a high rate owing to the increasing number of online shoppers. The e-commerce sales in APAC is predicted to be the twice the size of Western Europe and North America combined in 2020. Have you covered the impact of e-commerce industry on the WMS market in your study?.

avtar

User

Sep, 2019

Implementation cost of high-end on-premise WMS solutions is high, which is limiting its adoption in many small and midsized enterprises. Does your report covers the cost analysis and its impact on the growth of WMS market? .

avtar

User

Sep, 2019

Multinational companies with warehousing facilities across the world are constantly looking for advanced solutions to instantly track their inventory. The dynamic nature of the global supply chain networks has increased the need for adaptable warehousing solutions. Have you considered this factor while studying the global spread of the WMS market?.

avtar

User

Sep, 2019

Cloud computing is transforming operational activities of a warehouse and supply chain management. We would like to understand the impact of cloud computing on WMS market across the world..

avtar

User

May, 2019

Businesses today need to face challenges related to seasonal changes, price changes, fashion changes, and competitive product launches to remain competitive in the market. Thus, they need different types of forecasting models to fulfill customer orders on-time and provide them with a prediction of short- and long-term prices. Have you considered the forecasting models in this study?.

DMCA.com Protection Status
popup img