
Water Recycle and Reuse Market

Water Recycle and Reuse Market by Equipment (Primary Equipment, Secondary Equipment, Tertiary Equipment), Capacity (<25,000 Liters, 25,001 to 50,000 Liters, 50,001 to 100,000 Liters, Above 100,000 Liters), End Use (Residential, Commercial, Industrial), and Water Sources (Municipal Wastewater, Industrial Wastewater) - Global Forecast to 2030


OVERVIEW
Source: Secondary Research, Interviews with Experts, MarketsandMarkets Analysis
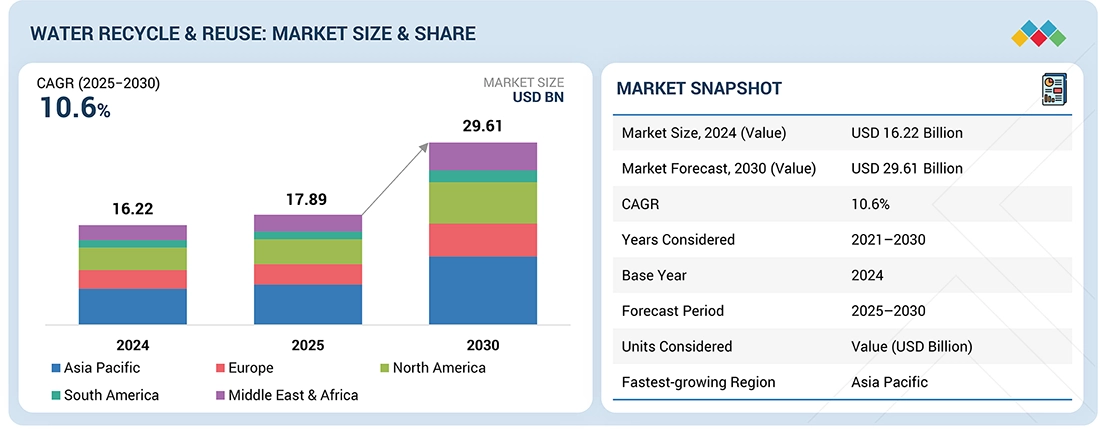
The water recycle & reuse market is projected to reach USD 29.61 billion by 2030 from USD 17.89 billion in 2025, growing at a CAGR of 10.6% during the forecast period. Water recycling and reuse involve the collection, treatment, and repurposing of wastewater from industrial, municipal, and agricultural sources, enabling the reduction of freshwater consumption and minimizing environmental pollution. Rising pressure on freshwater resources, coupled with growing water scarcity in both developed and emerging economies, is driving the adoption of recycled water solutions. Industries are increasingly implementing closed-loop water systems to reduce operational costs and enhance sustainability, further fueling market growth. In addition, stringent environmental regulations in major economies are mandating efficient wastewater management, creating strong incentives for investments in water recycling infrastructure.
KEY TAKEAWAYS
-
BY EQUIPMENTThe market is segmented into primary, secondary, and tertiary treatment equipment, with tertiary equipment accounting for the largest share. Advanced systems such as membrane filtration, reverse osmosis, and disinfection technologies dominate due to their ability to meet stringent water quality standards for potable and industrial reuse applications.
-
BY END USEWater recycling and reuse are adopted across residential, commercial, and industrial sectors, with the industrial segment holding the largest share. High water consumption in manufacturing, power generation, and processing industries, combined with strict discharge regulations, drives strong adoption of advanced reuse systems.
-
BY WATER SOURCEMunicipal wastewater represents the largest source due to rapid urbanization, rising domestic consumption, and consistent wastewater availability. Industrial wastewater, agricultural drainage, and stormwater runoff are also important sources, but their adoption is comparatively smaller due to variability in quality and collection challenges.
-
BY CAPACITYThe market includes analysis of <25,000 liters, 25,001–50,000 liters, 50,001–100,000 liters, and above 100,000-liter systems. Among these, above 100,000-liter capacity is estimated to dominates driven by municipal utilities and large industries requiring high-volume, centralized recycling solutions.
-
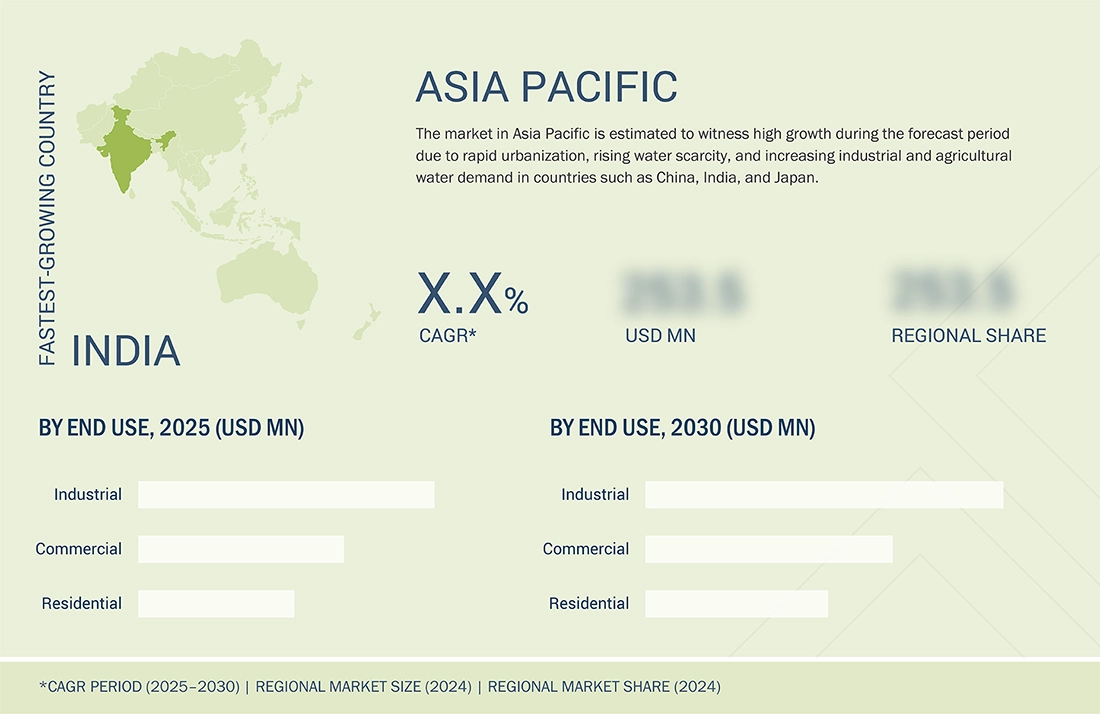
BY REGIONAsia Pacific is projected to be the fastest-growing region in the water recycle and reuse market, driven by rapid urbanization, industrial expansion, and growing water scarcity in countries such as China, India, and Japan. Strong government support, rising infrastructure investments, and stricter environmental regulations are accelerating the adoption of recycling solutions across both municipal and industrial sectors. North America and Europe account for significant shares due to advanced infrastructure, established regulations, and early adoption of reuse technologies, while the Middle East is increasingly investing in large-scale projects to address acute freshwater shortages.
-
COMPETITIVE LANDSCAPEMajor market players focus on expanding treatment technologies, forging partnerships, and investing in large-scale infrastructure to strengthen their presence in the water recycle & reuse market. Companies such as Veolia, Ecolab Inc., and Xylem are actively developing advanced reuse systems and collaborating with municipalities and industries to tackle global water scarcity challenges. A notable example is Ecolab’s extended collaboration with Microsoft, which centers on enhancing water data visibility to drive more effective treatment and reuse strategies. By integrating ECOLAB3D with Microsoft Cloud for Sustainability, the partnership allows organizations to centralize water consumption data, improve reporting accuracy, and implement outcome-based reuse solutions.
The water recycle & reuse market is projected to grow rapidly over the next decade, driven by a rise in water scarcity, stricter regulations, and advancements in treatment technologies. Industries, municipalities, and commercial facilities are increasingly adopting water reuse solutions to reduce freshwater dependency, lower costs, and meet sustainability goals. Recycled water is being used for applications such as potable reuse, non-potable reuse, and industrial processes, offering a reliable and efficient resource. Growing emphasis on circular water management and eco-friendly practices further strengthens the market’s role in addressing global water challenges, setting the foundation for broad adoption across residential, commercial, and industrial sectors.
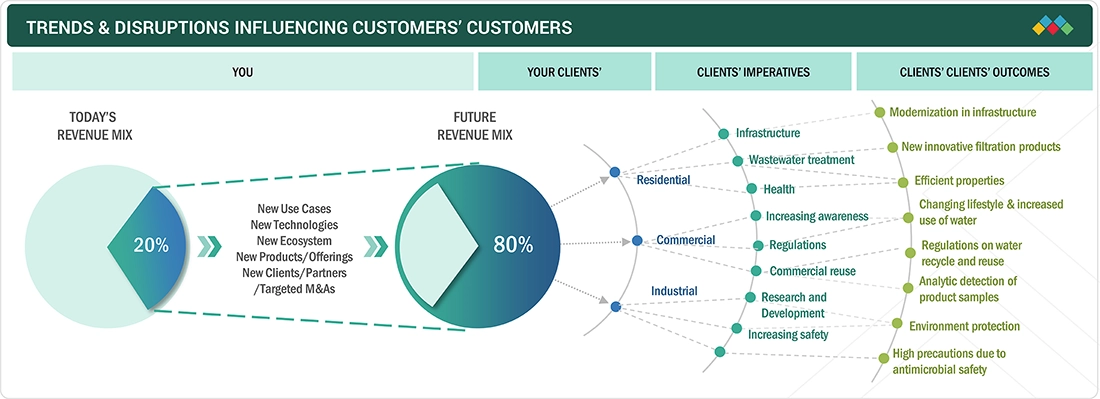
TRENDS & DISRUPTIONS IMPACTING CUSTOMERS' CUSTOMERS
Consumer businesses in the water recycle & reuse market are impacted by changing customer needs and regulatory or environmental disruptions. Municipalities, industries, and commercial facilities are the primary clients of water reuse solution providers. In contrast, specific applications such as potable reuse, non-potable reuse, and industrial processes represent the end-use targets. Shifts in water availability, stricter environmental regulations, and rising sustainability demands will directly impact the operational costs and resource security of end users. The revenue impact on these end users will influence investments in water reuse infrastructure, which will, in turn, affect the revenues of solution providers and technology developers in the market.
Source: Secondary Research, Interviews with Experts, MarketsandMarkets Analysis
MARKET DYNAMICS
Level
-
Rising pressure on freshwater resources and growing water scarcity boost demand for recycled water solutions

-
Industry adoption of closed-loop water systems for cost reduction and sustainability

Level
-
High cost of installation of water recycling equipment

Level
-
Expansion of potable reuse programs

-
Corporate water stewardship initiatives creating new growth opportunities for water reuse

Level
-
Maintaining the quality of recycled water

-
Health and safety concerns

Source: Secondary Research, Interviews with Experts, MarketsandMarkets Analysis
Driver: Rising pressure on freshwater resources and growing water scarcity boost demand for recycled water solutions
Growing pressure on freshwater resources and increasing water scarcity are significantly driving the water recycling & reuse market. Rapid population growth, urbanization, and industrial expansion have intensified demand for clean water, while climate change and irregular rainfall patterns are reducing the availability of natural freshwater sources. In response, governments, industries, and municipalities are turning to recycled water as a sustainable solution to meet water needs. Recycled water reduces dependence on freshwater supplies, lowers operational costs for industrial and municipal users, and supports environmental conservation by decreasing wastewater discharge into rivers and oceans. Industries such as manufacturing, power generation, and agriculture are increasingly adopting water reuse systems to ensure consistent water availability and comply with regulatory standards. Advanced treatment technologies, including membrane filtration, biological treatment, and disinfection, are enabling high-quality water recovery suitable for diverse applications. Additionally, rising awareness about water conservation and sustainability initiatives among governments and consumers is further encouraging the adoption of water reuse solutions, creating new opportunities for market growth. Overall, water scarcity and freshwater stress are key factors fueling demand for efficient recycling and reuse systems globally.
Restraint: High cost of installation of water recycling equipment
The high cost of installing water recycling and reuse equipment is a significant restraining factor for the market. Advanced treatment systems, including membrane filtration, biological treatment, and chemical disinfection units, require substantial capital investment, which can be a barrier, particularly for small- and medium-sized industries or municipalities with limited budgets. Beyond the initial investment, ongoing costs for operation, maintenance, energy consumption, and skilled labor further increase the financial burden. Many organizations are hesitant to adopt water recycling solutions due to these high upfront and recurring expenses, especially when freshwater sources are locally accessible and relatively inexpensive. Additionally, the complexity of integrating recycling systems into existing infrastructure can add to installation challenges and costs. In emerging markets, where financial resources and technical expertise are often limited, this factor becomes even more pronounced, slowing adoption rates. While long-term benefits such as reduced water bills and regulatory compliance exist, the immediate financial commitment can deter potential users, restraining the overall growth of the water recycle & reuse market despite rising water scarcity and sustainability awareness.
Opportunity: Expansion of potable reuse programs
The expansion of potable reuse programs presents a significant opportunity for the water recycle & reuse market. Potable reuse involves treating wastewater to a high standard, making it safe for human consumption, either directly or indirectly, which helps address growing water scarcity challenges. With increasing urbanization, population growth, and climate-induced water stress, traditional freshwater sources are becoming insufficient to meet demand. Governments and municipalities worldwide are investing in potable reuse programs to ensure a reliable, sustainable, and safe water supply for communities. This trend is driving demand for advanced treatment technologies, such as reverse osmosis, ultrafiltration, and advanced oxidation processes, which are critical for producing potable-quality recycled water. Additionally, the growing acceptance of potable reuse among the public and regulatory support through guidelines and funding initiatives encourage utilities and industries to adopt these solutions. By expanding potable reuse initiatives, regions can reduce dependence on freshwater sources, minimize wastewater discharge, and achieve long-term water security. Consequently, these programs create new market opportunities for technology providers, system integrators, and service providers in the water recycling and reuse sector.
Challenge: Maintaining the quality of recycled water
Maintaining the quality of recycled water presents a significant challenge for the water recycle & reuse market. Ensuring consistent water quality is critical, particularly for applications requiring high standards, such as industrial processes, agriculture, or potable reuse. Variations in the composition of wastewater, including the presence of chemical contaminants, heavy metals, pathogens, and organic matter, can make treatment complex and require advanced technologies such as membrane filtration, ultraviolet disinfection, and chemical treatment. Even minor lapses in treatment or monitoring can lead to health risks, regulatory non-compliance, and public concern, which may hinder market adoption. Additionally, monitoring and maintaining water quality involves ongoing operational costs, skilled personnel, and sophisticated instrumentation, increasing the overall expense of recycling systems. Public perception and trust are also critical, especially for potable reuse applications, where consumers demand high safety standards. The challenge of maintaining consistent and reliable water quality, combined with stringent regulatory requirements, can slow adoption rates, limit investment, and restrict the growth of the water recycle and reuse market despite the increasing need for sustainable water management solutions.
Water Recycle and Reuse Market: COMMERCIAL USE CASES ACROSS INDUSTRIES
| COMPANY | USE CASE DESCRIPTION | BENEFITS |
|---|---|---|
 |
Zero-water beverage plants with closed-loop process water recycling | Reduced freshwater withdrawal, sustainability leadership, improved community relations |
 |
Partnership with Ecolab to integrate smart water monitoring & reuse in campuses/data centers | Enhanced water visibility, data-driven efficiency, circular water use |
|
|
Wastewater recycling in dairy & food processing plants | Lower operational costs, water neutrality goals, regulatory compliance |
 |
Ultrapure water recycling in semiconductor fabs | Stable chip production, reduced discharge, sustainable manufacturing |
 |
Recycles greywater at corporate campuses and integrates circular water use across its supply chain | Lower freshwater dependency, improved supply chain sustainability, stronger ESG performance |
Logos and trademarks shown above are the property of their respective owners. Their use here is for informational and illustrative purposes only.
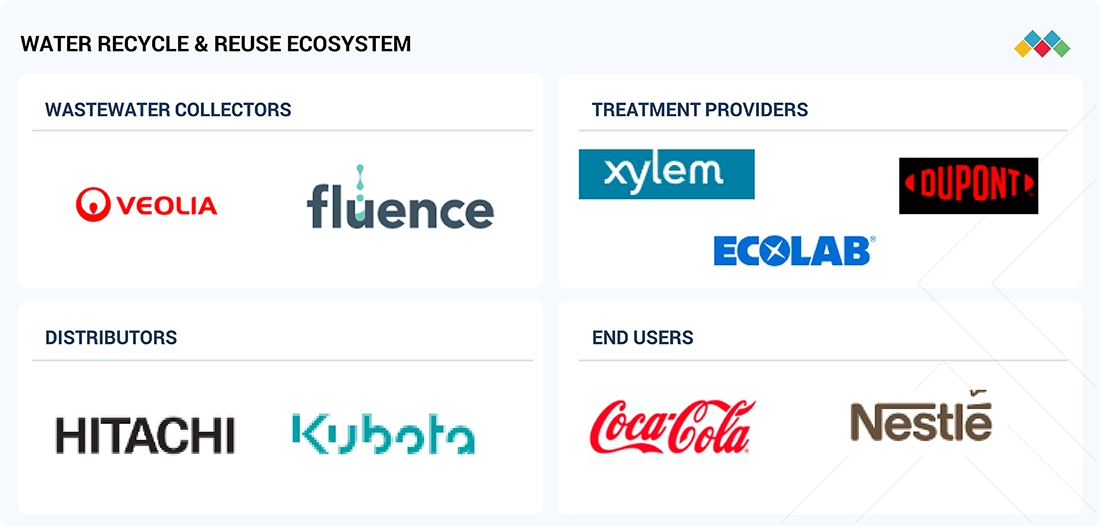
MARKET ECOSYSTEM
The water recycle and reuse ecosystem connects key stakeholders to maximize efficiency and sustainability. Wastewater collection agencies, such as Los Angeles County Sanitation Districts and Irvine Ranch Water District, gather wastewater from residential, commercial, and industrial sources for treatment. Solution providers like Veolia, Xylem, Suez, Evoqua, and Ecolab use advanced technologies—membrane filtration, biological treatment, chemical disinfection, and oxidation—to purify water to required standards. Distributors and service providers, including Alfa Laval, Kubota, Aries Chemical, and Nalco Water, ensure treated water reaches municipalities, industries, and agricultural users. Contractors and system integrators, such as Carollo Engineers and Brown and Caldwell, install and optimize infrastructure for operational efficiency. End users—ranging from PepsiCo and L’Oréal to agricultural irrigators—rely on recycled water to reduce freshwater dependence, meet regulatory standards, and advance sustainability. Together, this coordinated network enables effective wastewater recycling while delivering environmental and economic benefits.
Logos and trademarks shown above are the property of their respective owners. Their use here is for informational and illustrative purposes only.
MARKET SEGMENTS
Source: Secondary Research, Interviews with Experts, MarketsandMarkets Analysis
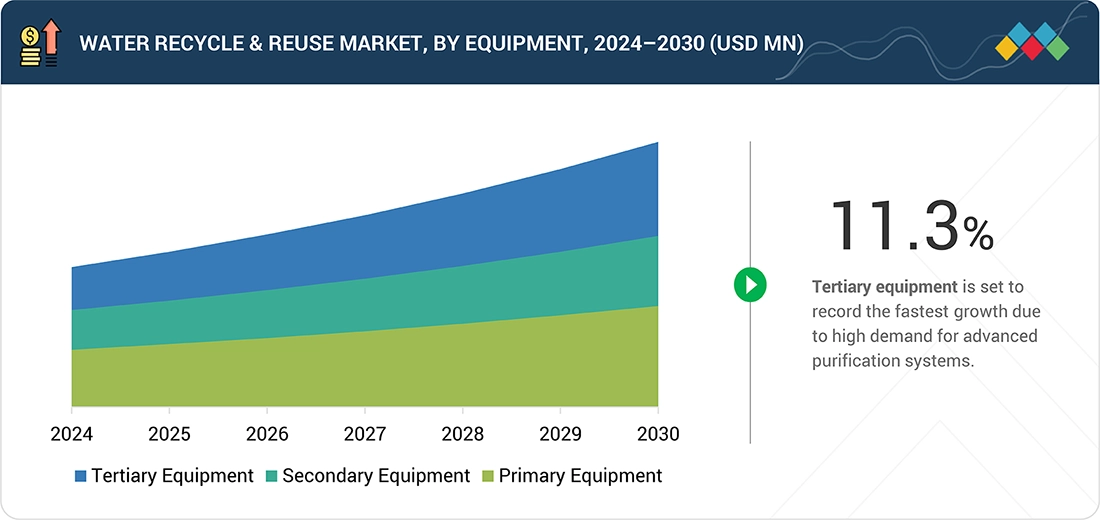
Water Recycle & Reuse Market, by Equipment
Tertiary equipment is set to account for the largest share in the water recycle & reuse market because it plays a critical role in producing high-quality treated water suitable for a wide range of applications. Unlike primary and secondary systems, which focus mainly on removing solids and organic matter, tertiary treatment ensures advanced purification by eliminating pathogens, dissolved salts, nutrients, and other contaminants to meet stringent regulatory and safety standards. This level of treatment is particularly vital for industries, agriculture, and municipalities aiming to reuse water for high-end applications such as potable reuse, industrial processes, and irrigation of sensitive crops. The rising adoption of advanced technologies such as membrane filtration, reverse osmosis, ultraviolet disinfection, and activated carbon filters has further strengthened the dominance of tertiary equipment. Additionally, growing regulatory emphasis on water quality, coupled with the increasing demand for sustainable and safe water reuse solutions, makes tertiary systems indispensable, thereby driving their leading market share.
Water Recycle & Reuse Market, by Capacity
Systems with capacities above 100,000 liters are estimated to account for the largest share in the water recycle & reuse market because large-scale systems are essential to meet the water demands of municipalities, heavy industries, and large commercial facilities. These applications generate and consume massive volumes of water daily, making high-capacity recycling systems more efficient and cost-effective. Large-scale installations are often integrated into centralized treatment plants, industrial complexes, and urban infrastructure projects where economies of scale reduce per-unit costs of water treatment. Moreover, government initiatives and regulations promoting sustainable water management and wastewater reuse encourage large projects, particularly in urban areas facing acute water scarcity. Industries such as power generation, oil and gas, and manufacturing also rely on these high-capacity systems to ensure uninterrupted operations and compliance with environmental standards. The scalability, efficiency, and ability to address large populations make the above 100,000 liters segment dominant in overall market share.
Water Recycle & Reuse Market, by Water Source
Municipal wastewater comprised the largest segment in the water recycle & reuse market because cities and towns generate the highest volumes of wastewater from households, commercial buildings, and public facilities. With rapid urbanization and population growth, municipal wastewater streams are both abundant and consistent, making them the most reliable source for large-scale recycling projects. Municipal wastewater treatment plants are often supported by government initiatives and funding, as recycling at the municipal level helps address water scarcity, reduce environmental pollution, and ensure sustainable urban water management. Treated municipal wastewater can be reused for multiple applications such as irrigation, landscaping, industrial processes, and even potable reuse in some regions, which further expands its importance. The strong regulatory emphasis on managing municipal wastewater responsibly and the scalability of such projects ensure that this segment continues to dominate the market, holding the largest share among all water sources.
Water Recycle & Reuse Market, by End Use
Industrial end use of water recycling and reuse dominates the market as industries are among the largest consumers and generators of water worldwide. Sectors such as power generation, chemicals, textiles, food & beverages, oil & gas, and electronics require massive volumes of water for cooling, processing, and cleaning, leading to significant wastewater output. Recycling and reusing this wastewater are not only cost-effective but also essential for maintaining operational continuity, especially in regions facing water scarcity. Strict environmental regulations further push industries to adopt advanced recycling systems to reduce freshwater withdrawal and minimize discharge. Moreover, the rising cost of freshwater and the need for sustainable operations are driving industries to integrate high-capacity and advanced water treatment technologies into their processes. The combination of regulatory pressure, economic benefits, and sustainability goals ensures that the industrial segment remains the largest contributor to the water recycle & reuse market.
REGION
Asia Pacific to be fastest-growing region in global water recycle and reuse market during forecast period
Asia Pacific is projected to be the fastest-growing region in the water recycle & reuse market due to its rapidly growing population, industrialization, and urbanization, which are placing immense pressure on limited freshwater resources. Countries such as China, India, Japan, and South Korea are witnessing rising water demand from industries including power generation, textiles, electronics, and chemicals, alongside increasing municipal requirements in densely populated cities. Water scarcity is intensifying in many parts of the region due to over-extraction of groundwater, climate change, and irregular rainfall patterns, making recycling and reuse an urgent necessity. Governments across Asia Pacific are actively promoting wastewater recycling through stricter environmental regulations, financial incentives, and infrastructure development programs to reduce pollution and ensure sustainable water management. Additionally, investments in advanced treatment technologies such as membrane filtration, reverse osmosis, and disinfection systems are gaining momentum to meet both industrial and municipal needs. Growing awareness of environmental conservation, coupled with corporate sustainability initiatives, is further encouraging the adoption of water reuse practices. The combination of strong policy support, rising urban water stress, and large-scale industrial activities positions Asia Pacific as the fastest-growing market, with significant opportunities for technology providers, service companies, and infrastructure developers.
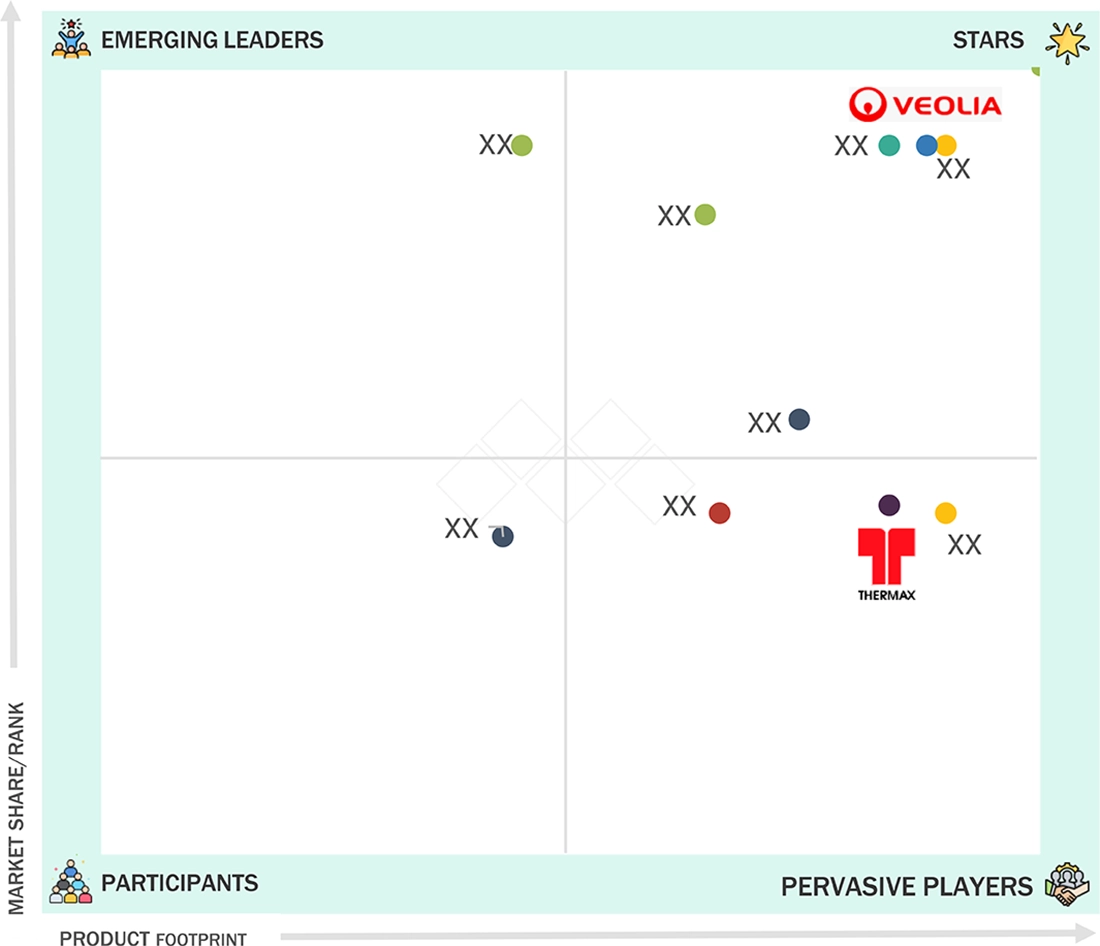
Water Recycle and Reuse Market: COMPANY EVALUATION MATRIX
The water recycle & reuse market is characterized by a mix of emerging leaders, participants, pervasive players, and stars. The chart highlights Veolia (Star) as a strong market leader in terms of both market share and product footprint. Thermax Limited (Pervasive Players) exhibits a broad product presence but a relatively moderate market share. Several smaller players cluster in the "Participants" and "Emerging Leaders" zones, reflecting niche positioning or early-stage growth potential. Overall, market dynamics suggest strong competition, with global giants driving innovation while smaller companies strive for differentiation and market penetration.
Source: Secondary Research, Interviews with Experts, MarketsandMarkets Analysis
KEY MARKET PLAYERS
- Veolia (France)
- Xylem (US)
- Ecolab Inc. (US)
- DuPont (US)
- Hitachi, Ltd. (Japan)
- KUBOTA Corporation (Japan)
- ALFA LAVAL (Sweden)
- Thermax Limited (India)
- Pentair (US)
- Aquatech (US)
- Ion Exchange (India)
- Praj Industries (India)
- Fluence Corporation Limited (US)
- DeLoach Industries, Inc. (US)
- Kovalus Separation Solutions (US)
MARKET SCOPE
| REPORT METRIC | DETAILS |
|---|---|
| Market Size, 2024 (Value) | USD 16.2 Billion |
| Market Forecast, 2030 (Value) | USD 29.6 Billion |
| Growth Rate | 10.6% from 2025 to 2030 |
| Years Considered | 2021–2030 |
| Base Year | 2024 |
| Forecast Period | 2025–2030 |
| Units Considered | Value (USD Million/Billion) |
| Report Coverage | Revenue Forecast, Company Ranking, Competitive Landscape, Growth Factors, and Trends |
| Segments Covered |
|
| Regions Covered | North America, Europe, Asia Pacific, Middle East & Africa, and South America |
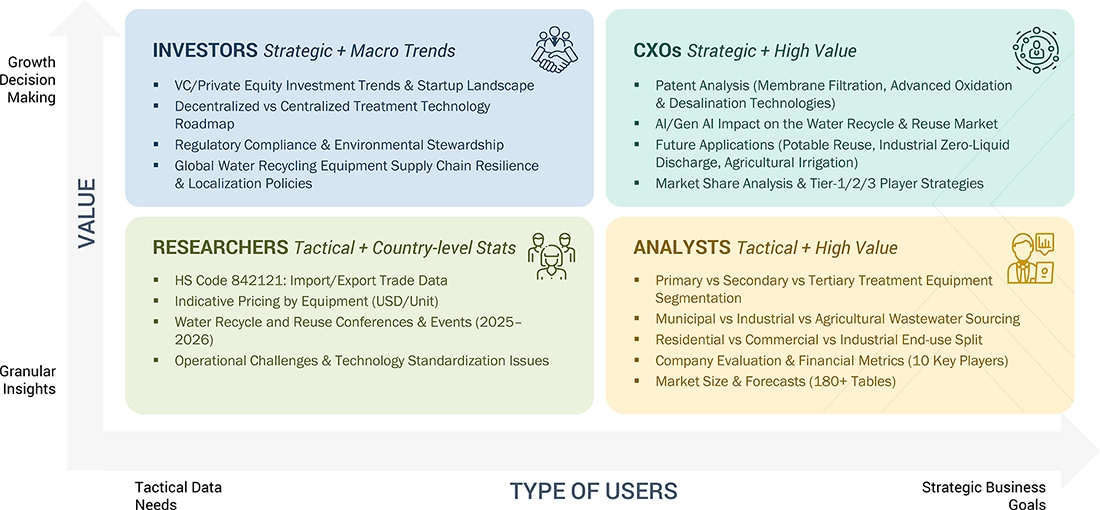
WHAT IS IN IT FOR YOU: Water Recycle and Reuse Market REPORT CONTENT GUIDE
DELIVERED CUSTOMIZATIONS
We have successfully delivered the following deep-dive customizations:
| CLIENT REQUEST | CUSTOMIZATION DELIVERED | VALUE ADDS |
|---|---|---|
| US-based Water Recycle and Reuse Equipment Manufacturer |
|
|
| Water Recycle and Reuse Equipment Supplier |
|
|
RECENT DEVELOPMENTS
- March 2025 : Veolia and SIAAP inaugurated a new primary settling unit at the Seine Aval wastewater treatment site in France. The unit would enhance industrial performance while prioritizing environmental preservation, improving the plant’s efficiency in handling large wastewater volumes, and supporting sustainable water management through more effective solid removal and treatment.
- July 2024 : Veolia Water Technologies Qatar, a subsidiary of Veolia, expanded its footprint in the water reuse sector by inaugurating a wastewater recycling facility in partnership with the Katara Project. This advanced plant, located at Katara Cultural Village, was designed to treat and reuse between 5,000 and 15,000 cubic meters of wastewater per day, significantly reducing the demand for freshwater. The initiative supported Qatar’s sustainable development goals by enhancing water conservation and optimizing resource efficiency in urban infrastructure.
- July 2023 : Ecolab and Cargill collaborated to advance water sustainability by implementing innovative wastewater treatment and recycling solutions across Cargill’s operations. The partnership enabled Cargill to recycle 93% of its wastewater discharge, resulting in a 53% reduction in freshwater consumption.
- March 2023 : Xylem acquired Evoqua Water Technologies Corp. in an all-stock transaction valued at approximately USD 7.5 billion. Evoqua was recognized for its mission-critical water treatment solutions and services, particularly in industrial and municipal sectors. This strategic acquisition combined Xylem’s advanced infrastructure and digital technologies with Evoqua’s specialized treatment expertise, forming one of the most comprehensive water solutions platforms in the world.
Table of Contents
 Exclusive indicates content/data unique to MarketsandMarkets and not available with any competitors.
Methodology
The study involved four major activities in estimating the size of the water recycle and reuse market. Exhaustive secondary research was done to collect information on the market, the peer market, and the parent market. The next step was to validate these findings, assumptions, and sizing with industry experts across the value chain through primary research. Both top-down and bottom-up approaches were employed to estimate the complete market size. Thereafter, the market breakdown and data triangulation procedures were used to estimate the market size of the segments and subsegments.
Secondary Research
In the secondary research process, various secondary sources have been referred to for identifying and collecting information for this study. These secondary sources include annual reports, press releases, investor presentations of companies, white papers, certified publications, trade directories, certified publications, articles from recognized authors, gold standard and silver standard websites, and databases.
Secondary research has been used to obtain key information about the value chain of the industry, monetary chain of the market, the total pool of key water recycle and reuse, market classification and segmentation according to industry trends to the bottom-most level, and regional markets. It was also used to obtain information about the key developments from a market-oriented perspective.
Primary Research
The water recycle and reuse market comprises several stakeholders in the value chain, which include raw material suppliers, equipment manufacturers, recyclers, and end users. Various primary sources from the supply and demand sides of the water recycle and reuse market have been interviewed to obtain qualitative and quantitative information. The primary interviewees from the demand side include key opinion leaders in end-use sectors. The primary sources from the supply side include manufacturers, associations, and institutions involved in the water recycle and reuse industry.
Primary interviews were conducted to gather insights such as market statistics, data of revenue collected from the products and services, market breakdowns, market size estimations, market forecasting, and data triangulation. Primary research also helped in understanding the various trends related to equipment, capacity, end-use, water sources, and region. Stakeholders from the demand side, such as CIOs, CTOs, and CSOs, were interviewed to understand the buyer’s perspective on the suppliers, products, component providers, and their current usage of water recycling and reuse, and future outlook of their business, which will affect the overall market.
The breakdown of profiles of the primary interviewees is illustrated in the figure below:

Note: Tier 1, Tier 2, and Tier 3 companies are classified based on their market revenue in 2024 available in the public domain, product portfolios, and geographical presence.
Other designations include sales representatives, production heads, and technicians.
To know about the assumptions considered for the study, download the pdf brochure
Market Size Estimation
The top-down approach was used to estimate and validate the size of various submarkets for water recycle and reuse for each region. The research methodology used to estimate the market size included the following steps:
- The key players in the industry have been identified through extensive secondary research.
- The supply chain of the industry has been determined through primary and secondary research.
- The global market was then segmented into five major regions and validated by industry experts.
- All percentage shares, splits, and breakdowns based on equipment, capacity, end-use, water sources, and regions were determined using secondary sources and verified through primary sources.
- All possible parameters that affect the markets covered in this research study were accounted for, viewed in extensive detail, verified through primary research, and analyzed to get the final quantitative and qualitative data. This data was consolidated and added with detailed inputs and analysis, and presented in this report.

Data Triangulation
After arriving at the total market size from the estimation process above, the overall market has been split into several segments and subsegments. To complete the overall market engineering process and arrive at the exact statistics for all the segments and subsegments, the data triangulation and market breakdown procedures have been employed, wherever applicable. The data has been triangulated by studying various factors and trends from both the demand and supply sides. Along with this, the market size has been validated by using both the top-down and bottom-up approaches and primary interviews. Hence, for every data segment, there have been three sources—top-down approach, bottom-up approach, and expert interviews. The data was assumed correct when the values arrived from the three sources matched.
Market Definition
The water reuse and recycle involves systems, technologies, and infrastructure that cover the treatment of wastewater that is reused across municipal, industrial, agricultural, and commercial sectors. A large component of this market includes all the different treatment equipment that treats and reuses wastewater. This includes treating equipment categories such as primary treatment, including screens, grit chambers, and clarifiers; secondary treatment, such as aeration tanks, bioreactors, and diffusers; and tertiary treatment/technologies, like membrane filtration systems, disinfection, activated carbon, and ion exchange units. Treatment equipment is designed to provide different levels of water treatment, ranging from basic solid removal to advanced treatment processes that eliminate contaminants, making the water safe for reuse. Increasing water shortages, stricter environmental regulations, and the push for sustainable infrastructure have driven the growth of this market. Additionally, there is a rising need for public and private partnerships to develop modular and decentralized treatment solutions that enhance treatment efficiency.
Stakeholders
- Water Recycle and Reuse Equipment Manufacturers
- Water Recycle and Reuse Equipment Traders, Distributors, and Suppliers
- Wastewater Recycling Companies
- Government and Private Research Organizations
- Associations and Industrial Bodies
- R&D Institutions
- Environmental Support Agencies
Report Objectives
- To define, describe, and forecast the size of the water recycle and reuse market, in terms of value
- To provide detailed information regarding the major factors (drivers, opportunities, restraints, and challenges) influencing the growth of the market
- To estimate and forecast the market size based on equipment, capacity, end use, water source, and region
- To forecast the size of the market with respect to major regions, namely, Europe, North America, Asia Pacific, Middle East & Africa, and South America, along with their key countries
- To strategically analyze micromarkets with respect to individual growth trends, prospects, and their contribution to the overall market
- To analyze opportunities in the market for stakeholders and provide a competitive landscape of market leaders
- To track and analyze recent developments such as product launches, partnerships, collaborations, acquisitions, and expansions in the market
- To strategically profile the key market players and comprehensively analyze their core competencies
Key Questions Addressed by the Report
Which factors influence the growth of the water recycle and reuse market?
The growth of the water recycle and reuse market is driven by increasing water scarcity, rising demand for sustainable water management, and stringent environmental regulations aimed at reducing freshwater withdrawal and wastewater discharge. Rapid urbanization, industrial expansion, and growing awareness of climate resilience are prompting municipalities and industries to invest in advanced treatment technologies for water reuse.
Which region is expected to have the largest market share in the water recycle and reuse market?
The Asia Pacific region is expected to account for the largest market share during the forecast period due to its rapid urbanization, industrial growth, and increasing water stress in countries like China, India, and Southeast Asian nations. Strong government initiatives, expanding infrastructure, and the adoption of advanced wastewater treatment technologies are fueling the demand for water recycling solutions across the region.
Who are the major manufacturers?
Major manufacturers include Veolia (France), Xylem (US), Ecolab Inc. (US), Fluence Corporation Limited (US), DuPont (US), Hitachi, Ltd. (Japan), KUBOTA Corporation (Japan), ALFA LAVAL (Sweden), Melbourne Water (Australia), and Siemens (Germany).
What are the opportunities in the water recycle and reuse market?
The water recycle and reuse market presents significant opportunities, which include the growing adoption of decentralized systems, rising investments in potable reuse, smart treatment technologies, and increasing regulatory support for sustainable water management solutions.
Which end-use has the largest share of the water recycle and reuse market?
Industrial end-use accounts for the largest market share.
Need a Tailored Report?
Customize this report to your needs
Get 10% FREE Customization
Customize This ReportPersonalize This Research
- Triangulate with your Own Data
- Get Data as per your Format and Definition
- Gain a Deeper Dive on a Specific Application, Geography, Customer or Competitor
- Any level of Personalization
Let Us Help You
- What are the Known and Unknown Adjacencies Impacting the Water Recycle and Reuse Market
- What will your New Revenue Sources be?
- Who will be your Top Customer; what will make them switch?
- Defend your Market Share or Win Competitors
- Get a Scorecard for Target Partners

Custom Market Research Services
We Will Customise The Research For You, In Case The Report Listed Above Does Not Meet With Your Requirements
Get 10% Free CustomisationTESTIMONIALS

We at Nissan Chemicals Corporation have been clients of MarketsandMarkets for more than a year now. We recently consulted MarketsandMarkets for a study, the team at MarketsandMarkets was extremely professional and organized. The business insights were very detailed and aligned well with our expectations that really helped us formulate the Business Plans and device new strategies for development themes. MarketsandMarkets offers a unique combination of expertise and dedicated engagement model. Their research findings have helped us in designing our Pricing Strategy which will make it easier for us to predict the future sales and profits for the next ten years. We look forward to working with MarketsandMarkets in the future.
VP of Strategy & New Business Development
Leading Specialty Chemical Company
The MarketsandMarkets Engagement Model, composed of both the Knowledge Store and advisory custom research, has greatly helped us in understanding our markets and making strategic decisions. The Knowledge Store is a fast way to allow everyone in our organization to understand more about most any market they are interested in. The ability to then get custom research done and get answers to specific strategic questions and market insight has been spectacular. The Markets and Markets team feel more like colleagues than vendors and their services have helped us change our culture where statements of things like growth opportunities and competitive position are always backed by industry research.

Rich Gibson,
Director, Corporate Strategy
Milliken & Company,
Leading Industrial Manufacturer of specialty chemical, floor covering, performance and protective textile materials, and healthcaremilliken.com
MarketsandMarkets is a trusted resource that helps us to better understand markets that are near-adjacencies-whether its technology, value chain or geography. Their Knowledge Store platform provides a dashboard of markets and their characteristics which is easy to use and saves us time.
Adam Shaw,
Market Development and Strategy Manager
AdvanSix Inc. USA,
An American Leader in Chemicalswww.advansix.com
The Knowledge Store from MarketsandMarkets is a valuable tool which has helped my team acquire greater insight in to the end markets that our business serves. This has enabled us to help our company build stronger strategies throughout our planning process.
TOSHIO KINOSHITA
Senior Chif Consultion Research & Consulting Division
Mitsubishi Chemical Research Corporation,
Leading Manufacturer of Chemical Productswww.mitsubishichem-res.co.jp/en/

We recently engaged with MarketsandMarkets for a study, the team not only clearly understood our business objectives but was also extremely professional in the way they handled the entire project. The study was efficiently conducted in a phase-wise manner, and the engagement model furnished us with high-quality business insights that far exceeded our expectations at each phase. We were especially happy that MarketsandMarkets could provide us with both, an English as well as a Japanese version of the study. A special thanks to the Analyst Team and Client Services Team, whose fluency in Japanese enhanced our comfort level, as we could converse with them in our preferred language.
Independent entrepreneurs
Arrow Precision
We approached MarketsandMarkets for study on Proppants Market, and their work exceeded our expectations. The study conducted was comprehensive and enabled us to view the market through the various dimensions. In addition, the team was extraordinarily responsive throughout the process and resolved our queries on time. I strongly recommend MarketsandMarkets and will certainly consider them for additional market assessments we will need in the future.
Global engineering company, Japan
Deputy Manager,
Strategic Planning OfficeThe high-quality insights shared by the MarketsandMarkets team helped us understand the pharmaceutical plant designers in a specific geography. It also captured the risks that we may likely face in communicating with our potential partners. The study would enable us identify partners, which would impact our future growth.


Growth opportunities and latent adjacency in Water Recycle and Reuse Market