
Commercial Security System Market Size, Share & Trends, 2025 To 2030

Commercial Security System Market by Fire Protection (Detection, Sprinkler), Video Surveillance (Camera, Storage), Access Control, Biometric (Fingerprint, Facial, Iris, Voice Recognition), RFID, VSaaS, ACaaS, Building Management - Global Forecast to 2030


COMMERCIAL SECURITY SYSTEM MARKET OVERVIEW
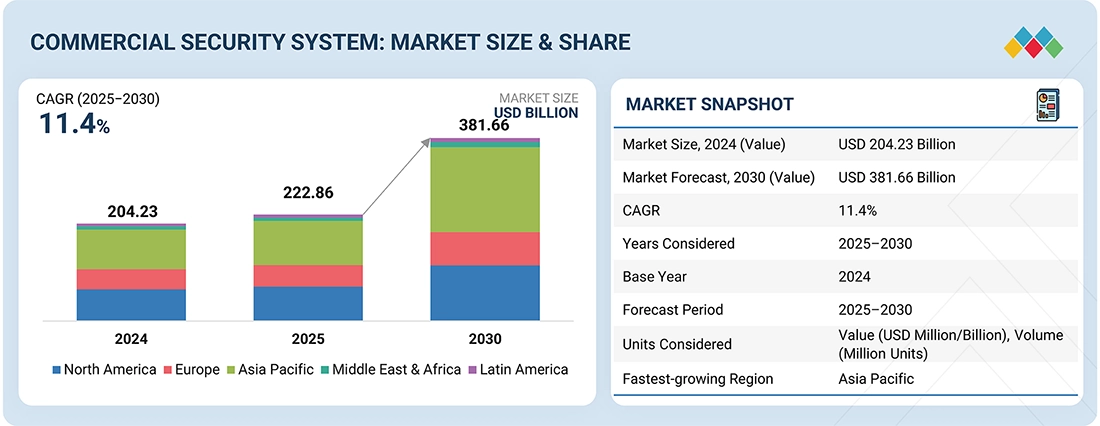
The Commercial Security System Market is projected to grow from USD 222.86 billion in 2025 to USD 381.66 billion by 2030, at a CAGR of 11.4%. The market is witnessing robust growth driven by increasing concerns over asset protection, rising crime rates, and growing adoption of smart surveillance technologies across commercial infrastructures. In the retail and banking sectors, the deployment of advanced video analytics, access control, and intrusion detection systems is enhancing real-time threat monitoring and response capabilities. The corporate and industrial sectors are increasingly integrating security systems with IoT and cloud-based platforms to enable centralized monitoring and predictive threat assessment. The emergence of AI-driven facial recognition and biometric access technologies is improving security accuracy and operational efficiency.
COMMERCIAL SECURITY SYSTEM MARKET SIZE & FORECAST
COMMERCIAL SECURITY SYSTEM MARKET KEY TAKEAWAYS
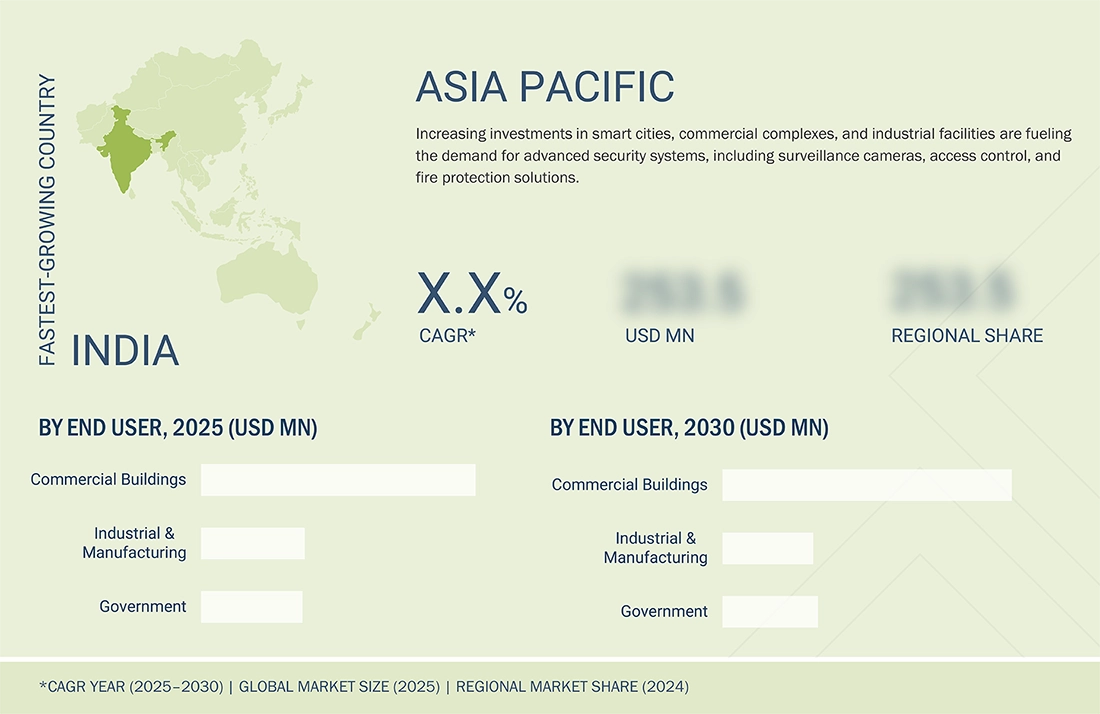
- Asia Pacific is estimated to dominate the commercial security market with a share of 40% in 2025.
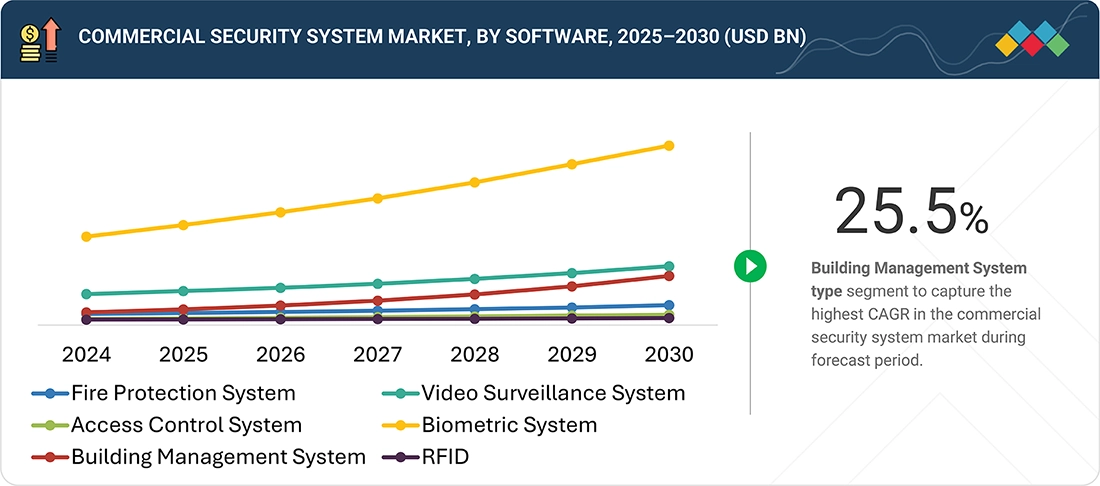
- By hardware, the building management system segment is projected to grow at a CAGR of 21.9% during the forecast period.
- By software, the biometric software segment is estimated to account for more than half the share of the commercial security market in 2025.
- By service, the building management services segment is projected to grow at a CAGR of 23.6% during the forecast period.
- By end user, the commercial buildings segment accounted for the largest share in terms of value in 2024.
- Honeywell International Inc., Robert Bosch GmbH, NEC Corporation, Johnson Controls, and Thales were identified as star players in the commercial security market, given their broad industry coverage and strong operational & financial strength.
- Motorola Solutions Inc., IDEMIA, and Anviz Global Inc., among others, have distinguished themselves among SMEs due to their well-developed marketing channels and extensive funding to build their product portfolios.
The commercial security system industry is projected to grow steadily over the next decade, driven by the increasing need for advanced surveillance, access control, and intrusion detection solutions across commercial infrastructures. Rising adoption in sectors such as retail, banking, corporate offices, and industrial facilities is fueling market expansion as organizations prioritize asset protection, employee safety, and regulatory compliance. Commercial security systems play a crucial role in safeguarding physical and digital assets by enabling real-time monitoring, threat detection, and automated incident response. The integration of artificial intelligence, cloud connectivity, and IoT-based analytics is further enhancing system intelligence and operational efficiency.
Source: Secondary Research, Interviews with Experts, MarketsandMarkets Analysis
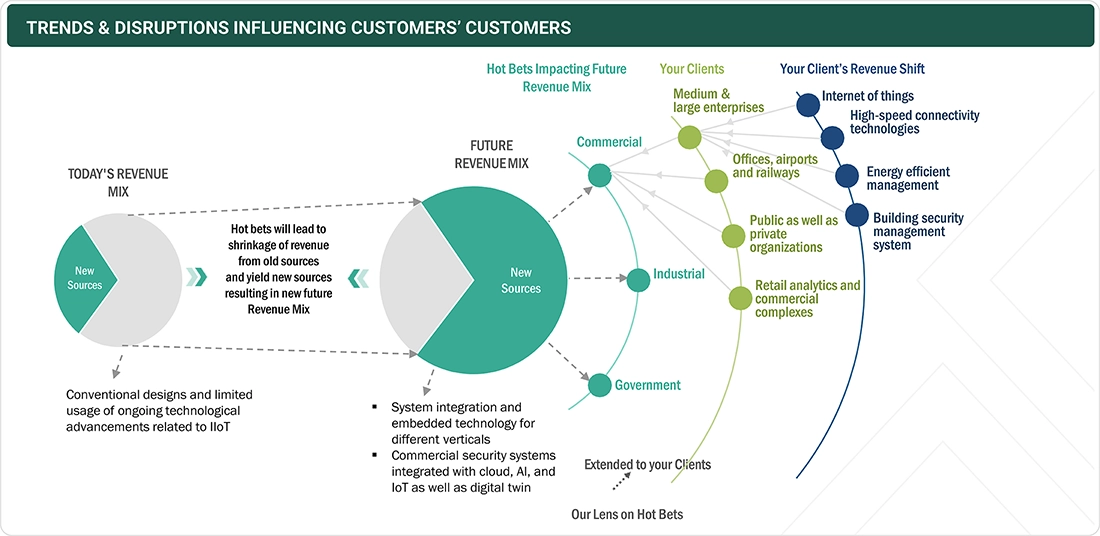
TRENDS & DISRUPTIONS IMPACTING CUSTOMERS' CUSTOMERS
The commercial security systems market is undergoing significant transformation driven by the integration of advanced technologies such as IoT, AI, cloud computing, and digital twin solutions. Conventional security designs are being replaced by intelligent systems that offer real-time monitoring, predictive analytics, and automation. High-speed connectivity technologies enable seamless data exchange, enhancing surveillance and threat detection capabilities. Additionally, energy-efficient security management solutions are gaining traction, driven by concerns regarding sustainability and need for cost optimization.
Source: Secondary Research, Interviews with Experts, MarketsandMarkets Analysis
COMMERCIAL SECURITY SYSTEM MARKET DYNAMICS
Level
-
Implementation of robust fire protection standards for effective fire security

-
Growing use of IoT-based security systems supported by cloud platforms

Level
-
High setup, maintenance, and ownership costs of commercial security systems

-
Privacy and security concerns due to potential data breaches and

Level
-
Need to upgrade fire protection-related regulatory compliances

-
Advancement and adoption of artificial intelligence (AI) and machine learning

Level
-
Complexity of integrating user interfaces with fire protection systems

-
Supply chain related risks of commercial security systems

Source: Secondary Research, Interviews with Experts, MarketsandMarkets Analysis
Driver: Implementation of robust fire protection standards for effective fire security
The growing enforcement of stringent fire safety regulations across commercial and industrial facilities is a major driver for market growth. Businesses are increasingly adopting advanced fire detection, alarm, and suppression systems integrated with centralized security networks to ensure compliance, protect assets, and minimize operational disruptions during fire-related incidents.
Restraint: High setup, maintenance, and ownership costs of commercial security systems
Despite technological advancements, the high initial installation costs, regular maintenance expenses, and long-term ownership challenges continue to restrain market adoption, particularly among small and medium enterprises. Complex infrastructure requirements, system upgrades, and the need for skilled operators further elevate overall operational costs, impacting large-scale deployment of commercial security solutions.
Opportunity: Need to upgrade fire protection-related regulatory compliances
Evolving global and regional fire safety regulations are creating strong opportunities for market expansion. Organizations are investing in next-generation fire protection systems with IoT connectivity, smart alarms, and cloud-based monitoring to comply with updated standards and enhance emergency response efficiency across commercial buildings, industrial plants, and public infrastructure projects.
Challenge: Complexity of integrating user interfaces with fire protection systems
Integrating diverse fire protection systems with existing building management platforms presents significant technical challenges. Variations in communication protocols, software compatibility issues, and the need for seamless user interfaces hinder efficient system integration, making it difficult for operators to manage centralized control and real-time emergency response effectively.
COMMERCIAL SECURITY SYSTEM MARKET SIZE, SHARE & GROWTH, 2030: COMMERCIAL USE CASES ACROSS INDUSTRIES
| COMPANY | USE CASE DESCRIPTION | BENEFITS |
|---|---|---|
 |
Integrated access control and video surveillance systems for commercial buildings and data centers | Centralized monitoring and threat mitigation | Scalable integration with existing infrastructure |
 |
Smart access control and intrusion detection systems for office buildings and retail spaces | Seamless user experience and high accessibility | Integrated with video surveillance |
 |
Biometric facial recognition systems for secure entry in government facilities and airports | Fast and accurate identity verification | Threat detection across demographics |
 |
Converged security platforms with intrusion detection for warehouses and corporate offices | Real-time situational awareness | Wireless scalability for large installations |
 |
Cybersecurity and access management solutions for financial institutions and critical infrastructure | Secure data encryption and trusted access | Protection against cyber threats |
Logos and trademarks shown above are the property of their respective owners. Their use here is for informational and illustrative purposes only.
COMMERCIAL SECURITY SYSTEM MARKET ECOSYSTEM
The commercial security system companies ecosystem comprises hardware manufacturers such as Hikvision, Bosch, and Honeywell, which offer advanced surveillance and access control solutions. Software developers, including Johnson Controls and Axis Communications, provide innovative platforms for integration. Service providers like ASSA ABLOY and Siemens ensure installation, maintenance, and support, driving market growth through 2030.
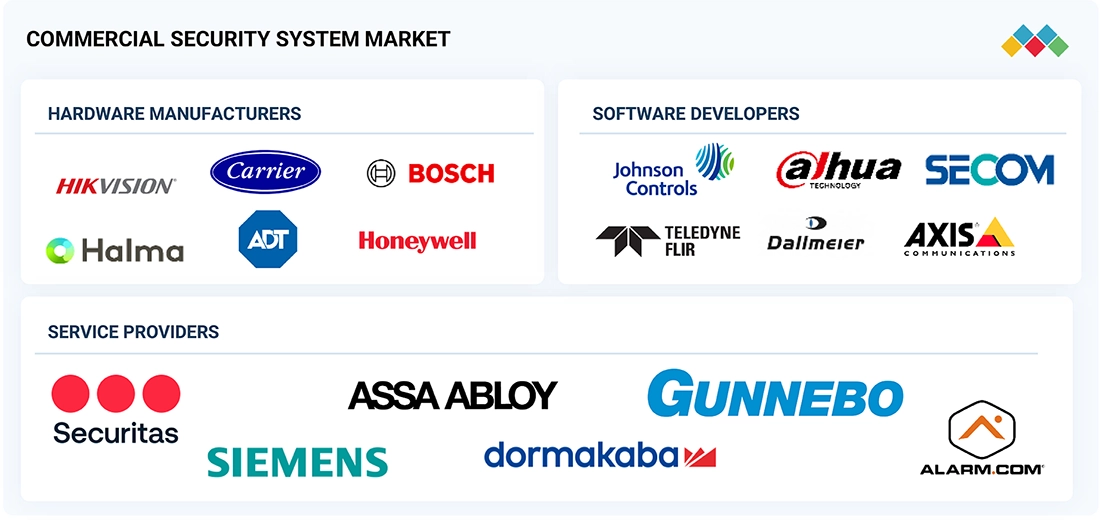
Logos and trademarks shown above are the property of their respective owners. Their use here is for informational and illustrative purposes only.
COMMERCIAL SECURITY SYSTEM MARKET SEGMENTS
Source: Secondary Research, Interviews with Experts, MarketsandMarkets Analysis
Commercial Security System Market, by Hardware
Fire protection systems are estimated to account for the largest share in the hardware segment of the commercial security system market, driven by stringent building safety regulations and the rising integration of automated fire detection and suppression technologies. Increasing investments in fire alarms, sprinklers, and smoke detection systems enhance the safety of commercial infrastructure globally.
Commercial Security System Market, by Software
The building management system software segment is anticipated to exhibit the highest CAGR, driven by the demand for integrated platforms that enable real-time monitoring and centralized control of security operations. Adoption of AI-driven analytics, IoT-enabled automation, and predictive maintenance enhances operational efficiency and building safety standards across commercial facilities.
Commercial Security System Market, by Service
Within the services category, building management system services are set to grow at the highest CAGR due to the increasing need for system integration, maintenance, and remote monitoring. Continuous upgrades, managed services, and cloud-based optimization solutions ensure enhanced security, energy efficiency, and compliance for commercial properties.
Commercial Security System Market, by End Use
The healthcare sector is projected to register the highest CAGR in the commercial security system market due to the growing need for patient safety, protection of medical assets, and compliance with regulatory standards. Increasing adoption of advanced surveillance, access control, and fire detection systems is driving robust market growth in hospitals and clinics.
COMMERCIAL SECURITY SYSTEM MARKET REGION
Asia Pacific to hold the largest market share in the global commercial security system market during the forecast period
The Asia Pacific commercial security system market is primarily driven by rapid urbanization and the expansion of smart infrastructure projects across major economies, including China, Japan, India, and South Korea. Increasing investments in smart cities, commercial complexes, and industrial facilities are fueling the demand for advanced security systems, including surveillance cameras, access control, and fire protection solutions. Governments are enforcing stricter safety regulations and promoting the integration of AI, IoT, and cloud technologies for real-time monitoring and risk mitigation. Additionally, rising security concerns, increasing incidents of theft and vandalism, and a growing emphasis on workplace safety are accelerating the adoption of intelligent and automated security systems.
COMMERCIAL SECURITY SYSTEM MARKET SIZE, SHARE & GROWTH, 2030: COMPANY EVALUATION MATRIX
In the commercial security system market matrix, Honeywell International Inc. (Star) leads with a strong market presence and an extensive product portfolio, enabling widespread adoption of commercial security system solutions across commercial buildings, industrial & manufacturing, and government end-users. Halma plc (Emerging Leader) is steadily gaining traction with innovative commercial security system solutions focused on hazard detection and life protection products. While Honeywell International Inc. dominates through scale and an established customer base, Halma demonstrates solid growth potential, advancing toward the leaders’ quadrant.
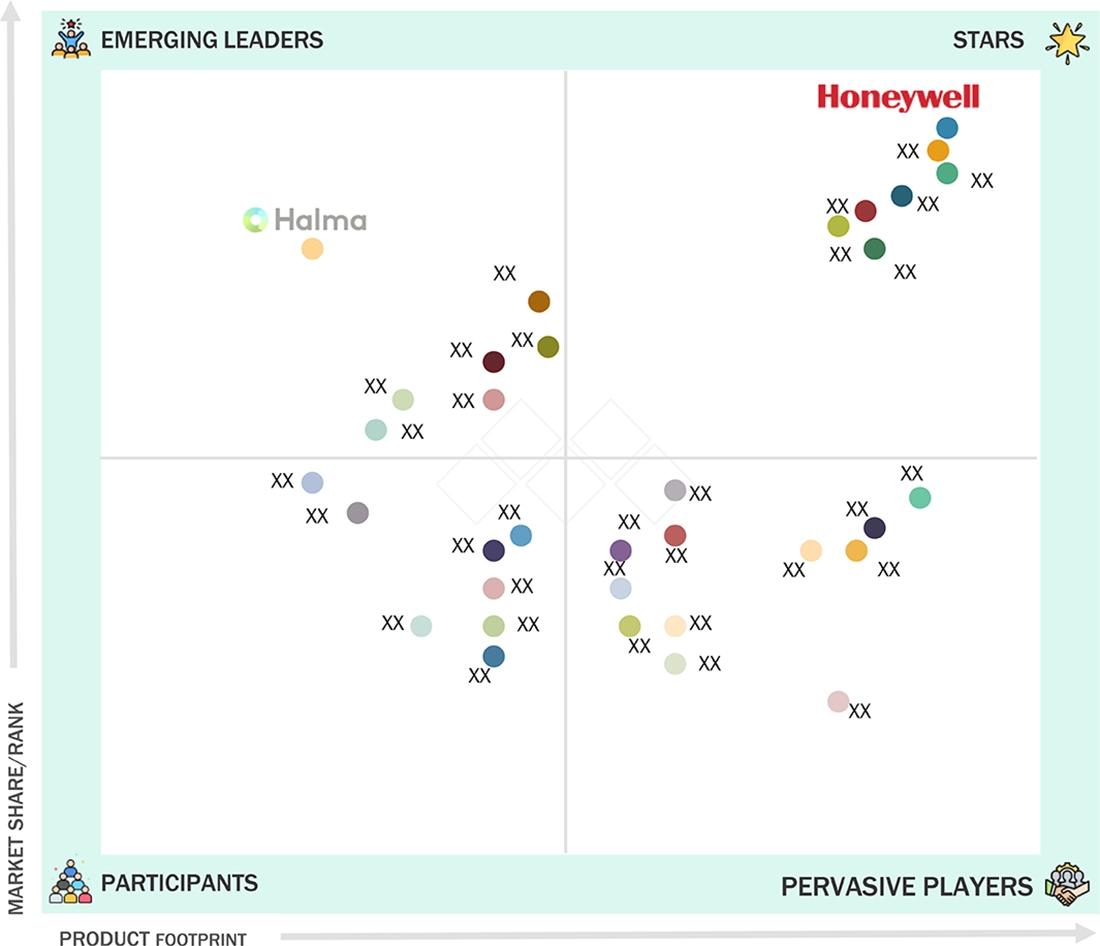
Source: Secondary Research, Interviews with Experts, MarketsandMarkets Analysis
COMMERCIAL SECURITY SYSTEM MARKET KEY PLAYERS
COMMERCIAL SECURITY SYSTEM MARKET SCOPE
| REPORT METRIC | DETAILS |
|---|---|
| Market Size, 2024 (Value) | USD 204.23 Billion |
| Market Forecast, 2030 (Value) | USD 381.66 Billion |
| Growth Rate | CAGR of 11.4% from 2025 to 2030 |
| Years Considered | 2021–2024 |
| Base Year | 2024 |
| Forecast Period | 2025–2030 |
| Units Considered | Value (Million Units) and Volume (USD Million) |
| Report Coverage | Revenue Forecast, Company Ranking, Competitive Landscape, Growth Factors, and Trends |
| Segments Covered |
|
| Regional Scope | North America, Europe, Asia Pacific, Rest of the World (RoW) |
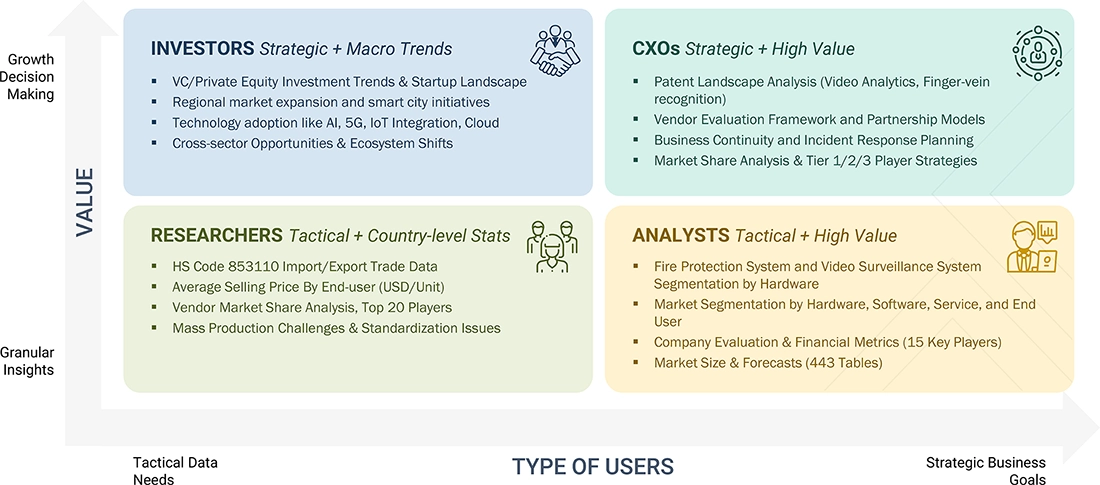
WHAT IS IN IT FOR YOU: COMMERCIAL SECURITY SYSTEM MARKET SIZE, SHARE & GROWTH, 2030 REPORT CONTENT GUIDE
DELIVERED CUSTOMIZATIONS
We have successfully delivered the following deep-dive customizations:
| CLIENT REQUEST | CUSTOMIZATION DELIVERED | VALUE ADDS |
|---|---|---|
| US-based Enterprise Retailer (Multi-Location) |
|
|
| European Healthcare Facility Network |
|
|
| Commercial Property REIT (Office Buildings) |
|
|
| Asia-Pacific Manufacturing Conglomerate |
|
|
| US-based Financial Services Firm |
|
|
RECENT DEVELOPMENTS
- June 2024 : The company announced the acquisition of Carrier's Access Solutions business in an all-cash transaction. The transaction was subject to regulatory review and approval and customary closing conditions. The transaction was expected to close by the end of the third quarter of 2024, and the business would be reported within the Honeywell Building Technologies reportable business segment.
- April 2024 : Johnson Controls renewed its partnership with Everbridge to enhance organizational resilience against global threats. By integrating OpenBlue and Everbridge 360, security leaders gain real-time risk insights, automated emergency workflows, and mass communication tools, ensuring business continuity, asset protection, and improved response to geopolitical and environmental challenges.
- December 2024 : Thales partnered with one of the leading Korean mobile operators, SK Telecom, to deploy Post Quantum Cryptography (PQC) on 5G networks to upgrade subscribers' identity and privacy protection.
- October 2024 : Axis Communications partnered with Redington to enhance the distribution of advanced surveillance solutions across India. This partnership would enable Axis Communications to leverage Redington's extensive partner network, allowing it to reach a broader customer base and enhance security and business performance for various organizations.
- April 2024 : ASSA ABLOY acquired MESSERSCHMITT Systems, enhancing its access control solutions for the hospitality market. This acquisition aligned with ASSA ABLOY's strategy to strengthen its market position through complementary products, offering growth potential in the DACH region and the Middle East. The deal promises synergy opportunities and an expanded product portfolio.
Table of Contents
 Exclusive indicates content/data unique to MarketsandMarkets and not available with any competitors.
Methodology
The study involved four major activities in estimating the current size of the commercial security system market—exhaustive secondary research collected information on the market, peer, and parent markets. The next step was to validate these findings, assumptions, and sizing with industry experts across the value chain through primary research. Both top-down and bottom-up approaches were employed to estimate the complete market size. After that, market breakdown and data triangulation were used to estimate the market size of segments and subsegments.
Secondary Research
Various secondary sources have been referred to in the secondary research process to identify and collect necessary information for this study. The secondary sources include annual reports, press releases, and investor presentations of companies; white papers; journals and certified publications; and articles from recognized authors, websites, directories, and databases. Secondary research has been conducted to obtain critical information about the industry’s supply chain, the market’s value chain, the total pool of key players, market segmentation according to the industry trends (to the bottom-most level), regional markets, and key developments from market- and technology-oriented perspectives. The secondary data has been collected and analyzed to determine the overall market size, further validated by primary research.
List of major secondary sources
|
Source |
Web Link |
|
VideoSurveillance.com |
https://www.videosurveillance.com/ |
|
SecurityInfoWatch.com |
https://www.securityinfowatch.com/video-surveillance |
|
Electronic Security Association (ESA) |
https://esaweb.org/ |
|
Security Magazine |
https://www.securitymagazine.com/ |
|
National Fire Protection Association (NFPA) |
https://www.nfpa.org/ |
|
Fire Protection Association (FPA) |
https://www.thefpa.co.uk/ |
|
International Association of Certified Thermographers |
https://iactthermography.org/ |
Primary Research
In the primary research process, various primary sources from both the supply and demand sides were interviewed to obtain qualitative and quantitative information for this report. The primary sources from the supply side included industry experts, such as chief executive officers (CEOs), vice presidents (VPs), marketing directors, technology and innovation directors, and related key executives from various key companies and organizations operating in the commercial security system market. After the complete market engineering (calculations for market statistics, market breakdown, market size estimations, market forecasting, and data triangulation), extensive primary research was conducted to gather information and verify and validate the critical numbers arrived at. Primary research was also conducted to identify the segmentation types, industry trends, competitive landscape of commercial security system solutions offered by various market players, and key market dynamics, such as drivers, restraints, opportunities, challenges, industry trends, and key player strategies.
In the complete market engineering process, the top-down and bottom-up approaches and several data triangulation methods were extensively used to perform the market estimation and market forecasting for the overall market segments and subsegments listed in this report. Extensive qualitative and quantitative analysis was performed on the complete market engineering process to list the key information/insights throughout the report.

Note: Other designations include sales, marketing, and product managers
The three tiers of the companies have been defined based on their total revenue as of 2023: tier 1: revenue greater than USD 1 billion, tier 2: revenue between USD 500 million and USD 1 billion, and tier 3: revenue less than USD 500 million.
To know about the assumptions considered for the study, download the pdf brochure
Market Size Estimation
In the complete market engineering process, top-down and bottom-up approaches and several data triangulation methods have been used to estimate and forecast the overall market segments and subsegments listed in this report. Key players in the market have been identified through secondary research, and their market shares in the respective regions have been determined through primary and secondary research. This entire procedure includes the study of annual and financial reports of the top market players and extensive interviews for key insights (quantitative and qualitative) with industry experts (CEOs, VPs, directors, and marketing executives).
All percentage shares, splits, and breakdowns have been determined using secondary sources and verified through primary sources. All the parameters affecting the markets covered in this research study have been accounted for, viewed in detail, verified through primary research, and analyzed to obtain the final quantitative and qualitative data. This data has been consolidated and supplemented with detailed inputs and analysis from MarketsandMarkets and presented in this report. The following figure represents this study’s overall market size estimation process.
Commercial Security System Market : Top-Down and Bottom-Up Approach

Data Triangulation
After arriving at the overall market size from the above estimation process, the market has been split into several segments and subsegments. The data triangulation procedure has been employed wherever applicable to complete the overall market engineering process and arrive at the exact statistics for all segments and subsegments. The data has been triangulated by studying various factors and trends from both the demand and supply sides. Additionally, the market size has been validated using top-down and bottom-up approaches.
Market Definition
Commercial security systems are technology-driven solutions that protect businesses, people, and assets from theft, vandalism, and fire threats. These tailored systems are used for AI-powered video surveillance, biometric access control, real-time intrusion detection, and advanced fire detection applications. By ensuring seamless interoperability, they enhance safety and operational efficiency across various facilities, including warehouses and retail outlets. Cloud-based platforms improve scalability and remote access while proactively helping identify threats. Leading providers, such as Securitas Technology, customize these systems to meet specific business needs and regulatory requirements.
Key Stakeholders
- System manufacturers and OEMs
- Software providers
- Hardware providers
- System integrators
- End users/Customers
- Regulatory and certification bodies
- Security service providers
- Investors and venture capital firms
- Real estate developers and facility managers
- Distributors and channel partners
- Associations, organizations, forums, and alliances related to commercial security systems
- Technology investors
- Governments and financial institutions
- Venture capitalists, private equity firms, and startups
Report Objectives
- To define, describe, and forecast the commercial security system market, by hardware, software, service, end user, and region, in terms of value
- To describe and forecast the market for various segments with respect to four main regions—North America, Europe, Asia Pacific, and the Rest of the World (RoW), in terms of value
- To describe and forecast the commercial security system market for video surveillance cameras and RFID tags, in terms of volume
- To provide detailed information about the key factors, such as drivers, restraints, opportunities, and challenges, value chain analysis, Porter’s five forces analysis, trade analysis, case study analysis, US tariff impact analysis, AI/Gen AI Impact analysis, and technology analysis, influencing the growth of the market
- To strategically analyze micromarkets with respect to individual growth trends, prospects, and contributions to the total market
- To analyze opportunities for stakeholders by identifying high-growth segments of the commercial security system market
- To benchmark players within the market using the proprietary ‘Company Evaluation Matrix’ framework, which analyzes market players on various parameters within the broad categories of market ranking and product offerings
- To strategically profile key players and comprehensively analyze their market share and core competencies, and provide a detailed competitive landscape for market leaders
- To analyze competitive developments, such as partnerships, collaborations, agreements, mergers and acquisitions, expansions, and product launches and developments, in the commercial security system market
Available Customizations
With the given market data, MarketsandMarkets offers customizations according to the specific requirements of companies. The following customization options are available for the report:
- Detailed analysis and profiling of additional market players (up to 5)
- Additional country-level analysis of the commercial security system market
Product Analysis
- The product matrix provides a detailed comparison of the product portfolio of each company in the commercial security system market.
Key Questions Addressed by the Report
At what CAGR is the commercial security system market anticipated to grow from 2025 to 2030?
The global commercial security system market is expected to record a CAGR of 11.4% between 2025 and 2030.
Which regions are expected to pose significant demand for commercial security systems during the forecast period?
Asia Pacific and North America are likely to witness substantial demand for commercial security systems owing to increasing security concerns, rapid urbanization, and infrastructure development, which are boosting demand for integrated surveillance and access control systems. Government mandates also prompt the adoption of advanced commercial security technologies across industries.
What are the significant growth opportunities in the commercial security system market?
The commercial security system market presents significant opportunities driven by the rising adoption of AI-powered surveillance, cloud-based access control, and IoT-enabled monitoring. Increasing investments in smart infrastructure, regulatory compliance requirements, and growing awareness of threat prevention are fueling demand. Emerging economies present untapped potential due to rapid urbanization and digitization.
Who are the key commercial security system market players?
Honeywell International Inc. (US), Bosch Sicherheitssysteme GmbH (Germany), NEC Corporation (Japan), Johnson Controls (US), Thales (France), Axis Communications AB (Sweden), ASSA ABLOY (Sweden), IDEMIA (France), Teledyne Technologies Incorporated (US), Identiv, Inc. (US),
Who are the major end users of commercial security systems?
Healthcare, automotive & transportation, sports & leisure industries are the major commercial security system end users.
Need a Tailored Report?
Customize this report to your needs
Get 10% FREE Customization
Customize This ReportPersonalize This Research
- Triangulate with your Own Data
- Get Data as per your Format and Definition
- Gain a Deeper Dive on a Specific Application, Geography, Customer or Competitor
- Any level of Personalization
Let Us Help You
- What are the Known and Unknown Adjacencies Impacting the Commercial Security System Market
- What will your New Revenue Sources be?
- Who will be your Top Customer; what will make them switch?
- Defend your Market Share or Win Competitors
- Get a Scorecard for Target Partners

Custom Market Research Services
We Will Customise The Research For You, In Case The Report Listed Above Does Not Meet With Your Requirements
Get 10% Free CustomisationTESTIMONIALS

Tetsuya Ohhira
Business Development Manager-Technology Business
Nikon Corporation,
Leading Japanese MNC specializing in optics and imaging productswww.nikon.com
MarketsandMarkets™ response
is quick. Their attitude is flexible and positive. Analyst Insights are globally considered and
significant. Client Services quickly respond to our inquiry and demand. Their wide range of global
surveys help us make our strategic plan.
We hope Knowledge Store will be easier to search
for a report.
VP - Marketing & Business Development
Leading Provider of Process Control Solutions
We engaged with MarketsandMarkets on a study to perform an analysis and recommend a Go-To-Market strategy for metrology and process control in the semiconductor market. The study was tailored to our targets and needs with well-defined milestones. Our overall experience with the MarketsandMarkets team was very good throughout the project in all aspects including the analysis methodologies used, the quality and depth of primary and secondary data sets, the professionalism and flexibility of the team and the ability to meet the target schedule and milestones. We want to thank MarketsandMarkets team for a job well done.

Still Researching the
Commercial Security System Ecosystem?
See the competitors, opportunity evaluation, and growth signals shaping it - Instantly!
Generate 15+ consulting-grade strategic intelligence outputs - from competitor analysis to board-ready strategy decks, tailored to your Commercial Security System growth question.


Growth opportunities and latent adjacency in Commercial Security System Market