
3D Cell Culture Market Size, Growth, Share & Trends Analysis

3D Cell Culture Market by Product (Scaffolds [Hydrogels, Solid Scaffolds], Scaffold-free [Low Attachment Plates, Microfluidics, Bioprinted]), Application (Cancer, Stem Cell Research, Tissue Engineering), Trends, End User, Region - Global Forecast to 2030


OVERVIEW
Source: Secondary Research, Interviews with Experts, MarketsandMarkets Analysis
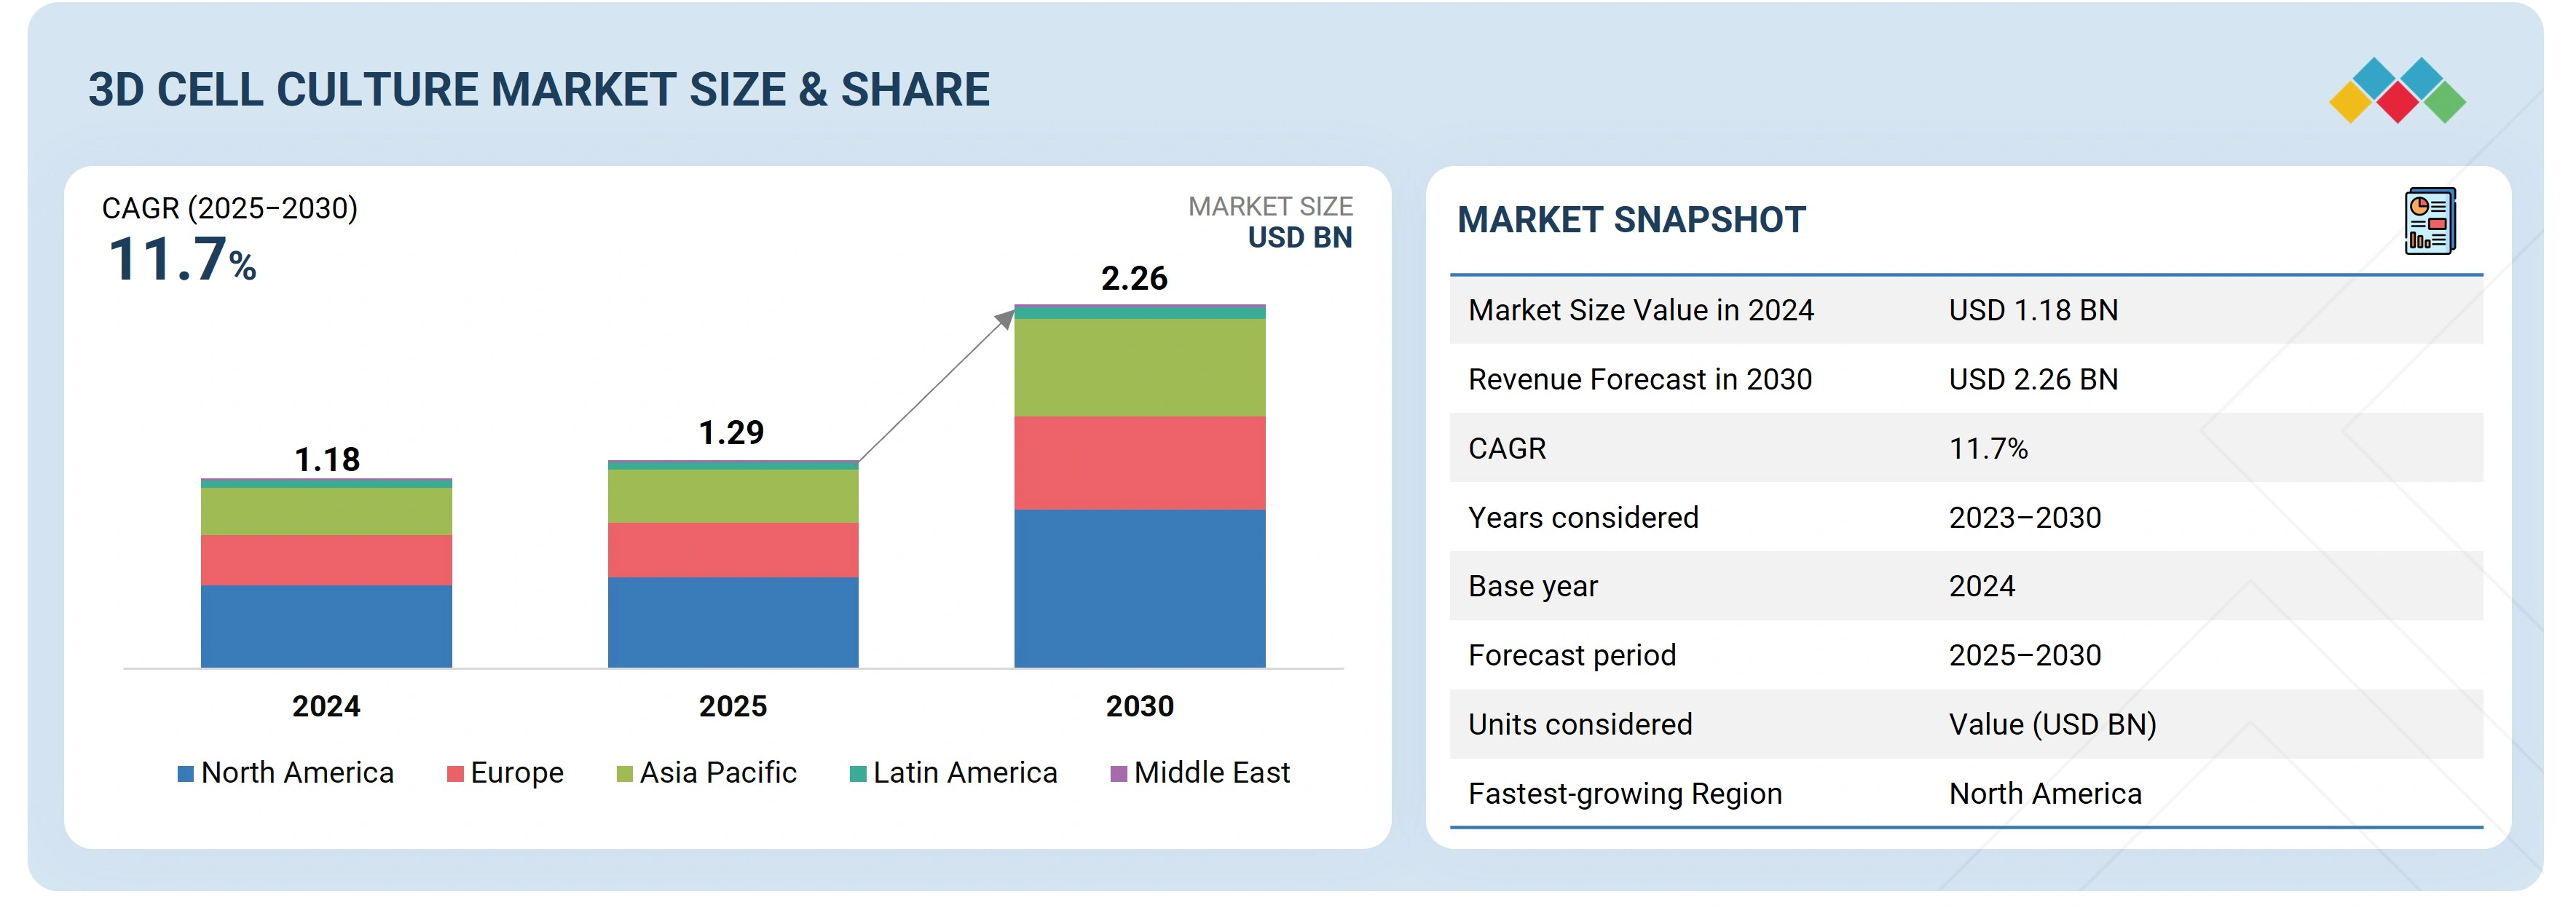
The 3D cell culture market is projected to reach USD 2.26 billion by 2030 from USD 1.29 billion in 2025 at a CAGR of 11.7% from 2025 to 2030. The market growth is driven by the adoption of personalized medicine globally for multiple diseases and government support & funding for 3D cell culture.
KEY TAKEAWAYS
-
BY PRODUCTThe 3D cell culture market comprises scaffold-based 3D cell cultures, scaffold-free 3D cell cultures, microfluidics-based 3D cell cultures, and magnetic & bioprinted cell cultures. Scaffold-based 3D cell cultures dominate due to their structural rigidity, availability of attachment points, and support, which drives the preference for scaffold-based 3D cell cultures among end users.
-
BY APPLICATIONApplications span cancer & stem cell research, drug discovery & toxicology testing, and tissue engineering & regenerative medicine. The cancer & stem cell research is expected to hold the largest share, driven by the rising prevalence of cancer globally and increasing investments in cancer research.
-
BY END USERThe market encompasses end users such as pharmaceutical & biotechnology companies, research institutes, the cosmetics industry, and other end users (such as chemical, agrochemical, and food & beverage industries). The pharmaceutical & biotechnology companies dominate due to strong manufacturing and R&D activities.
-
BY REGIONThe 3D cell culture market covers North America, Europe, Asia Pacific, Latin America, the Middle East, and Africa. The North American market accounted for the largest share, driven by the rising support for life science research, availability of government and private funding, robust biopharmaceutical R&D infrastructure, and the presence of major players in the market, ensuring product availability and innovation.
-
COMPETITIVE LANDSCAPEMajor market players have adopted organic and inorganic strategies, including product launches, collaborations, agreements, acquisitions, and partnerships. For instance, Merck KGaA (Germany) entered into an agreement to expand its 2D and 3D cell culture portfolio by acquiring HUB Organoids (Netherlands) to cater to the growth in the 3D cell culture market.
The 3D cell culture market is projected to grow over the next decade, supported by high growth opportunities and the rising biopharmaceutical sector in emerging countries. The market growth is driven by the adoption of personalized medicine globally for multiple diseases and government support & funding for 3D cell culture. The rising number of industry-academia collaborations on 3D cell culture and research further supports the growth of the market.
TRENDS & DISRUPTIONS IMPACTING CUSTOMERS' CUSTOMERS
The 3D cell culture market is witnessing strong shifts as customers’ customers demand safer, faster, and more cost-effective solutions. Pharmaceutical and biotechnology companies focus on high-throughput, regulatory-compliant testing, while academic and research institutes emphasize organoid integration and biomarker discovery. Cosmetics players seek reliable human-relevant models and alternatives to animal testing, and agrochemical, food, and beverage industries prioritize toxicity and scalable testing. These imperatives drive innovations in organ-on-chip systems, automation, and miniaturization, ultimately leading to faster approvals, safer medicines, consumer safety, and reduced costs.

Source: Secondary Research, Interviews with Experts, MarketsandMarkets Analysis
MARKET DYNAMICS
Level
-
High focus on developing alternatives to animal testing

-
Increasing adoption of personalized medicine for multiple diseases

Level
-
High costs of implementing 3D cell culture technologies

-
Lack of widely accepted or single standardization in 3D cell culture

Level
-
Emergence of microfluidics-based 3D cell culture

-
High growth opportunities and booming biopharmaceutical sector in emerging economies

Level
-
Lack of consistency in 3D cell culture products

-
High dependence on plastic waste disposals and consumables

Source: Secondary Research, Interviews with Experts, MarketsandMarkets Analysis
Driver: High focus on developing alternatives to animal testing
Growing ethical concerns and regulatory restrictions on animal testing are accelerating the adoption of 3D cell culture. These models replicate human tissue physiology more accurately than 2D systems, enabling predictive drug testing and toxicity studies while reducing reliance on costly, time-consuming animal models across research and industry applications.
Restraint: High costs of implementing 3D cell culture technologies
The adoption of 3D cell culture technologies is limited by high costs associated with specialized equipment, consumables, and cell lines. Advanced instruments such as bioreactors, microfluidic devices, and imaging systems require significant investment. Ongoing maintenance expenses further restrict large-scale adoption, particularly among smaller research facilities and emerging biotech firms.
Opportunity: Emergence of microfluidics-based 3D cell culture
Advances in microfluidics are creating new growth avenues by enabling organ-on-a-chip models that replicate complex microenvironments and tissue interfaces. These innovations support organ-specific disease modeling, enhance drug development, and reduce reliance on animal models. Expanding applications in personalized medicine and regenerative therapies further strengthen the opportunity for market growth.
Challenge: Lack of consistency in 3D cell culture products
Variability in scaffold-based 3D culture products continues to challenge reproducibility in research. Batch-to-batch inconsistencies, particularly in growth factor content, affect outcomes in signaling and pharmacological studies. Although synthetic biomaterials are emerging as solutions, ensuring consistent performance remains critical for scaling reliable 3D cell culture applications globally.
3D Cell Culture Market: COMMERCIAL USE CASES ACROSS INDUSTRIES
| COMPANY | USE CASE DESCRIPTION | BENEFITS |
|---|---|---|
 |
Integrated automated workflows using Akura PLUS Hanging Drop Plates and Akura 96 Spheroid Plates for scalable production of 3D microtissues | Enhanced reproducibility and throughput in drug discovery, enabling consistent generation of complex 3D models for predictive toxicity and efficacy testing |
 |
Collaborated with SPT Labtech to automate forskolin-induced swelling assays of human intestinal organoids using Dragonfly Discovery dispensing technology and Corning Matrigel matrix | Streamlined high-throughput screening of gastrointestinal drug candidates, improving efficiency and consistency in organoid-based assays |
Logos and trademarks shown above are the property of their respective owners. Their use here is for informational and illustrative purposes only.
MARKET ECOSYSTEM
The 3D cell culture market ecosystem comprises product providers (Thermo Fisher Scientific Inc., Merck KGaA), regulatory bodies (US Food and Drug Administration, European Medicines Agency), and end users (Amgen Inc., Novartis AG). Raw materials such as scaffolds, hydrogels, extracellular matrices, bioreactors, culture media, growth factors, and consumables are utilized by laboratories, pharmaceutical companies, and service providers to develop and maintain physiologically relevant 3D cell models. End users drive demand for reproducibility, scalability, and translational relevance, while providers ensure validated protocols, automated platforms, and robust quality control. Collaboration across the value chain is critical to advancing tissue modeling, organoid development, and high-throughput screening workflows, ultimately accelerating drug discovery, toxicity testing, and personalized medicine applications.

Logos and trademarks shown above are the property of their respective owners. Their use here is for informational and illustrative purposes only.
MARKET SEGMENTS

Source: Secondary Research, Interviews with Experts, MarketsandMarkets Analysis
3D Cell Culture Market, By Product
The 3D cell culture market is segmented by product into scaffold-based 3D cell cultures, scaffold-free 3D cell cultures, microfluidics-based 3D cell cultures, and magnetic & bioprinted 3D cell cultures. The scaffold-based 3D cell culture segment accounted for the largest share of the 3D cell culture market in 2024. The advantages of scaffolds in 3D cell cultures, such as structural rigidity, the availability of attachment points, and support, have driven the preference for scaffold-based 3D cell cultures among end users and have ensured a large share of this segment.
3D Cell Culture Market, By Application
The 3D cell culture market, by application, is segmented into cancer & stem cell research, drug discovery & toxicology testing, and tissue engineering & regenerative medicine. The cancer & stem cell research segment accounted for the largest share of the 3D cell culture market in 2024. The growth in this market segment is driven by the rising prevalence of cancer globally and increasing investments in cancer research.
3D Cell Culture Market, By End User
Based on end user, the 3D cell culture market is broadly segmented into pharmaceutical & biotechnology companies, research institutes, the cosmetics industry, and other end users. In 2024, the pharmaceutical & biotechnology companies segment commanded the largest share of the 3D cell culture market attributed to the strong manufacturing and R&D activities.
REGION
Asia Pacific to be fastest-growing region in global 3D cell culture market during forecast period
The Asia Pacific region is expected to record the fastest growth in the 3D cell culture market during the forecast period. This expansion is driven by the rising focus and use of personalized medicines in key countries such as China, India, and Japan.

3D Cell Culture Market: COMPANY EVALUATION MATRIX
Thermo Fisher Scientific Inc. (Star) leads the 3D cell culture market with a strong market share and a comprehensive product and service portfolio, driven by its high-quality scaffolds, hydrogels, bioreactors, and culture media widely adopted in drug discovery, toxicity testing, and organoid research. Synthecon, Incorporated (Emerging Leader) is gaining traction with its innovative Rotary Cell Culture Systems (RCCS), specialized bioreactors, and tailored solutions for stem cell and tissue engineering applications, strengthening its position through technological advancements and niche offerings. While Thermo Fisher dominates through scale, global presence, and extensive product offerings, Synthecon shows significant potential to move toward the leaders’ quadrant as demand for reliable, scalable, and physiologically relevant 3D cell culture models continues to grow.

Source: Secondary Research, Interviews with Experts, MarketsandMarkets Analysis
KEY MARKET PLAYERS
- Thermo Fisher Scientific Inc. (US)
- Merck KGaA (Germany)
- Corning Incorporated (US)
- Lonza (Switzerland)
- Tecan Trading AG (Switzerland)
- Avantor, Inc.(US)
- REPROCELL Inc. (Japan)
- S-BIO, Vaupell Holdings Inc. (US)
- Advanced BioMatrix, Inc. (US)
- UPM Biomedicals (Finland)
- SYNTHECON, INCORPORATED (US)
- InSphero (Switzerland)
- Emulate, Inc. (US)
MARKET SCOPE
| REPORT METRIC | DETAILS |
|---|---|
| Market Size in 2024 (Value) | USD 1.18 Billion |
| Market Forecast in 2030 (value) | USD 2.26 Billion |
| Growth Rate | CAGR of 11.7% from 2025–2030 |
| Years Considered | 2023–2030 |
| Base Year | 2024 |
| Forecast Period | 2025–2030 |
| Units Considered | Value (USD Million/USD Billion) |
| Report Coverage | Revenue forecast, company ranking, competitive landscape, growth factors, and trends |
| Segments Covered | By Product: Scaffold-Based 3D Cell Cultures, Scaffold-Free 3D Cell Cultures, Microfluidics-Based 3D Cell Cultures, and Magnetic & Bioprinted Cell Cultures By Application: Cancer & Stem Cell Research, Drug Discovery & Toxicology Testing, and Tissue Engineering and Regenerative Medicine By End User: Pharmaceutical & Biotechnology Companies, Research Institutes, Cosmetics Industry, and Other End Users (such as chemical, agrochemical, and food & beverage industries) |
| Regions Covered | North America, Asia Pacific, Europe, Latin America, Middle East & Africa |
WHAT IS IN IT FOR YOU: 3D Cell Culture Market REPORT CONTENT GUIDE

DELIVERED CUSTOMIZATIONS
We have successfully delivered the following deep-dive customizations:
| CLIENT REQUEST | CUSTOMIZATION DELIVERED | VALUE ADDS |
|---|---|---|
| Rest of Europe breakdown | Country-level market sizing and growth forecasts (Sweden, Switzerland, Turkey, the Netherlands, Norway, Poland, Portugal, Romania, Denmark, Estonia, Finland, the Czech Republic, Greece, Austria, Belgium, and Russia) | Provides granular country-level insights, enabling clients to prioritize high-growth markets and tailor portfolio strategies across the product segment for maximum regional impact |
| Company Evaluation |
|
Delivers visibility into competitors, helping clients identify partners, evaluate positioning, and detect market gaps for smarter collaboration, outsourcing, and strategic market entry decisions |
RECENT DEVELOPMENTS
- April 2025 : RoosterBio and Thermo Fisher Scientific partnered to combine hMSC-based products of RoosterBio with the GMP contract manufacturing capabilities of Thermo Fisher. This will accelerate the production of cell and exosome therapeutics for clinical trials.
- April 2025 : Thermo Fisher Scientific inaugurated its Advanced Therapies Collaboration Center (ATxCC) in Carlsbad, California, to support the transition of cell therapies from research to clinical and commercial scales. This 6,000-square-foot facility offers end-to-end manufacturing workflows, integrating instrumentation, reagents, and analytical solutions to streamline process development.
- May 2025 : Merck and IMEC have announced a strategic collaboration to develop an advanced MicroPhysiological Systems (MPS) platform aimed at enhancing drug discovery efficiency. This partnership integrates organoid biology with semiconductor technology, incorporating biosensing and microfluidic capabilities to simulate human biological responses with high precision.
- December 2024 : Merck KGaA agreed to acquire HUB Organoids Holding B.V., expanding its 2D and 3D cell culture capabilities with organoid models to accelerate drug development and reduce reliance on animal testing.
Table of Contents
 Exclusive indicates content/data unique to MarketsandMarkets and not available with any competitors.
Methodology
This research study extensively used secondary sources, directories, and databases to identify and collect valuable information to analyze the global 3D cell culture market. In-depth interviews were conducted with various primary respondents, including key industry participants, subject-matter experts (SMEs), C-level executives of key market players, and industry consultants, to obtain and verify critical qualitative & quantitative information and assess the market's growth prospects. The global market size estimated through secondary research was then triangulated with inputs from primary research to arrive at the final market size.
Secondary Research
Secondary research was used primarily to identify & collect information for the extensive, technical, market-oriented, and commercial study. The secondary sources used for this study include World Health Organization (WHO), American Society for Cell Biology (ASCB), American Society for Gene and Cell Therapy (ASGCT), Centers of Disease Control and Prevention (CDC), and Japan Agency for Medical Research and Development, ClinicalTrials.gov, Annual Reports, SEC Filings, Investor Presentations, Research Journals, Press Releases, and financial statements. These sources also obtained key information about major players, market classification, and segmentation according to industry trends, regional/country-level markets, market developments, and technology perspectives.
Primary Research
In-depth interviews were conducted with various primary respondents, including key industry participants, subject-matter experts (SMEs), C-level executives of key market players, and industry consultants, to obtain and verify the critical qualitative & quantitative information and assess the prospects of the market. Various primary sources from both the supply & demand sides of the market were interviewed to obtain qualitative and quantitative information. The following is a breakdown of the primary respondents:
The following is a breakdown of the primary respondents:

To know about the assumptions considered for the study, download the pdf brochure
Market Size Estimation
Both top-down and bottom-up approaches were used to estimate & validate the total size of the 3D cell culture market. These methods were also used extensively to estimate the size of various subsegments in the market. The research methodology used to estimate the market size includes the following:

Data Triangulation
The total market was split into several segments and subsegments after arriving at the overall market size from the estimation process. Where applicable, data triangulation and market breakdown procedures were employed to complete the overall market engineering process and arrive at the exact statistics for all segments and subsegments. The data was triangulated by studying various factors and trends from both the demand and supply sides.
Market Definition
3D cell culture refers to the cultivation of cells in an environment that closely mimics the three-dimensional structure and conditions found in living tissues or organs. In 3D cell culture, cells are grown within a matrix or scaffold that provides a three-dimensional framework, allowing cells to interact with each other and their environment more realistically. This can include using hydrogels, sponges, scaffolds, or even specialized bioprinting techniques to create a structure that supports cell growth and tissue formation.
The study provides an in-depth analysis of the 3D cell culture market based on contemporary market trends and developments, as well as its potential growth from 2025 to 2030. It includes detailed market trends, the competitive landscape, market size, forecasts, and the analysis of the key companies.
Stakeholders
- 3D Cell Culture Product Manufacturers
- Academic Research Institutes
- Pharmaceutical & Biotechnology Companies
- Life Science Companies
- Venture Capitalists and Investors
- Government Organizations
- Private Research Firms
- Contract Research Organizations (CROs)
- Contract Development and Manufacturing Organizations (CDMOs)
- Research & Development Companies
Report Objectives
- To define, describe, and forecast the 3D cell culture market based on product, application, end user, and region
- To provide detailed information regarding the major factors influencing the market growth (such as drivers, restraints, opportunities, and challenges)
- To strategically analyze micromarkets with respect to individual growth trends, prospects, and contributions to the overall 3D cell culture market
- To analyze the opportunities in the market for stakeholders and provide details of the competitive landscape for market leaders
- To forecast the size of the market segments with respect to six main regions, namely, North America, Europe, the Asia Pacific, Latin America, the Middle East, and Africa
- To strategically profile the key players in the 3D cell culture market and comprehensively analyze their core competencies and market rankings
- To track and analyze competitive developments such as product launches, acquisitions, expansions, agreements, partnerships, and collaborations in the 3D cell culture market
- To benchmark players within the 3D cell culture market using the ‘Company Evaluation Matrix' framework, which analyzes market players based on various parameters within the broad categories of business and product strategy
Need a Tailored Report?
Customize this report to your needs
Get 10% FREE Customization
Customize This ReportPersonalize This Research
- Triangulate with your Own Data
- Get Data as per your Format and Definition
- Gain a Deeper Dive on a Specific Application, Geography, Customer or Competitor
- Any level of Personalization
Let Us Help You
- What are the Known and Unknown Adjacencies Impacting the 3D Cell Culture Market
- What will your New Revenue Sources be?
- Who will be your Top Customer; what will make them switch?
- Defend your Market Share or Win Competitors
- Get a Scorecard for Target Partners

Custom Market Research Services
We Will Customise The Research For You, In Case The Report Listed Above Does Not Meet With Your Requirements
Get 10% Free CustomisationTESTIMONIALS

JAYANT RAJPUROHIT
Director of Market Insights, Data and Analytics
SFI Health,
Leading Pharmaceutical Companywww.sfihealth.com/

We at SFI Health approached MarketsandMarkets for an Opportunity Assessment on "Incidence and Prevalence of Focus Indications" as we wanted to know the most attractive HCPs like Physician, Functional MD, Naturopath and Pharmacist. The project was critical for us to ensure our focus on the right target which would enable sustainable growth and profitability for SFI Health. The business insights provided exceeded our expectations and we were extremely impressed. The team at MarketsandMarkets is highly professional and detail oriented and very well understood our business needs. MarketsandMarkets offers a unique combination of expertise and dedicated engagement model. We identified 2 new products to be launched in coming months, based on the research findings provided by MarketsandMarkets. We are happy with the services and would strongly recommend MarketsandMarkets to my peers in the industry.

BEATRIZ DE LA CALLE
Head of Commercial Analytics
Qualicaps,
Leading Pharmaceutical Companywww.qualicaps.com/

We partnered with MarketsandMarkets for an assessment study on hard empty capsules. The team was extremely professional in understanding our business requirements and we received timely responses to all our queries. The market intelligence and the recommendations has met our business requirements. We were extremely impressed to see the final study results; it really exceeded our expectations. The market intelligence offered by MarketsandMarkets, and clarity on next steps will help us achieve our business objective for the Year 2021. We are happy with the services and would strongly recommend MarketsandMarkets to my peers in the industry.

Bob Williams,
Senior Director Business Development & Innovation
Bracco Diagnostics Inc.,
Italian Multinational in life sciences sector and a World Leader in imaging diagnosticsimaging.bracco.com/us-en
We were pleased with targeted insights that MarketsandMarkets identified from a custom study on the 'Radiation Dose Management Solutions Market'. Your team identified and characterized the market participants as well as underlying trends accurately. This study was useful to Bracco in formulating business strategies for our dose monitoring product lines and we thank MarketsandMarkets for the job well done.
Cody Coonradt,
Market Development and Strategy Manager
3M Health Information Systems,
Leader in Health care Coding, Payment & Analytics Solutions.www.3m.com/3M/en_US/health-information-systems-us
The value for our organization comes from three things: depth of research, specificity of segments and being easy to work with. As important as the first two are, the third can't be underestimated. MarketsandMarkets, maybe more than any other research vendor, wants to know what is top of mind for our team and what big questions we are grappling to answer.
Their customer first approach and high value engagement model, have given us great analysis and excellent value for money
Growth opportunities and latent adjacency in 3D Cell Culture Market


Joe
Jun, 2022
How the leading companies are dominating the Global 3D Cell Culture Market?.
Jennifer
Jun, 2022
Which of the segment is expected to grab the largest share of the global 3D Cell Culture Market?.
Brad
Jun, 2022
I need more details on the market growth influencing factors for the global 3D Cell Culture Market. Thank You.