Cannabis Testing Market

Cannabis Testing Market Size by Product & Software (Instruments, Consumables, LIMS), Services (Heavy Metal Testing, Microbial Analysis, Potency, Residual Screening), End-User (Cultivators, Laboratories, Research Institutes) & Region - Global Forecast to 2025

Report Code: BT 5107 Jan, 2021, by marketsandmarkets.com

The global size of cannabis testing market in terms of revenue was estimated to be worth USD 962 million in 2020 and is poised to reach USD 1,806 million, growing at a CAGR of 13.4% from 2020 to 2025. The research study consists of an industry trend analysis, pricing analysis, patent analysis, conference and webinar materials, key stakeholders, and buying behaviour in the market.

The growth in this market is mainly driven by factors such as the legalization of medical cannabis and the growing number of cannabis testing laboratories (specifically in the US), the growing adoption of LIMS in cannabis testing laboratories, and increasing awareness about the latest trends and available technologies in the cannabis testing market. Additionally, emerging markets in LATAM and the MEA region, and increasing merger & acquisition among various cannabis testing equipment manufacturers, laboratories and small market players will provide significant growth opportunities for the market players in the near future. On the other hand, a lack of uniformity in rules and regulations, high costs, and inadequate personnel are major factors expected to hamper the market growth.

Cannabis Testing Market

To know about the assumptions considered for the study, Request for Free Sample Report

Cannabis Testing Market Dynamics

Drivers: Legalization of medical cannabis coupled with the growing number of cannabis testing laboratories

Medical cannabis has proven effective in various medical applications, such as reducing nausea caused due to chemotherapy, stimulating appetite in AIDS patients, controlling muscular spasms in multiple sclerosis patients, and reducing intraocular pressure in patients with glaucoma. Owing to their health benefits, governments in various countries are legalizing the use of medical cannabis—Australia (2016), Canada (2015), North Korea, Spain, Portugal (2001), the UK (2006), Germany (2017), Italy, the Netherlands, Israel, and Brazil have all legalized the use of medical cannabis in recent years. Moreover, in the US, 25 states have legalized medical cannabis, while four—Colorado, Washington, Oregon, and Alaska—have legalized cannabis for medical and recreational use. As medical cannabis is being legalized in several countries/states globally, the demand for the analytical testing of cannabis for ensuring its safety before human consumption has increased in recent years. According to industry experts, the number of cannabis testing labs is expected to grow at a significant CAGR in the coming years, primarily due to the growing legalization and increased adoption of cannabis testing. Such trends indicate the expected growth in demand for analytical instrumentation, software, and services for cannabis testing in the coming years.

Restraints: Lack of uniform rules and regulations

The increased use of cannabis for medical purposes has led to the legalization of cannabis in various countries worldwide. However, a lack of uniform testing standards or stringent rules and regulations has emerged as a prominent consideration. Operating a testing laboratory in the cannabis testing industry devoid of universal standards can be challenging, as licensing and regulatory requirements vary from state to state and can change abruptly with updates in state policies. The 2018 Farm Bill legalized the cultivation and production of hemp in the US. However, hemp cannot contain more than 0.3% THC, as per section 10113 of the Farm Bill. Any cannabis plant that contains more than 0.3% THC would be considered non-hemp cannabis—or marijuana—under federal law. Additionally, various testing standards must be adhered to while establishing a lab; lab accreditation is also required, with specifications varying from state to state. Such stringent regulations are likely to hamper the market growth.

Opportunities: Emerging markets in LATAM and the MEA

Emerging economies across LATAM (Latin America) and the MEA (the Middle East and Africa) are expected to witness high growth in the cannabis testing market. This can primarily be attributed to the strong government support for the legalization of medical marijuana in these countries compared to other regions. This is attracting various investors, prominent players, and government bodies to invest in developing standards for cannabis testing laboratories or enhance their operations and activity. For instance, MediPharm Labs Corp (Canada, US) entered into a supply agreement to supply premium, GMP-certified formulated cannabis oil to XLR8 BRAZIL, a Rio de Janeiro-based value-added distributor serving Brazil, Latin America’s largest medical cannabis market

Moreover, new players are investing in cannabis testing markets due to favorable government support. For instance, in March 2019, Afriplex established South Africa’s cannabis testing laboratory. Afriplex is a South African company specializing in developing and manufacturing botanical extracts, complementary medicines, and food & beverage product solutions.

A lack of providers and suppliers in the emerging markets creates lucrative growth opportunities for the cannabis testing industry in the coming years.

Challenges: High start-up costs for cannabis testing laboratories

High start-up costs for cannabis testing laboratories constitute one of the biggest challenges in this industry. These laboratories have to make significant investments in procuring and maintaining high-priced, advanced analytical equipment. Equipment standardization and upgrades, software requirements, accreditations and certifications (such as ISO certification protocols), and the requirement of skilled professionals further add to the cost of operations.

The impact of these factors is intensified because many banks deny funding or any other form of assistance to these laboratories due to ambiguity in the cannabis testing industry; lines of credit are also not available for laboratory owners/operators. Moreover, several municipalities are preparing a schedule to apply taxes on cannabis testing laboratories. As a result, running profitable operations after making significant investments is a major challenge, specifically for small/start-up cannabis testing laboratories.

Analytical instruments such as chromatography, spectroscopy, and PCR systems are equipped with advanced features and functionalities and thus are priced at a premium. The cost of these instruments ranges from USD 100,000 to USD 500,000. Small and medium-sized cannabis testing laboratories cannot afford such high-cost systems as they have limited budgets. Besides, the maintenance cost and several other indirect expenses for these systems increase their total cost of ownership. Maintaining these instruments is expensive, incurring costs while purchasing spares, chemicals, and consumables and conducting timely servicing.

Furthermore, the use of these instruments requires a highly trained workforce. Hence, although the cost of cannabis testing is declining, it is still considerably high for small and medium-sized research laboratories. The prohibitive initial costs of investment can restrict the adoption of cannabis testing and hamper the growth of the market. However, the standardization of regulations for the use of cannabis will help alleviate the effects of this challenge to an extent in the coming years.

By type, the services segment accounted for the largest share of the Cannabis Testing market in 2019.

Based on type, the cannabis testing market is categorized into products, services, and software. The services segment dominated the market in 2019. This segment is also poised to grow at a highest CAGR during the forecast period. The high growth of this market is owing to the growing legalization of medical marijuana (especially in the US). In addition, funding initiatives for cannabis testing laboratories and the growing number of cannabis testing laboratories are contributing to the growth of the cannabis testing services market. However, variations in cannabis testing methods and the lack of testing regulations are likely to limit the growth of the market to a certain extent.

Products accounted for the largest share of the cannabis testing market in 2020

The cannabis testing market is segmented into products and software. The product segment accounted for the largest share of the market and is expected to register the highest growth during the forecast period. The high growth of this segment can be attributed to the growing requirements for potency labeling and pesticide screening, which drive the demand for analytical instruments, introduce technologically advanced products, and increase the recurring demand for consumables. Cannabis testing products are further segmented into analytical instruments & consumables. Cannabis analytical instruments accounted for the largest share of the cannabis testing market in 2019. However, the market for consumables is expected to grow at the highest growth rate during the forecast period owing to recurring requirements and repetitive usage.

By services, the potency testing segment accounted for the largest share of the Cannabis Testing market in 2019.

Based on services, the cannabis testing market is categorized into potency testing, terpene profiling, pesticide screening, residual solvent analysis, heavy metal testing, microbial analysis, and other services. The potency testing services segment accounted for the largest share of the market and this segment is expected to grow at a highest CAGR during the forecast period. The high growth of this market is owing to the growing legalization of medical marijuana (especially in the US) and increased use of CBD for disease treatment. In addition, funding initiatives for cannabis testing laboratories and the growing number of cannabis testing laboratories are contributing to the growth of the cannabis testing services market.

North America accounted for the largest share of the Cannabis Testing market in 2019.

In 2019, North America accounted for the largest share of the cannabis testing market, followed by Europe. This market is also projected to register the highest CAGR during the forecast period. The large share of the North American regional segment can be attributed to legalization of cannabis (especially in the US) and the growing availability of products, software, and services for the cannabis testing industry, rapid growth in the number of cannabis testing laboratories, growing awareness regarding medical cannabis, rising funding for the cannabis industry, and the presence of prominent players in this region. The APAC market is expected to register the second-highest CAGR during the forecast period. Factors such as the growing biopharmaceutical industry, increasing life science research, rising investments by pharmaceutical and biotechnology companies, and the growing number of cannabis testing laboratories in the region, coupled with the legalization of cannabis for medical use, are expected to drive market growth in this region.

Cannabis Testing Market Key Players

The major market players operating in this market are Agilent Technologies, Inc. (US), Shimadzu Corporation (Japan), MERCK KGAA (Germany), Thermo Fisher Scientific (US), DigiPath, Inc. (US), Steep Hill Inc. (US), SC Laboratories, Inc. (US), and PharmLabs LLC (US)..

Get online access to the report on the World's First Market Intelligence Cloud

  • Easy to Download Historical Data & Forecast Numbers
  • Company Analysis Dashboard for high growth potential opportunities
  • Research Analyst Access for customization & queries
  • Competitor Analysis with Interactive dashboard
  • Latest News, Updates & Trend analysis
Request Sample

Scope of the Report

Report Metric

Details

Market Size Available for Years

2018–2025

Base Year Considered

2019

Forecast Period

2020–2025

Forecast Units

Value (USD Million)

Segments Covered

Product & Software, Services, End User

Geographies Covered

North America, Europe, APAC, Latin America and Middle East & Africa

Companies Covered

The major market players include as Agilent Technologies, Inc. (US), Shimadzu Corporation (Japan), MERCK KGAA (Germany), Thermo Fisher Scientific (US), DigiPath, Inc. (US), Steep Hill Inc. (US), SC Laboratories, Inc. (US), PharmLabs LLC (US) and (and 17 others)

The study categorizes the global cannabis Testing market into the following segments and subsegments:

By Product & Software

  • Analytical Instruments
  • Spectroscopy Instruments
    • Mass Spectrometry Instruments
    • Atomic Spectroscopy Instruments
  • Other Analytical Instruments
  • Consumables
    • Columns
    • Reference Standards
    • Sample Handling Products
    • Supplies & Accessories
  • Software

By Services

  • Potency Testing
  • Terpene Profiling
  • Residual Solvent Analysis
  • Microbial Analysis
  • Pesticide Screening
  • Heavy Metal Testing
  • Other Services

By End User

  • By Product & Software
  • Cannabis Testing Laboratories
    • Small-scale Laboratories
    • Medium-scale Laboratories
    • Large-scale Laboratories
  • Research Institutes

By Service

  • Cannabis Drug Manufacturers
    & Dispensaries
  • Cannabis Cultivators/Growers

By Region

  • North America
    • US
    • Canada
  • Europe
    • Germany
    • UK
    • France
    • Rest of Europe
  • Asia Pacific
    • China
    • Japan
    • Rest of Asia Pacific
  • Latin America
  • The Middle East and Africa

Recent Developments:

  • In 2020, DigiPath acquired VSSL Enterprises Ltd., a provider of agritech consulting solutions for cannabis genetics, tissue culture, cultivation, analytical testing, and predictive tools. The acquisition will expand DigiPath’s global ability to provide customers with technical services in germplasm development, tissue culture, and cultivation.
  • In 2020, Agilent Technologies Inc., launched Cannabis and Hemp Potency Kit.

Frequently Asked Questions (FAQ):

To speak to our analyst for a discussion on the above findings, click Speak to Analyst


TABLE OF CONTENTS

1 INTRODUCTION (Page No. - 33)
    1.1 OBJECTIVES OF THE STUDY
    1.2 MARKET DEFINITION
           1.2.1 INCLUSIONS & EXCLUSIONS
    1.3 MARKET SCOPE
           1.3.1 MARKETS COVERED
           1.3.2 YEARS CONSIDERED FOR THE STUDY
    1.4 CURRENCY
    1.5 LIMITATIONS
    1.6 STAKEHOLDERS
    1.7 SUMMARY OF CHANGES
           FIGURE 1 SIZE OF THE CANNABIS TESTING MARKET TO INCREASE DURING 2020−2022, COMPARED WITH THE PREVIOUS ESTIMATES OF THIS MARKET

2 RESEARCH METHODOLOGY (Page No. - 38)
    2.1 RESEARCH DATA
           2.1.1 SECONDARY DATA
           2.1.2 PRIMARY DATA
           FIGURE 2 BREAKDOWN OF PRIMARIES: GLOBAL MARKET
    2.2 DATA TRIANGULATION
           FIGURE 3 DATA TRIANGULATION METHODOLOGY
    2.3 MARKET ESTIMATION METHODOLOGY
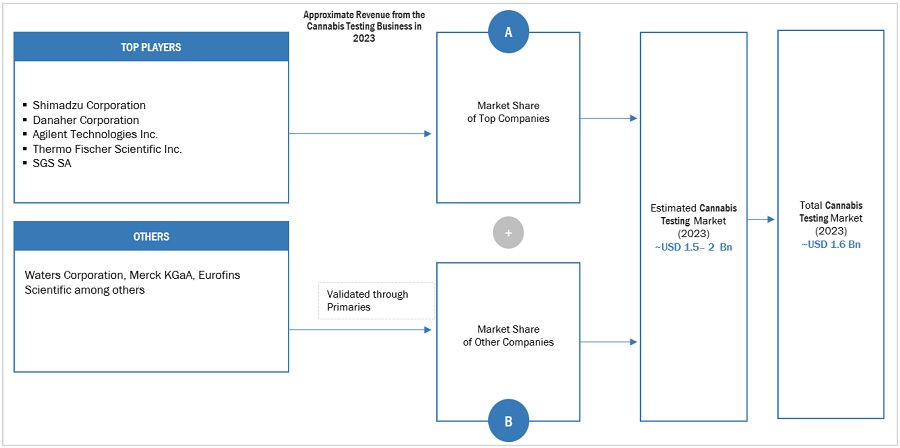
           FIGURE 4 MARKET SIZE ESTIMATION: APPROACH 1 (REVENUE-BASED ESTIMATION), 2019
           FIGURE 5 MARKET SIZE ESTIMATION: APPROACH 2 (SERVICES MARKET), 2019
           FIGURE 6 CANNABIS TESTING MARKET SIZE ESTIMATION (SUPPLY-SIDE ANALYSIS), 2019
           2.3.1 INSIGHTS FROM PRIMARY EXPERTS
           FIGURE 7 MARKET SIZE VALIDATION FROM PRIMARY SOURCES
    2.4 MARKET GROWTH RATE PROJECTIONS
           FIGURE 8 GLOBAL MARKET (SUPPLY SIDE): CAGR PROJECTIONS
    2.5 RESEARCH ASSUMPTIONS
    2.6 RISK ANALYSIS

3 EXECUTIVE SUMMARY (Page No. - 46)
           FIGURE 9 CANNABIS TESTING MARKET SHARE, BY TYPE, 2019
           FIGURE 10 GLOBAL MARKET SHARE, BY SERVICE, 2019
           FIGURE 11 GEOGRAPHICAL SNAPSHOT OF THE CANNABIS TESTING MARKET

4 PREMIUM INSIGHTS (Page No. - 49)
    4.1 CANNABIS TESTING MARKET OVERVIEW
           FIGURE 12 INCREASING USE OF MEDICAL CANNABIS FOR DISEASE TREATMENT IS A KEY FACTOR DRIVING MARKET GROWTH
    4.2 NORTH AMERICA: CANNABIS TESTING MARKET SHARE, BY TYPE & COUNTRY (2019)
           FIGURE 13 SERVICES ACCOUNTED FOR THE LARGEST SHARE OF THE NORTH AMERICAN CANNABIS TESTING MARKET IN 2019
    4.3 GLOBAL MARKET SHARE, BY PRODUCT & SOFTWARE (2019)
           FIGURE 14 PRODUCTS ACCOUNTED FOR THE LARGER MARKET SHARE IN 2019
    4.4 GLOBAL MARKET: GEOGRAPHIC GROWTH OPPORTUNITIES
           FIGURE 15 NORTH AMERICA TO REGISTER THE HIGHEST GROWTH IN THE GLOBAL MARKET FROM 2020 TO 2025

5 MARKET OVERVIEW (Page No. - 52)
    5.1 INTRODUCTION
    5.2 MARKET DYNAMICS
           FIGURE 16 GLOBAL MARKET: DRIVERS, RESTRAINTS, OPPORTUNITIES, AND CHALLENGES
           TABLE 1 CANNABIS TESTING MARKET: IMPACT ANALYSIS
           5.2.1 DRIVERS
                    5.2.1.1 Legalization of medical cannabis coupled with the growing number of cannabis testing laboratories
                    5.2.1.2 Growing adoption of LIMS in cannabis testing laboratories
                    5.2.1.3 Increasing awareness
           TABLE 2 RECENT CONFERENCES, SYMPOSIA, AND WORKSHOPS
           5.2.2 RESTRAINTS
                    5.2.2.1 Lack of uniform rules and regulations
           5.2.3 OPPORTUNITIES
                    5.2.3.1 Emerging markets in LATAM and the MEA
                    5.2.3.2 Mergers & acquisitions
           5.2.4 CHALLENGES
                    5.2.4.1 Dearth of trained laboratory professionals
                    5.2.4.2 High startup costs for cannabis testing laboratories

6 INDUSTRY INSIGHTS (Page No. - 57)
    6.1 INTRODUCTION
    6.2 KEY INDUSTRY TRENDS
           6.2.1 FOCUS ON THE USE OF CANNABIS FOR MEDICAL TREATMENT
           6.2.2 GROWTH IN FUNDING FOR CANNABIS TESTING LABORATORIES
           TABLE 3 FUNDING INITIATIVES FOR CANNABIS TESTING LABORATORIES
    6.3 REGULATORY OVERVIEW
           6.3.1 NORTH AMERICA
                    6.3.1.1 US
           TABLE 4 US: CANNABIS LAW STATUS, BY STATE
                    6.3.1.2 Canada
           TABLE 5 CANADA: MEDICAL CANNABIS LAWS
           6.3.2 EUROPE
           TABLE 6 EUROPE: MEDICAL CANNABIS LAWS, BY COUNTRY
           6.3.3 ASIA PACIFIC
           TABLE 7 ASIA PACIFIC: MEDICAL CANNABIS LAWS, BY COUNTRY
           6.3.4 LATAM & MEA
           TABLE 8 LATAM & MEA: MEDICAL CANNABIS LAWS, BY COUNTRY/REGION
    6.4 PRICING ANALYSIS
           TABLE 9 AVERAGE COST TEST BY LABORATORIES
           TABLE 10 AVERAGE SELLING PRICE OF INSTRUMENTS USED IN CANNABIS TESTING, BY REGION (2019)
    6.5 STRATEGIC COLLABORATIONS AND PARTNERSHIPS IN THE GLOBAL MARKET
    6.6 IMPACT OF THE COVID-19 ON THE GLOBAL MARKET
    6.7 SUPPLY CHAIN ANALYSIS
    6.8 TECHNOLOGY ANALYSIS

7 CANNABIS TESTING MARKET, BY PRODUCT & SOFTWARE (Page No. - 73)
    7.1 INTRODUCTION
           TABLE 11 CANNABIS TESTING PRODUCT & SOFTWARE MARKET, 2018-2025 (USD MILLION)
    7.2 PRODUCTS
           TABLE 12 CANNABIS TESTING PRODUCTS MARKET, BY TYPE, 2018-2025 (USD MILLION)
           TABLE 13 CANNABIS TESTING PRODUCTS MARKET, BY REGION, 2018-2025 (USD MILLION)
           TABLE 14 NORTH AMERICA: CANNABIS TESTING PRODUCTS MARKET, BY COUNTRY, 2018-2025 (USD MILLION)
           7.2.1 ANALYTICAL INSTRUMENTS
           TABLE 15 CANNABIS TESTING ANALYTICAL INSTRUMENTS MARKET, BY TYPE, 2018-2025(USD MILLION)
           TABLE 16 CANNABIS TESTING ANALYTICAL INSTRUMENTS MARKET, BY REGION, 2018-2025 (USD MILLION)
                    7.2.1.1 Chromatography instruments
           TABLE 17 CANNABIS TESTING CHROMATOGRAPHY INSTRUMENTS MARKET, BY REGION, 2018-2025 (USD MILLION)
           TABLE 18 CANNABIS TESTING CHROMATOGRAPHY INSTRUMENTS MARKET, BY TYPE, 2018-2025 (USD MILLION)
                               7.2.1.1.1 Liquid chromatography
                                             7.2.1.1.1.1 This technique does not have the limitations of sample volatility and thermal stability, thereby having wider applications
           TABLE 19 LIQUID CHROMATOGRAPHY SYSTEM DIFFERENTIATION
           TABLE 20 LIQUID CHROMATOGRAPHY INSTRUMENTS MARKET, BY REGION, 2018-2025 (USD MILLION)
                               7.2.1.1.2 Gas chromatography
                                             7.2.1.1.2.1 The increasing adoption of gas chromatography for the separation of volatile organic compounds drives segment growth
           TABLE 21 COMMERCIALLY AVAILABLE GAS CHROMATOGRAPHY SYSTEMS
           TABLE 22 GAS CHROMATOGRAPHY INSTRUMENTS MARKET, BY REGION, 2018-2025 (USD MILLION)
                               7.2.1.1.3 Other chromatography instruments
                                             7.2.1.1.3.1 The adoption of other chromatography instruments over standard tools in emerging nations drives segment growth
           TABLE 23 OTHER CHROMATOGRAPHY INSTRUMENTS MARKET, BY REGION, 2018-2025 (USD MILLION)
                    7.2.1.2 Spectroscopy instruments
           TABLE 24 SPECTROSCOPY INSTRUMENTS MARKET, BY TYPE, 2018-2025 (USD MILLION)
           TABLE 25 SPECTROSCOPY INSTRUMENTS MARKET, BY REGION, 2018-2025 (USD MILLION)
                               7.2.1.2.1 Mass spectrometry instruments
                                             7.2.1.2.1.1 Prominent players in this market are focusing on launching new products to enhance their offerings in this segment
           TABLE 26 COMMERCIALLY AVAILABLE MASS SPECTROMETERS
           TABLE 27 MASS SPECTROMETRY INSTRUMENTS MARKET, BY REGION, 2020-2025 (USD MILLION)
                               7.2.1.2.2 Atomic spectroscopy instruments
                                             7.2.1.2.2.1 The increasing applications of atomic spectroscopy in cannabis testing is likely to drive the segmental growth
           TABLE 28 COMMERCIALLY AVAILABLE ATOMIC SPECTROSCOPY INSTRUMENTS
           TABLE 29 ATOMIC SPECTROSCOPY INSTRUMENTS MARKET, BY REGION, 2018-2025 (USD MILLION)
                    7.2.1.3 Other analytical instruments
           TABLE 30 OTHER ANALYTICAL INSTRUMENTS MARKET, BY REGION, 2018-2025 (USD MILLION)
           7.2.2 CONSUMABLES
           TABLE 31 CANNABIS TESTING CONSUMABLES MARKET, BY REGION, 2018-2025 (USD MILLION)
           TABLE 32 CANNABIS TESTING CONSUMABLES MARKET, BY TYPE, 2018-2025 (USD MILLION)
                    7.2.2.1 Chromatography columns
           TABLE 33 COMMERCIALLY AVAILABLE CHROMATOGRAPHY COLUMNS FOR CANNABIS TESTING
           TABLE 34 CHROMATOGRAPHY COLUMNS MARKET SIZE, BY REGION, 2018-2025 (USD MILLION)
                    7.2.2.2 Standards and CRMS
           TABLE 35 STANDARDS AND CRMS MARKET SIZE, BY REGION, 2018-2025 (USD MILLION)
                    7.2.2.3 Sample preparation products
           TABLE 36 SAMPLE PREPARATION PRODUCTS MARKET SIZE, BY REGION, 2018-2025 (USD MILLION)
                    7.2.2.4 Supplies and accessories
           TABLE 37 SUPPLIES AND ACCESSORIES MARKET SIZE, BY REGION, 2018-2025 (USD MILLION)
    7.3 CANNABIS TESTING SOFTWARE
           7.3.1 THE RISING ADOPTION OF LIMS BY CANNABIS TESTING LABORATORIES IS EXPECTED TO DRIVE THE GROWTH OF THE SOFTWARE SEGMENT
           TABLE 38 CANNABIS TESTING SOFTWARE MARKET, BY REGION, 2018-2025 (USD MILLION)

8 CANNABIS TESTING MARKET, BY SERVICE (Page No. - 92)
    8.1 INTRODUCTION
           FIGURE 17 THE POTENCY TESTING SEGMENT IS EXPECTED TO HOLD THE LARGEST SHARE OF THE CANNABIS TESTING SERVICES MARKET DURING THE FORECAST PERIOD
           TABLE 39 CANNABIS TESTING SERVICES MARKET SIZE, BY TYPE, 2018-2025 (USD MILLION)
    8.2 POTENCY TESTING
           8.2.1 THE INCREASING FOCUS ON THE LEGALIZATION OF MEDICAL CANNABIS IS EXPECTED TO DRIVE THE GROWTH OF THIS SERVICE SEGMENT
           TABLE 40 COMMERCIALLY AVAILABLE ANALYTICAL INSTRUMENTS FOR POTENCY TESTING
           TABLE 41 POTENCY TESTING SERVICES MARKET, BY REGION, 2018-2025 (USD MILLION)
           TABLE 42 NORTH AMERICA: POTENCY TESTING MARKET, BY COUNTRY, 2018-2025 (USD MILLION)
           TABLE 43 EUROPE: POTENCY TESTING MARKET, BY COUNTRY, 2018-2025 (USD MILLION)
           TABLE 44 ASIA PACIFIC: POTENCY TESTING MARKET, BY COUNTRY, 2018-2025 (USD MILLION)
    8.3 TERPENE PROFILING
           8.3.1 THE INCREASING USE OF CANNABIS IN HOMEOPATHY MEDICINE IS LIKELY TO PROPEL THE GROWTH OF THIS SEGMENT
           TABLE 45 COMMERCIALLY AVAILABLE INSTRUMENTS FOR TERPENE PROFILING
           TABLE 46 TERPENE PROFILING SERVICES MARKET, BY REGION, 2018-2025 (USD MILLION)
           TABLE 47 NORTH AMERICA: TERPENE PROFILING SERVICES MARKET, BY COUNTRY, 2018-2025 (USD MILLION)
           TABLE 48 EUROPE: TERPENE PROFILING SERVICES MARKET, BY COUNTRY, 2018-2025 (USD MILLION)
           TABLE 49 ASIA PACIFIC: TERPENE PROFILING MARKET, BY COUNTRY, 2018-2025 (USD MILLION)
    8.4 RESIDUAL SOLVENT ANALYSIS
           8.4.1 THE GROWING FOCUS OF PHARMA COMPANIES FOR THE USE OF MEDICAL CANNABIS IN DISEASE TREATMENT DRIVES SEGMENT GROWTH
           TABLE 50 RESIDUAL SOLVENT ANALYSIS MARKET, BY REGION, 2018-2025 (USD MILLION)
           TABLE 51 NORTH AMERICA: RESIDUAL SOLVENT ANALYSIS MARKET, BY COUNTRY, 2018-2025 (USD MILLION)
           TABLE 52 EUROPE: RESIDUAL SOLVENT ANALYSIS MARKET, BY COUNTRY, 2018-2025 (USD MILLION)
           TABLE 53 ASIA PACIFIC: RESIDUAL SOLVENT ANALYSIS MARKET, BY COUNTRY, 2018-2025 (USD MILLION)
    8.5 MICROBIAL ANALYSIS
           8.5.1 THE PRESENCE OF PATHOGENIC BACTERIA IN CANNABIS PLANTS IS A MAJOR FACTOR EXPECTED TO DRIVE THE GROWTH OF THE MICROBIAL ANALYSIS SEGMENT
           TABLE 54 MICROBIAL ANALYSIS MARKET SIZE, BY REGION, 2018-2025 (USD MILLION)
           TABLE 55 NORTH AMERICA: MICROBIAL ANALYSIS MARKET, BY COUNTRY, 2018-2025 (USD MILLION)
           TABLE 56 EUROPE: MICROBIAL ANALYSIS MARKET, BY COUNTRY, 2018-2025 (USD MILLION)
           TABLE 57 ASIA PACIFIC: MICROBIAL ANALYSIS MARKET, BY COUNTRY, 2018-2025 (USD MILLION)
    8.6 PESTICIDE SCREENING
           8.6.1 THE RISING REQUIREMENT TO ENSURE THAT MEDICAL CANNABIS IS PESTICIDE-FREE DRIVES THE GROWTH OF PESTICIDE SCREENING SERVICES
           TABLE 58 COMMERCIALLY AVAILABLE PRODUCTS FOR PESTICIDE SCREENING
           TABLE 59 PESTICIDE SCREENING MARKET SIZE, BY REGION, 2018-2025 (USD MILLION)
           TABLE 60 NORTH AMERICA: PESTICIDE SCREENING MARKET, BY COUNTRY, 2018-2025 (USD MILLION)
           TABLE 61 EUROPE: PESTICIDE SCREENING MARKET, BY COUNTRY, 2018-2025 (USD MILLION)
           TABLE 62 ASIA PACIFIC: PESTICIDE SCREENING MARKET, BY COUNTRY, 2018-2025 (USD MILLION)
    8.7 HEAVY METAL TESTING
           8.7.1 THE INTRODUCTION OF NOVEL INSTRUMENTS FOR HEAVY METAL TESTING IS LIKELY TO DRIVE SEGMENTAL GROWTH
           TABLE 63 COMMERCIALLY AVAILABLE INSTRUMENTS FOR HEAVY METAL TESTING
           TABLE 64 HEAVY METAL TESTING MARKET, BY REGION, 2018-2025 (USD MILLION)
           TABLE 65 NORTH AMERICA: HEAVY METAL TESTING MARKET, BY COUNTRY, 2018-2025 (USD MILLION)
           TABLE 66 EUROPE: HEAVY METAL TESTING MARKET, BY COUNTRY, 2018-2025 (USD MILLION)
           TABLE 67 ASIA PACIFIC: HEAVY METAL TESTING MARKET, BY COUNTRY, 2018-2025 (USD MILLION)
    8.8 OTHER SERVICES
           TABLE 68 OTHER SERVICES MARKET, BY REGION, 2018-2025 (USD MILLION)
           TABLE 69 NORTH AMERICA: OTHER SERVICES MARKET, BY COUNTRY, 2018-2025 (USD MILLION)
           TABLE 70 EUROPE: OTHERS SERVICES MARKET, BY COUNTRY, 2018-2025 (USD MILLION)
           TABLE 71 ASIA PACIFIC: OTHER SERVICES MARKET SIZE, BY COUNTRY, 2018-2025 (USD MILLION)

9 CANNABIS TESTING MARKET, BY END USER (Page No. - 109)
    9.1 INTRODUCTION
    9.2 PRODUCT & SOFTWARE
           TABLE 72 CANNABIS TESTING PRODUCTS & SOFTWARE MARKET, BY END USER, 2018-2025 (USD MILLION)
           9.2.1 CANNABIS TESTING LABORATORIES
           TABLE 73 CANNABIS TESTING LABORATORIES MARKET, BY REGION, 2018-2025 (USD MILLION)
           TABLE 74 NORTH AMERICA: CANNABIS TESTING LABORATORIES MARKET, BY COUNTRY, 2018-2025 (USD MILLION)
           TABLE 75 EUROPE: CANNABIS TESTING LABORATORIES MARKET, BY COUNTRY, 2018-2025 (USD MILLION)
           TABLE 76 ASIA PACIFIC: CANNABIS TESTING LABORATORIES MARKET, BY COUNTRY, 2018-2025 (USD MILLION)
           TABLE 77 CANNABIS TESTING LABORATORIES MARKET SIZE, BY TYPE, 2018-2025 (USD MILLION)
                    9.2.1.1 Small-scale laboratories
                               9.2.1.1.1 The increasing number of small-scale laboratories in developing markets drives growth
           TABLE 78 SMALL-SCALE LABORATORIES MARKET, BY REGION, 2018-2025 (USD MILLION)
                    9.2.1.2 Medium-scale laboratories
                               9.2.1.2.1 Strong government support for cannabis legalization and the growing need for analytical testing to drive segment growth
           TABLE 79 MEDIUM-SCALE LABORATORIES MARKET, BY REGION, 2018-2025 (USD MILLION)
                    9.2.1.3 Large-scale laboratories
                               9.2.1.3.1 Large-scale laboratories have the largest volume of test samples; key factor driving segment growth
           TABLE 80 LARGE-SCALE LABORATORIES MARKET, BY REGION, 2018-2025 (USD MILLION)
           9.2.2 RESEARCH INSTITUTES
                    9.2.2.1 The growing use of cannabis for medical purposes has stimulated the pace of R&D
           TABLE 81 NORTH AMERICA: RESEARCH INSTITUTES MARKET, BY COUNTRY, 2018-2025 (USD MILLION)
           TABLE 82 NORTH AMERICA: RESEARCH INSTITUTES MARKET, BY COUNTRY, 2018-2025 (USD MILLION)
           TABLE 83 EUROPE: RESEARCH INSTITUTES MARKET, BY COUNTRY, 2018-2025 (USD MILLION)
           TABLE 84 ASIA PACIFIC: RESEARCH INSTITUTES MARKET, BY COUNTRY, 2018-2025 (USD MILLION)
    9.3 SERVICES
           TABLE 85 CANNABIS TESTING SERVICES MARKET, BY END USER, 2018-2025 (USD MILLION)
           9.3.1 CANNABIS DRUG MANUFACTURERS & DISPENSARIES
                    9.3.1.1 The growth of this segment is mainly driven by regulatory guidelines mandating cannabis testing
           TABLE 86 CANNABIS DRUG MANUFACTURERS & DISPENSARIES MARKET, BY REGION, 2018-2025 (USD MILLION)
           9.3.2 CANNABIS CULTIVATORS/GROWERS
                    9.3.2.1 The rising awareness for cannabis testing among cultivators is expected to drive the growth of this segment
           TABLE 87 CANNABIS CULTIVATORS/GROWERS MARKET SIZE, BY REGION, 2018-2025 (USD MILLION)

10 CANNABIS TESTING MARKET, BY REGION (Page No. - 120)
     10.1 INTRODUCTION
           FIGURE 18 CANNABIS TESTING MARKET, BY REGION, 2020 VS. 2025 (USD MILLION)
           TABLE 88 GLOBAL MARKET, BY REGION, 2018–2025 (USD MILLION)
     10.2 NORTH AMERICA
           FIGURE 19 NORTH AMERICA: CANNABIS TESTING MARKET SNAPSHOT
           TABLE 89 NORTH AMERICA: MARKET, BY COUNTRY, 2018–2025 (USD MILLION)
           TABLE 90 NORTH AMERICA: MARKET, BY COMPONENT, 2018–2025 (USD MILLION)
           TABLE 91 NORTH AMERICA: CANNABIS TESTING PRODUCTS MARKET, BY PRODUCT, 2018–2025 (USD MILLION)
           TABLE 92 NORTH AMERICA: CANNABIS TESTING ANALYTICAL INSTRUMENTS MARKET, BY TYPE, 2018–2025 (USD MILLION)
           TABLE 93 NORTH AMERICA: CHROMATOGRAPHY INSTRUMENTS MARKET, BY TYPE, 2018–2025 (USD MILLION)
           TABLE 94 NORTH AMERICA: SPECTROSCOPY INSTRUMENTS MARKET, BY TYPE, 2018–2025 (USD MILLION)
           TABLE 95 NORTH AMERICA: CANNABIS TESTING CONSUMABLES MARKET, BY TYPE, 2018–2025 (USD MILLION)
           TABLE 96 NORTH AMERICA: CANNABIS TESTING SERVICES MARKET, BY TYPE, 2018–2025 (USD MILLION)
           TABLE 97 NORTH AMERICA: CANNABIS TESTING PRODUCTS & SOFTWARE MARKET, BY END USER, 2018–2025 (USD MILLION)
           TABLE 98 NORTH AMERICA: CANNABIS TESTING LABORATORIES MARKET, BY TYPE, 2018–2025 (USD MILLION)
           TABLE 99 NORTH AMERICA: CANNABIS TESTING SERVICES MARKET, BY END USER, 2018–2025 (USD MILLION)
             10.2.1 US
                        10.2.1.1 The US is the largest market for cannabis testing
           TABLE 100 US: CANNABIS TESTING MARKET, BY COMPONENT, 2018–2025 (USD MILLION)
           TABLE 101 US: CANNABIS TESTING PRODUCTS MARKET, BY TYPE, 2018–2025 (USD MILLION)
           TABLE 102 US: CANNABIS TESTING ANALYTICAL INSTRUMENTS MARKET, BY TYPE, 2018–2025 (USD MILLION)
           TABLE 103 US: CHROMATOGRAPHY INSTRUMENTS MARKET, BY TYPE, 2018–2025 (USD MILLION)
           TABLE 104 US: SPECTROSCOPY INSTRUMENTS MARKET, BY TYPE, 2018–2025 (USD MILLION)
           TABLE 105 US: CANNABIS TESTING CONSUMABLES MARKET, BY TYPE, 2018–2025 (USD MILLION)
           TABLE 106 US: CANNABIS TESTING SERVICES MARKET, BY TYPE, 2018–2025 (USD MILLION)
           TABLE 107 US: CANNABIS TESTING PRODUCTS & SOFTWARE MARKET, BY END USER, 2018–2025 (USD MILLION)
           TABLE 108 US: CANNABIS TESTING LABORATORIES MARKET, BY TYPE, 2018–2025 (USD MILLION)
           TABLE 109 US: CANNABIS TESTING SERVICES MARKET, BY END USER, 2018–2025 (USD MILLION)
             10.2.2 CANADA
                        10.2.2.1 Growing collaborations and agreements between stakeholders to increase the demand for cannabis testing in Canada
           TABLE 110 CANADA: CANNABIS TESTING MARKET, BY COMPONENT, 2018–2025 (USD MILLION)
           TABLE 111 CANADA: CANNABIS TESTING PRODUCTS MARKET, BY TYPE, 2018–2025 (USD MILLION)
           TABLE 112 CANADA: CANNABIS TESTING ANALYTICAL INSTRUMENTS MARKET, BY TYPE, 2018–2025 (USD MILLION)
           TABLE 113 CANADA: CHROMATOGRAPHY INSTRUMENTS MARKET, BY TYPE, 2018–2025 (USD MILLION)
           TABLE 114 CANADA: SPECTROSCOPY INSTRUMENTS MARKET, BY TYPE, 2018–2025 (USD MILLION)
           TABLE 115 CANADA: CANNABIS TESTING CONSUMABLES MARKET, BY TYPE, 2018–2025 (USD MILLION)
           TABLE 116 CANADA: CANNABIS TESTING SERVICES MARKET, BY TYPE, 2018–2025 (USD MILLION)
           TABLE 117 CANADA: CANNABIS TESTING PRODUCTS & SOFTWARE MARKET, BY END USER, 2018–2025 (USD MILLION)
           TABLE 118 CANADA: CANNABIS TESTING LABORATORIES MARKET, BY TYPE, 2018–2025 (USD MILLION)
           TABLE 119 CANADA: CANNABIS TESTING SERVICES MARKET, BY END USER, 2018–2025 (USD MILLION)
     10.3 EUROPE
           TABLE 120 EUROPE: CANNABIS TESTING MARKET, BY COUNTRY, 2018–2025 (USD MILLION)
           TABLE 121 EUROPE: MARKET, BY COMPONENT, 2018–2025 (USD MILLION)
           TABLE 122 EUROPE: CANNABIS TESTING PRODUCTS MARKET, BY TYPE, 2018–2025 (USD MILLION)
           TABLE 123 EUROPE: CANNABIS TESTING ANALYTICAL INSTRUMENTS MARKET, BY TYPE, 2018–2025 (USD MILLION)
           TABLE 124 EUROPE: CHROMATOGRAPHY INSTRUMENTS MARKET, BY TYPE, 2018–2025 (USD MILLION)
           TABLE 125 EUROPE: SPECTROSCOPY INSTRUMENTS MARKET, BY TYPE, 2018–2025 (USD MILLION)
           TABLE 126 EUROPE: CANNABIS TESTING CONSUMABLES MARKET, BY TYPE, 2018–2025 (USD MILLION)
           TABLE 127 EUROPE: CANNABIS TESTING SERVICES MARKET, BY TYPE, 2018–2025 (USD MILLION)
           TABLE 128 EUROPE: CANNABIS TESTING PRODUCTS & SOFTWARE MARKET, BY END USER, 2018–2025 (USD MILLION)
           TABLE 129 EUROPE: CANNABIS TESTING LABORATORIES MARKET, BY TYPE, 2018–2025 (USD MILLION)
           TABLE 130 EUROPE: CANNABIS TESTING SERVICES MARKET, BY END USER, 2018–2025 (USD MILLION)
             10.3.1 GERMANY
                        10.3.1.1 The use of cannabis is legal in Germany for limited medical contexts
           TABLE 131 GERMANY: CANNABIS TESTING MARKET, BY COMPONENT, 2018–2025 (USD MILLION)
           TABLE 132 GERMANY: CANNABIS TESTING PRODUCTS MARKET, BY TYPE, 2018–2025 (USD MILLION)
           TABLE 133 GERMANY: CANNABIS TESTING ANALYTICAL INSTRUMENTS MARKET, BY TYPE, 2018–2025 (USD MILLION)
           TABLE 134 GERMANY: CHROMATOGRAPHY INSTRUMENTS MARKET, BY TYPE, 2018–2025 (USD MILLION)
           TABLE 135 GERMANY: SPECTROSCOPY INSTRUMENTS MARKET, BY TYPE, 2018–2025 (USD MILLION)
           TABLE 136 GERMANY: CANNABIS TESTING CONSUMABLES MARKET, BY TYPE, 2018–2025 (USD MILLION)
           TABLE 137 GERMANY: CANNABIS TESTING SERVICES MARKET, BY TYPE, 2018–2025 (USD MILLION)
           TABLE 138 GERMANY: CANNABIS TESTING PRODUCTS & SOFTWARE MARKET, BY END USER, 2018–2025 (USD MILLION)
           TABLE 139 GERMANY: CANNABIS TESTING LABORATORIES MARKET, BY TYPE, 2018–2025 (USD MILLION)
           TABLE 140 GERMANY: CANNABIS TESTING SERVICES MARKET, BY END USER, 2018–2025 (USD MILLION)
             10.3.2 UK
                        10.3.2.1 Increasing focus on medical cannabis to support market growth in the UK
           TABLE 141 UK: CANNABIS TESTING MARKET, BY COMPONENT, 2018–2025 (USD MILLION)
           TABLE 142 UK: CANNABIS TESTING PRODUCTS MARKET, BY TYPE, 2018–2025 (USD MILLION)
           TABLE 143 UK: CANNABIS TESTING ANALYTICAL INSTRUMENTS MARKET, BY TYPE, 2018–2025 (USD MILLION)
           TABLE 144 UK: CHROMATOGRAPHY INSTRUMENTS MARKET, BY TYPE, 2018–2025 (USD MILLION)
           TABLE 145 UK: SPECTROSCOPY INSTRUMENTS MARKET, BY TYPE, 2018–2025 (USD MILLION)
           TABLE 146 UK: CANNABIS TESTING CONSUMABLES MARKET, BY TYPE, 2018–2025 (USD MILLION)
           TABLE 147 UK: CANNABIS TESTING SERVICES MARKET, BY TYPE, 2018–2025 (USD MILLION)
           TABLE 148 UK: CANNABIS TESTING PRODUCTS & SOFTWARE MARKET, BY END USER, 2018–2025 (USD MILLION)
           TABLE 149 UK: CANNABIS TESTING LABORATORIES MARKET, BY TYPE, 2018–2025 (USD MILLION)
           TABLE 150 UK: CANNABIS TESTING SERVICES MARKET, BY END USER, 2018–2025 (USD MILLION)
             10.3.3 FRANCE
                        10.3.3.1 Limited types of cannabis-derived products are permitted for medical use in France
           TABLE 151 FRANCE: CANNABIS TESTING MARKET, BY COMPONENT, 2018–2025 (USD MILLION)
           TABLE 152 FRANCE: CANNABIS TESTING PRODUCTS MARKET, BY TYPE, 2018–2025 (USD MILLION)
           TABLE 153 FRANCE: CANNABIS TESTING ANALYTICAL INSTRUMENTS MARKET, BY TYPE, 2018–2025 (USD MILLION)
           TABLE 154 FRANCE: CHROMATOGRAPHY INSTRUMENTS MARKET, BY TYPE, 2018–2025 (USD MILLION)
           TABLE 155 FRANCE: SPECTROSCOPY INSTRUMENTS MARKET, BY TYPE, 2018–2025 (USD MILLION)
           TABLE 156 FRANCE: CANNABIS TESTING CONSUMABLES MARKET, BY TYPE, 2018–2025 (USD MILLION)
           TABLE 157 FRANCE: CANNABIS TESTING SERVICES MARKET, BY TYPE, 2018–2025 (USD MILLION)
           TABLE 158 FRANCE: CANNABIS TESTING PRODUCTS & SOFTWARE MARKET, BY END USER, 2018–2025 (USD MILLION)
           TABLE 159 FRANCE: CANNABIS TESTING LABORATORIES MARKET, BY TYPE, 2018–2025 (USD MILLION)
           TABLE 160 FRANCE: CANNABIS TESTING SERVICES MARKET, BY END USER, 2018–2025 (USD MILLION)
             10.3.4 REST OF EUROPE
           TABLE 161 ROE: CANNABIS TESTING MARKET, BY COMPONENT, 2018–2025 (USD MILLION)
           TABLE 162 ROE: CANNABIS TESTING PRODUCTS MARKET, BY TYPE, 2018–2025 (USD MILLION)
           TABLE 163 ROE: CANNABIS TESTING ANALYTICAL INSTRUMENTS MARKET, BY TYPE, 2018–2025 (USD MILLION)
           TABLE 164 ROE: CHROMATOGRAPHY INSTRUMENTS MARKET, BY TYPE, 2018–2025 (USD MILLION)
           TABLE 165 ROE: SPECTROSCOPY INSTRUMENTS MARKET, BY TYPE, 2018–2025 (USD MILLION)
           TABLE 166 ROE: CANNABIS TESTING CONSUMABLES MARKET, BY TYPE, 2018–2025 (USD MILLION)
           TABLE 167 ROE: CANNABIS TESTING SERVICES MARKET, BY TYPE, 2018–2025 (USD MILLION)
           TABLE 168 ROE: CANNABIS TESTING PRODUCTS & SOFTWARE MARKET, BY END USER, 2018–2025 (USD MILLION)
           TABLE 169 ROE: CANNABIS TESTING LABORATORIES MARKET, BY TYPE, 2018–2025 (USD MILLION)
           TABLE 170 ROE: CANNABIS TESTING SERVICES MARKET, BY END USER, 2018–2025 (USD MILLION)
     10.4 ASIA PACIFIC
           FIGURE 20 APAC: CANNABIS TESTING MARKET SNAPSHOT (2020)
           TABLE 171 APAC: MARKET, BY COUNTRY, 2018–2025 (USD THOUSAND)
           TABLE 172 APAC: MARKET, BY COMPONENT, 2018–2025 (USD THOUSAND)
           TABLE 173 APAC: CANNABIS TESTING PRODUCTS MARKET, BY TYPE, 2018–2025 (USD THOUSAND)
           TABLE 174 APAC: CANNABIS TESTING ANALYTICAL INSTRUMENTS MARKET, BY TYPE, 2018–2025 (USD THOUSAND)
           TABLE 175 APAC: CHROMATOGRAPHY INSTRUMENTS MARKET, BY TYPE, 2018–2025 (USD THOUSAND)
           TABLE 176 APAC: SPECTROSCOPY INSTRUMENTS MARKET, BY TYPE, 2018–2025 (USD THOUSAND)
           TABLE 177 APAC: CANNABIS TESTING CONSUMABLES MARKET, BY TYPE, 2018–2025 (USD THOUSAND)
           TABLE 178 APAC: CANNABIS TESTING SERVICES MARKET, BY TYPE, 2018–2025 (USD THOUSAND)
           TABLE 179 APAC: CANNABIS TESTING PRODUCTS & SOFTWARE MARKET, BY END USER, 2018–2025 (USD THOUSAND)
           TABLE 180 APAC: CANNABIS TESTING LABORATORIES MARKET, BY TYPE, 2018–2025 (USD THOUSAND)
           TABLE 181 APAC: CANNABIS TESTING SERVICES MARKET, BY END USER, 2018–2025 (USD THOUSAND)
             10.4.1 CHINA
                        10.4.1.1 China is one of the world’s largest cannabis producers
           TABLE 182 CHINA: CANNABIS TESTING MARKET, BY COMPONENT, 2018–2025 (USD MILLION)
           TABLE 183 CHINA: CANNABIS TESTING PRODUCTS MARKET, BY TYPE, 2018–2025 (USD MILLION)
           TABLE 184 CHINA: CANNABIS TESTING ANALYTICAL INSTRUMENTS MARKET, BY TYPE, 2018–2025 (USD MILLION)
           TABLE 185 CHINA: CHROMATOGRAPHY INSTRUMENTS MARKET, BY TYPE, 2018–2025 (USD MILLION)
           TABLE 186 CHINA: SPECTROSCOPY INSTRUMENTS MARKET, BY TYPE, 2018–2025 (USD MILLION)
           TABLE 187 CHINA: CANNABIS TESTING CONSUMABLES MARKET, BY TYPE, 2018–2025 (USD MILLION)
           TABLE 188 CHINA: CANNABIS TESTING SERVICES MARKET, BY TYPE, 2018–2025 (USD MILLION)
           TABLE 189 CHINA: CANNABIS TESTING PRODUCTS & SOFTWARE MARKET, BY END USER, 2018–2025 (USD MILLION)
           TABLE 190 CHINA: CANNABIS TESTING LABORATORIES MARKET, BY TYPE, 2018–2025 (USD MILLION)
           TABLE 191 CHINA: CANNABIS TESTING SERVICES MARKET, BY END USER, 2018–2025 (USD MILLION)
             10.4.2 JAPAN
                        10.4.2.1 Japan has strict laws for marijuana but is expected to see rising demand for cannabis testing
           TABLE 192 JAPAN: CANNABIS TESTING MARKET, BY COMPONENT, 2018–2025 (USD MILLION)
           TABLE 193 JAPAN: CANNABIS TESTING PRODUCTS MARKET, BY TYPE, 2018–2025 (USD MILLION)
           TABLE 194 JAPAN: CANNABIS TESTING ANALYTICAL INSTRUMENTS MARKET, BY TYPE, 2018–2025 (USD MILLION)
           TABLE 195 JAPAN: CHROMATOGRAPHY INSTRUMENTS MARKET, BY TYPE, 2018–2025 (USD MILLION)
           TABLE 196 JAPAN: SPECTROSCOPY INSTRUMENTS MARKET, BY TYPE, 2018–2025 (USD MILLION)
           TABLE 197 JAPAN: CANNABIS TESTING CONSUMABLES MARKET, BY TYPE, 2018–2025 (USD MILLION)
           TABLE 198 JAPAN: CANNABIS TESTING SERVICES MARKET, BY TYPE, 2018–2025 (USD MILLION)
           TABLE 199 JAPAN: CANNABIS TESTING PRODUCTS & SOFTWARE MARKET, BY END USER, 2018–2025 (USD MILLION)
           TABLE 200 JAPAN: CANNABIS TESTING LABORATORIES MARKET, BY TYPE, 2018–2025 (USD MILLION)
           TABLE 201 JAPAN: CANNABIS TESTING SERVICES MARKET, BY END USER, 2018–2025 (USD MILLION)
             10.4.3 REST OF APAC
           TABLE 202 ROAPAC: CANNABIS TESTING MARKET, BY COMPONENT, 2018–2025 (USD MILLION)
           TABLE 203 ROAPAC: CANNABIS TESTING PRODUCTS MARKET, BY TYPE, 2018–2025 (USD MILLION)
           TABLE 204 ROAPAC: CANNABIS TESTING ANALYTICAL INSTRUMENTS MARKET, BY TYPE, 2018–2025 (USD MILLION)
           TABLE 205 ROAPAC: CHROMATOGRAPHY INSTRUMENTS MARKET, BY TYPE, 2018–2025 (USD MILLION)
           TABLE 206 ROAPAC: SPECTROSCOPY INSTRUMENTS MARKET, BY TYPE, 2018–2025 (USD MILLION)
           TABLE 207 ROAPAC: CANNABIS TESTING CONSUMABLES MARKET, BY TYPE, 2018–2025 (USD MILLION)
           TABLE 208 ROAPAC: CANNABIS TESTING SERVICES MARKET, BY TYPE, 2018–2025 (USD MILLION)
           TABLE 209 ROAPAC: CANNABIS TESTING PRODUCTS & SOFTWARE MARKET, BY END USER, 2018–2025 (USD MILLION)
           TABLE 210 ROAPAC: CANNABIS TESTING LABORATORIES MARKET, BY TYPE, 2018–2025 (USD MILLION)
           TABLE 211 ROAPAC: CANNABIS TESTING SERVICES MARKET, BY END USER, 2018–2025 (USD MILLION)
     10.5 LATIN AMERICA
             10.5.1 RISING RESEARCH AND FAVORABLE CONDITIONS FOR CROP GROWTH DRIVE THE MARKET IN LATIN AMERICA
           TABLE 212 LATAM: CANNABIS TESTING MARKET, BY COMPONENT, 2018–2025 (USD THOUSAND)
           TABLE 213 LATAM: CANNABIS TESTING PRODUCTS MARKET, BY TYPE, 2018–2025 (USD THOUSAND)
           TABLE 214 LATAM: CANNABIS TESTING ANALYTICAL INSTRUMENTS MARKET, BY TYPE, 2018–2025 (USD THOUSAND)
           TABLE 215 LATAM: CHROMATOGRAPHY INSTRUMENTS MARKET, BY TYPE, 2018–2025 (USD THOUSAND)
           TABLE 216 LATAM: SPECTROSCOPY INSTRUMENTS MARKET, BY TYPE, 2018–2025 (USD THOUSAND)
           TABLE 217 LATAM: CANNABIS TESTING CONSUMABLES MARKET, BY TYPE, 2018–2025 (USD THOUSAND)
           TABLE 218 LATAM: CANNABIS TESTING SERVICES MARKET, BY TYPE, 2018–2025 (USD THOUSAND)
           TABLE 219 LATAM: CANNABIS TESTING PRODUCTS & SOFTWARE MARKET, BY END USER, 2018–2025 (USD THOUSAND)
           TABLE 220 LATAM: CANNABIS TESTING LABORATORIES MARKET, BY TYPE, 2018–2025 (USD THOUSAND)
           TABLE 221 LATAM: CANNABIS TESTING SERVICES MARKET, BY END USER, 2018–2025 (USD THOUSAND)
     10.6 MIDDLE EAST AND AFRICA
             10.6.1 MEA MARKET TO GROW AT A SLOW PACE DURING THE FORECAST PERIOD
           TABLE 222 MEA: CANNABIS TESTING MARKET, BY COMPONENT, 2018–2025 (USD THOUSAND)
           TABLE 223 MEA: CANNABIS TESTING PRODUCTS MARKET, BY TYPE, 2018–2025 (USD THOUSAND)
           TABLE 224 MEA: CANNABIS TESTING ANALYTICAL INSTRUMENTS MARKET, BY TYPE, 2018–2025 (USD THOUSAND)
           TABLE 225 MEA: CHROMATOGRAPHY INSTRUMENTS MARKET, BY TYPE, 2018–2025 (USD THOUSAND)
           TABLE 226 MEA: SPECTROSCOPY INSTRUMENTS MARKET, BY TYPE, 2018–2025 (USD THOUSAND)
           TABLE 227 MEA: CANNABIS TESTING CONSUMABLES MARKET, BY TYPE, 2018–2025 (USD THOUSAND)
           TABLE 228 MEA: CANNABIS TESTING SERVICES MARKET, BY TYPE, 2018–2025 (USD THOUSAND)
           TABLE 229 MEA: CANNABIS TESTING PRODUCTS & SOFTWARE MARKET, BY END USER, 2018–2025 (USD THOUSAND)
           TABLE 230 MEA: CANNABIS TESTING LABORATORIES MARKET, BY TYPE, 2018–2025 (USD THOUSAND)
           TABLE 231 MEA: CANNABIS TESTING SERVICES MARKET, BY END USER, 2018–2025 (USD THOUSAND)

11 COMPETITIVE LANDSCAPE (Page No. - 180)
     11.1 OVERVIEW
           FIGURE 21 MARKET EVALUATION FRAMEWORK
     11.2 RIGHT-TO-WIN APPROACHES ADOPTED BY KEY MARKET PLAYERS
     11.3 MARKET SHARE ANALYSIS
           FIGURE 22 CANNABIS TESTING MARKET SHARE ANALYSIS (PRODUCTS & SOFTWARE), BY KEY PLAYER, 2019
             11.3.1 GLOBAL MARKET SHARE ANALYSIS (SERVICE PROVIDERS), BY KEY PLAYER, 2019
           TABLE 232 TOP MARKET PLAYERS: CANNABIS TESTING SERVICES MARKET (2019)
     11.4 KEY MARKET DEVELOPMENTS
             11.4.1 KEY PRODUCT LAUNCHES
             11.4.2 KEY MERGERS & ACQUISITIONS
             11.4.3 KEY PARTNERSHIPS, AGREEMENTS, AND COLLABORATIONS
             11.4.4 EXPANSIONS
     11.5 GLOBAL MARKET: COMPANY EVALUATION MATRIX, 2019
             11.5.1 STARS
             11.5.2 EMERGING LEADERS
             11.5.3 PERVASIVE PLAYERS
             11.5.4 PARTICIPANTS
           FIGURE 23 GLOBAL MARKET (PRODUCTS & SOFTWARE): COMPANY EVALUATION MATRIX, 2019

12 COMPANY PROFILES (Page No. - 188)
(Business overview, Products offered, Recent developments, MNM view)* 
     12.1 AGILENT TECHNOLOGIES
           FIGURE 24 AGILENT TECHNOLOGIES: COMPANY SNAPSHOT (2019)
     12.2 SHIMADZU CORPORATION
           FIGURE 25 SHIMADZU CORPORATION: COMPANY SNAPSHOT (2019)
           TABLE 233 EXCHANGE RATES (UTILIZED FOR THE CONVERSION OF YEN TO USD)
     12.3 THERMO FISHER SCIENTIFIC
           FIGURE 26 THERMO FISHER SCIENTIFIC: COMPANY SNAPSHOT (2019)
     12.4 MERCK KGAA
           FIGURE 27 MERCK KGAA: COMPANY SNAPSHOT (2019)
           TABLE 234 EXCHANGE RATES (UTILIZED FOR CONVERSION OF EUR TO USD)
     12.5 RESTEK CORPORATION
     12.6 PERKINELMER
           FIGURE 28 PERKINELMER: COMPANY SNAPSHOT (2019)
     12.7 DANAHER CORPORATION
           FIGURE 29 DANAHER CORPORATION: COMPANY SNAPSHOT (2019)
     12.8 WATERS CORPORATION
           FIGURE 30 WATERS CORPORATION: COMPANY SNAPSHOT (2019)
     12.9 HAMILTON COMPANY
     12.10 DIGIPATH
           FIGURE 31 DIGIPATH: COMPANY SNAPSHOT (2019)
     12.11 SGS SA
           FIGURE 32 SGS SA: COMPANY SNAPSHOT (2019)
     12.12 STEEP HILL
     12.13 SC (SCIENCE OF CANNABIS) LABORATORIES
     12.14 PHARMLABS LLC
     12.15 CANMEDLABS
     12.16 CALIFORNIA CANNABIS TESTING LABS
     12.17 PROVERDE LABORATORIES
     12.18 GREEN LEAF LAB
     12.19 KAYCHA HOLDINGS LLC D/B/A KAYCHA LABS
     12.20 AGRICOR LABORATORIES
     12.21 ACCELERATED TECHNOLOGY LABORATORIES
     12.22 CLOUDLIMS
     12.23 LABWARE
     12.24 AUTOSCRIBE INFORMATICS
     12.25 LABLYNX LIMS
*Business overview, Products offered, Recent developments, SWOT analysis, MNM view might not be captured in case of unlisted companies. 

13 APPENDIX (Page No. - 238)
     13.1 DISCUSSION GUIDE
     13.2 KNOWLEDGE STORE: MARKETSANDMARKETS’ SUBSCRIPTION PORTAL
     13.3 AVAILABLE CUSTOMIZATIONS
     13.4 RELATED REPORTS
     13.5 AUTHOR DETAILS


Research approach

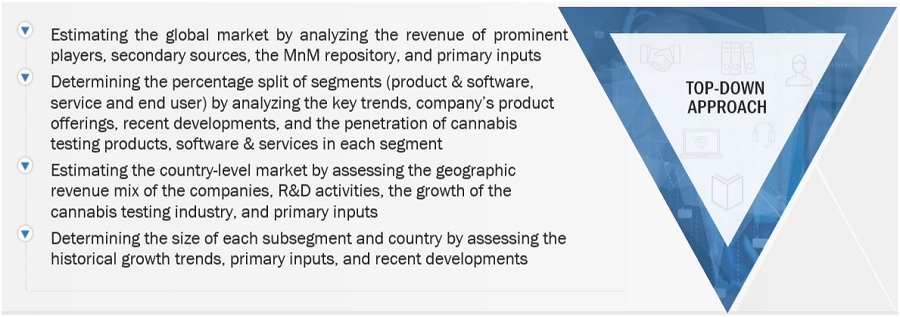
This market research study involves the extensive use of secondary sources, directories, and databases to identify and collect information useful for this technical, market-oriented, and financial study of the global cannabis testing market. In-depth interviews were conducted with various primary respondents, including key industry participants, subject-matter experts (SMEs), C-level executives of key market players, scientists & research scholars, and industry consultants, among other experts, to obtain and verify critical qualitative and quantitative information and to assess market growth prospects. The global size of the cannabis testing market (estimated through various secondary research approaches) was then triangulated with inputs from primary research to arrive at the final market size.

Secondary Data

The secondary sources referred to for this research study include publications from government sources, such as the Annual Reports, SEC Filings, Investor Presentations, International Cannabis and Cannabinoids Institute (ICCI), Association of Commercial Cannabis Laboratories (ACCL), American Medical Marijuana Association (AMMA), California Cannabis Industry Association (CCIA), Oregon Cannabis Association (OCA), Canadian National Medical Marijuana Association (CNMMA), World Health Organization (WHO), National Institutes of Health (NIH), National Center for Complementary and Integrative Health (NCCIH), American Oil Chemists' Society (AOCS), Association of Public Health Laboratories (APHL), American Association for Clinical Chemistry (AACC), National Center for Biotechnology Information (NCBI), BioPharm International, EvaluatePharma, ScienceDirect, News Articles, Journals, Press Releases, Paid Databases, Expert Interviews, and MarketsandMarkets Analysis.

Secondary sources also include corporate and regulatory filings (such as annual reports, SEC filings, investor presentations, and financial statements); business magazines and research journals; press releases; and trade, business, and professional associations, among others. Secondary data was collected and analyzed to arrive at the overall size of the global cannabis testing market, which was validated through primary research.

Primary Data

Extensive primary research was conducted after acquiring basic knowledge about the global cannabis testing market scenario through secondary research. Several primary interviews were conducted with market experts from both the demand side (such as personnel from pharmaceutical & biotechnology companies and academic & research institutes as well as purchase managers in healthcare provider organizations) and the supply side (such as C-level and D-level executives, product managers, and marketing and sales managers of key manufacturers, distributors, service providers, and channel partners, among others) across five major regions—North America, Europe, Asia Pacific, Latin America, and the Middle East & Africa. Approximately 50% and 50% of primary interviews were conducted with supply-side and demand-side participants, respectively. This primary data was collected through questionnaires, e-mails, online surveys, personal interviews, and telephonic interviews.


Primary research was used in this report to:

  • Validate the market segmentation defined through product portfolio assessment of leading players in the cannabis testing market
  • Understand key industry trends and issues defining the strategic growth objectives of market players
  • Gather both demand- and supply-side validation of key factors affecting the market growth (such as market drivers, challenges, and opportunities)
  • Validate assumptions for the market sizing and forecasting model used for this study
  • Understand the market position of leading players in the spatial genomics & trancriptomics market and their market share/ranking

Cannabis Testing Market  Size, and Share

To know about the assumptions considered for the study, download the pdf brochure

Data Triangulation

After arriving at the overall market size, from the market size estimation process explained above, the cannabis testing market was split into segments and subsegments. To complete the overall market engineering process and to arrive at the exact statistics for all segments and subsegments, the data triangulation and market breakdown procedures were employed, wherever applicable. The data was triangulated by studying various factors and trends from both the demand and supply sides in the  cannabis testing market

Report Objectives

  • To define, describe, segment, and forecast the cannabis testing market on the basis of product & software, services, end user, and region
  • To provide detailed information about the factors influencing market growth, such as drivers, restraints, opportunities, and challenges
  • To strategically analyze micromarkets1 with respect to individual growth trends, prospects, and contributions to the overall cannabis testing market
  • To analyze market opportunities for stakeholders and provide details of the competitive landscape for key players
  • To forecast the size of the market segments concerning five main regions, namely, North America, Europe, the Asia Pacific (APAC), Latin America (LATAM), and the Middle East & Africa (MEA)
  • To strategically profile the key players in the global cannabis testing market and comprehensively analyze their core competencies2 and market rankings
  • To track and analyze competitive developments, such as product launches, acquisitions, collaborations, expansions, and partnerships in the cannabis testing market

Available Customizations:

With the given market data, MarketsandMarkets offers customizations as per the company’s specific needs. The following customization options are available for the report:

Geographical Analysis

  • Further breakdown of the European cannabis testing market into countries from the Rest of Europe segment.
  • Further breakdown of the Asia Pacific cannabis testing market into countries from the Rest of the APAC segment.
  • Further breakdown of Latin America and the Middle East & Africa cannabis testing market into countries.

Company Information

Detailed analysis and profiling of additional market players (up to 5) inclusive of:

  • Business Overview
  • Financial Information
  • Product Offered
  • Developments (Last three years)
Custom Market Research Services

We will customize the research for you, in case the report listed above does not meet with your exact requirements. Our custom research will comprehensively cover the business information you require to help you arrive at strategic and profitable business decisions.

Request Customization

Instant Answers with GPT - Ask Now!

Ask real questions. Get complete answers !
Report Code
BT 5107
Published ON
Jan, 2021
Choose License Type
BUY NOW
  • SHARE
X
Request Customization
Speak to Analyst
Speak to Analyst
OR FACE-TO-FACE MEETING
PERSONALIZE THIS RESEARCH
  • Triangulate with your Own Data
  • Get Data as per your Format and Definition
  • Gain a Deeper Dive on a Specific Application, Geography, Customer or Competitor
  • Any level of Personalization
REQUEST A FREE CUSTOMIZATION
LET US HELP YOU!
  • What are the Known and Unknown Adjacencies Impacting the Cannabis Testing Market
  • What will your New Revenue Sources be?
  • Who will be your Top Customer; what will make them switch?
  • Defend your Market Share or Win Competitors
  • Get a Scorecard for Target Partners
CUSTOMIZED WORKSHOP REQUEST
+1-888-600-6441
  • Call Us
  • +1-888-600-6441 (Corporate office hours)
  • +1-888-600-6441 (US/Can toll free)
  • +44-800-368-9399 (UK office hours)
CONNECT WITH US
ABOUT TRUST ONLINE
©2024 MarketsandMarkets Research Private Ltd. All rights reserved
DMCA.com Protection Status Website Feedback