Drug Screening Market by Product (Consumables, Urine Testing Devices, Analytical, Breathalyzer, Chromatography, Immunoassay) & Services, Sample Type (Urine, Breath), End User (Workplace, Laboratories, Criminal Justice, Hospitals) - Global Forecast to 2026
The global drug screening market in terms of revenue was estimated to be worth $5.3 billion in 2021 and is poised to reach $11.6 billion by 2026, growing at a CAGR of 16.8% from 2021 to 2026. The new research study consists of an industry trend analysis of the market. The new research study consists of industry trends, pricing analysis, patent analysis, conference and webinar materials, key stakeholders, and buying behaviour in the market. Growth in this market is attributed to the growing drug & alcohol consumption and the enforcement of stringent laws mandating drug & alcohol testing, rising regulatory approvals for drug screening products & services. On the other hand, bans on alcohol consumption in Islamic countries and prohibitions on workplace drug testing in specific countries may hinder the growth of this market to a certain extent.
To know about the assumptions considered for the study, Request for Free Sample Report
Drug Screening Market Dynamics
DRIVER: Growing drug and alcohol consumption
Drug abuse and alcohol consumption are increasing worldwide. According to the World Drug Report 2021, in 2019, an estimated 275 million people worldwide aged 15–64, or 1 in every 18 people in that age group, have used drugs at least once in the previous year (range: 175 million to 374 million. In 2019, 36.3 million people, or almost 13% of the global population, were estimated to be suffering from drug use disorders. In the same year, drug use killed almost half a million people, while drug use disorders resulted in 18 million years of healthy life lost, mainly due to opioids Alcohol consumption has shown similar increases, with consequences witnessed in the rising incidence of impaired driving. The rising consumption of illicit drugs & alcohol will further increase the development of drug screening products & services on the road, thereby driving the overall market growth.
RESTRAINT: prohibition on workplace drug testing in some countries
Some countries such as Canada, Colombia, Argentina, Chile, and South Africa, consider drug & alcohol testing at the workplace to be a violation of employee privacy. For instance, pre-employment drug testing is only performed in France when physicians recommend the test. In Poland and the Czech Republic, drug & alcohol tests in the workplace are prohibited. In Canada, the Eastern Canadian case laws permit drug & alcohol testing only when workplace operations are inherently dangerous or where drug and alcohol testing is limited to a few special cases. Such prohibitions in various countries may hinder the adoption of drug & alcohol testing in these markets, thus restraining overall market growth to a certain extent.
OPPORTUNITY: Emerging economies
Fingerprint-based drug testing is a relatively new concept that has gained significance due to the COVID-19 pandemic. The coronavirus has made it difficult to execute drug testing in hospitals, labs, and other facilities due to the risk of transmitting the infection. Although fingerprint-based drug screening can help limit the spread of COVID, it is noninvasive, portable, less time-consuming, hygienic, enables social distancing, is user-friendly, and requires no specific preparation for sample collection and handling. This test is very easy to implement whenever and wherever required, thus offering flexible and effective workplace drug testing. The test analyzes small traces of sweat in the fingerprint to detect drug and drug metabolites. This test is used in workplaces, criminal justice, law enforcement, and drug rehabilitation programs. The test analyzes small traces of sweat in the fingerprint to detect drug and drug metabolites. If this test is widely adopted, it is expected to replace urine, hair, and blood-based drug tests. This is a significant opportunity for the market players to capitalize on in the market.
North America was the largest regional market for drug screening industry.
The drug screening market is segmented into North America, Europe, the Asia Pacific, and the Rest of the World. North America was the largest regional segment of the overall market with a share of 48.2%, followed by Europe. The dominance of the North American market is attributed to factors such as the growing consumption of illicit drugs, the availability of government funding to curb drug abuse, laws supporting drug screening, the growing burden of accidents due to alcohol impairment, and the presence of key players in the region are driving the growth of the market in this region.
To know about the assumptions considered for the study, download the pdf brochure
The prominent players operating in this market include LabCorp (US), Quest Diagnostics (US), Abbott Laboratories (US), OraSure Technologies (US), Alfa Scientific Designs (US), Thermo Fisher Scientific (US), Drägerwerk (Germany), LifeLoc (US), MPD Inc. (US), Omega Laboratories (US), Premier Biotech (US), Psychemedics (US), Roche (Switzerland), Shimadzu (Japan), and Siemens Healthineers (Germany).
Scope of the Drug Screening Industry
Report Metric |
Details |
Market Revenue in 2022 |
$5.3 billion |
Projected Revenue by 2027 |
$11.6 billion |
Revenue Rate |
Poised to grow at a CAGR of 16.8% |
Growth Driver |
Growing drug and alcohol consumption |
Growth Opportunity |
Emerging economies |
The study categorizes the Drug screening market to forecast revenue and analyze trends in each of the following submarkets:
By Product and Service
- Drug Screening Product
-
Analytical Instruments
-
Breathalyzers
- Fuel Cell Breathalyzer
- Semiconductor Breathalyzer
- Other Breathalyzers
- Immunoassay Analyzer
- Chromatography Instruments
-
Breathalyzers
-
Rapid Testing Devices
-
Urine Testing Devices
- Drug Testing Cups
- Dip Cards
- Drug Testing Cassetts
-
Urine Testing Devices
- Oral Fluid Testing Devices
-
Consumables
- Assay Kits
- Sample Collection Devices
- Calibrators & Controls
- Other Consumables
- Drug Screening Service
By Sample Type
- Urine Samples
- Breath Samples
- Oral Fluid Samples
- Hair Samples
- Other Samples
By End User
- Drug Testing Laboratories
- Workplaces
- Criminal Justice and Law Enforcement Agencies
- Hospitals
- Drug Treatment Centers
- Individual Users
- Pain Management Centers
- Schools and Colleges
By Region
-
North America
- US
- Canada
-
Europe
- Germany
- France
- UK
- Italy
- Spain
- RoE
-
Asia Pacific
- China
- Japan
- India
- RoAPAC
-
Rest of the World
- Latin America
- Middle East & Africa
Recent Developments of Drug Screening Industry
- In August 2021, Quest Diagnostics and Select Health of South Carolina entered into an agreement to expand Select Health’s laboratory network for its Medicaid and Medicare-Medicaid dual-eligible enrollees and to enhance access to diagnostics information services for members.
- In September 2020, LabCorp Entered into a multi-year agreement with Infirmary Health (US) to offer laboratory testing services in the eastern Gulf Coast.
- In May 2020, Psychemedics introduced a vaping panel test that detects the ingestion of marijuana, CBD, and nicotine drugs by all methods, including electronic cigarettes or smoking
- In April 2019, Thermo Fisher Scientific introduced CEDIA Mitragynine (Kratom) Assay for the detection of Kratom for criminal justice and forensic use only
- In May 2018, Omega Laboratories introduced the Omega Hair 17-panel drug test capable of detecting 45 different substances, including eight commonly abused variants of benzodiazepines
Frequently Asked Questions (FAQ):
What is the projected market revenue value of the drug screening market?
The drug screening market boasts a total revenue value of $11.6 billion by 2026.
What is the estimated growth rate (CAGR) of the drug screening market?
The global drug screening market has an estimated compound annual growth rate (CAGR) of 16.8% and a revenue size in the region of $5.3 billion in 2021.
To speak to our analyst for a discussion on the above findings, click Speak to Analyst
TABLE OF CONTENTS
1 INTRODUCTION (Page No. - 31)
1.1 OBJECTIVES OF THE STUDY
1.2 DRUG SCREENING INDUSTRY DEFINITION
1.2.1 INCLUSIONS & EXCLUSIONS OF THE STUDY
1.3 DRUG SCREENING MARKET SCOPE
1.3.1 MARKETS COVERED
1.3.2 YEARS CONSIDERED FOR THE STUDY
1.4 CURRENCY
1.5 LIMITATIONS
1.6 MARKET STAKEHOLDERS
1.7 SUMMARY OF CHANGES
2 RESEARCH METHODOLOGY (Page No. - 36)
2.1 RESEARCH DATA
FIGURE 1 RESEARCH DESIGN
2.1.1 SECONDARY DATA
2.1.1.1 Key data from secondary sources
2.1.2 PRIMARY DATA
FIGURE 2 PRIMARY SOURCES
2.1.2.1 Key industry insights
2.1.2.2 Breakdown of primary interviews
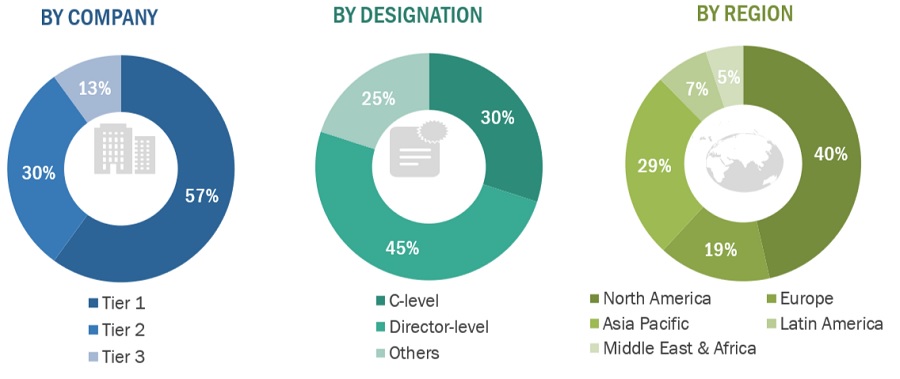
FIGURE 3 BREAKDOWN OF PRIMARY INTERVIEWS: BY COMPANY, DESIGNATION, AND REGION
FIGURE 4 BREAKDOWN OF PRIMARY INTERVIEWS (DEMAND SIDE): BY END USER AND REGION
2.2 MARKET SIZE ESTIMATION
2.2.1 TOTAL MARKET SIZE: DRUG SCREENING MARKET
FIGURE 5 SUPPLY-SIDE MARKET SIZE ESTIMATION: REVENUE SHARE ANALYSIS
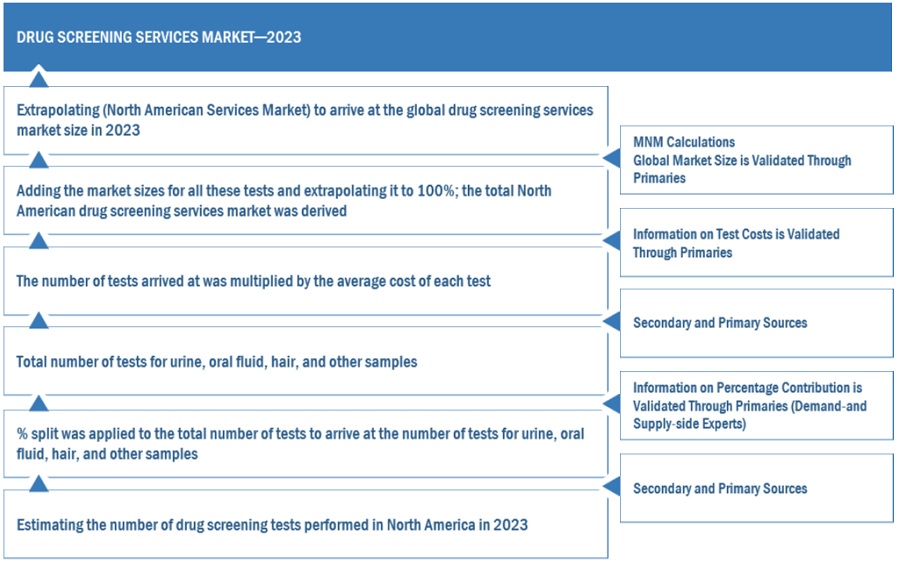
FIGURE 6 BOTTOM-UP APPROACH: NO OF TESTING VOLUME BASED ESTIMATION
2.2.2 TOP-DOWN APPROACH: CONTRIBUTION-BASED MARKET SIZE ESTIMATION
FIGURE 7 MARKET: TOP-DOWN APPROACH
2.2.3 GROWTH FORECAST
FIGURE 8 CAGR PROJECTIONS FROM THE ANALYSIS OF DRIVERS, RESTRAINTS, OPPORTUNITIES, AND CHALLENGES IN THE MARKET (2021–2026)
FIGURE 9 CAGR PROJECTIONS: SUPPLY-SIDE ANALYSIS
2.3 MARKET BREAKDOWN & DATA TRIANGULATION
FIGURE 10 DATA TRIANGULATION METHODOLOGY
2.4 ASSUMPTIONS FOR THE STUDY
2.5 RISK ASSESSMENT
TABLE 1 RISK ASSESSMENT: MARKET
2.6 LIMITATIONS
3 EXECUTIVE SUMMARY (Page No. - 49)
FIGURE 11 DRUG SCREENING SERVICES MARKET TO RECORD THE HIGHEST CAGR DURING THE FORECAST PERIOD
FIGURE 12 ANALYTICAL INSTRUMENTS SEGMENT TO DOMINATE THE DRUG SCREENING PRODUCTS MARKET, 2021–2026 (USD MILLION)
FIGURE 13 DRUG TESTING LABORATORIES ARE EXPECTED TO ACCOUNT FOR THE LARGEST SHARE OF THE END-USER MARKET DURING THE FORECAST PERIOD (USD MILLION)
FIGURE 14 GEOGRAPHIC SNAPSHOT OF THE MARKET
4 PREMIUM INSIGHTS (Page No. - 52)
4.1 DRUG SCREENING MARKET OVERVIEW
FIGURE 15 GROWING CONSUMPTION OF ILLICIT DRUGS AND ALCOHOL TO DRIVE MARKET GROWTH
4.2 MARKET, BY PRODUCT & SERVICE
FIGURE 16 SERVICES SEGMENT TO REGISTER THE HIGHEST CAGR DURING THE FORECAST PERIOD (USD MILLION)
4.3 MARKET, BY SAMPLE TYPE
FIGURE 17 ORAL FLUID SAMPLES SEGMENT TO GROW AT THE HIGHEST CAGR DURING THE FORECAST PERIOD (USD MILLION)
4.4 DRUG SCREENING MARKET: GEOGRAPHIC SNAPSHOT
FIGURE 18 INDIA TO WITNESS THE HIGHEST GROWTH RATE IN THE MARKET DURING THE FORECAST PERIOD
5 MARKET OVERVIEW (Page No. - 54)
5.1 INTRODUCTION
5.2 MARKET DYNAMICS
FIGURE 19 DRUG SCREENING MARKET: DRIVERS, RESTRAINTS, OPPORTUNITIES, AND CHALLENGES
5.2.1 DRIVERS
5.2.1.1 Growing drug & alcohol consumption
5.2.1.2 Enforcement of stringent laws mandating drug & alcohol testing
5.2.1.3 Rising regulatory approvals for drug screening products & services
TABLE 2 KEY PRODUCT & SERVICE LAUNCHES (2018–2021)
TABLE 3 RECENT APPROVALS FOR DRUG & ALCOHOL TESTING PRODUCTS & SERVICES
5.2.2 RESTRAINTS
5.2.2.1 Ban on alcohol consumption in several Islamic countries
5.2.2.2 Prohibition on workplace drug testing in specific countries
5.2.3 OPPORTUNITIES
5.2.3.1 Oral fluid testing
5.2.3.2 Fingerprint-based drug testing
5.2.3.3 Emerging economies
5.2.4 CHALLENGES
5.2.4.1 Accuracy and specificity concerns related to breathalyzers
5.3 VALUE CHAIN ANALYSIS
FIGURE 20 DRUG SCREENING MARKET: VALUE CHAIN ANALYSIS
5.4 ECOSYSTEM ANALYSIS
FIGURE 21 ECOSYSTEM: MARKET
TABLE 4 ROLE OF MARKET PLAYERS IN THE DRUG SCREENING ECOSYSTEM
5.5 IMPACT OF COVID 19 ON MARKET
5.6 PORTER’S FIVE FORCES ANALYSIS
TABLE 5 MARKET: PORTER’S FIVE FORCES ANALYSIS
5.6.1 DEGREE OF COMPETITION
5.6.2 BARGAINING POWER OF SUPPLIERS
5.6.3 BARGAINING POWER OF BUYERS
5.6.4 THREAT OF SUBSTITUTES
5.6.5 THREAT OF NEW ENTRANTS
5.7 TECHNOLOGY ANALYSIS
5.8 REGULATORY ANALYSIS
5.8.1 REGULATORY ASPECTS OF WORKPLACE DRUG TESTING
5.8.1.1 US
5.8.1.1.1 Substance Abuse and Mental Health Services Administration (SAMSHA)
5.8.1.1.1.1 Federal workplace drug testing
5.8.1.1.1.2 Federal laws and regulations
5.8.1.1.2 Department of Transportation (DOT)
TABLE 6 US: DRUG AND ALCOHOL TESTING REGULATIONS
5.8.1.2 Europe
5.8.1.2.1 Finland
5.8.1.2.2 Sweden
5.8.1.2.3 France
5.8.1.2.4 Italy
5.8.1.2.5 United Kingdom
5.8.1.2.6 Netherlands
5.8.1.2.7 Ireland
5.8.1.3 Australia and New Zealand
5.9 PATENT ANALYSIS
5.10 CASE STUDY ANALYSIS
5.10.1 LEADING RETAIL CHAIN SAVES $1 MILLION WITH INSTANT ORAL FLUID EMPLOYEE DRUG SCREEN SOLUTION
5.10.2 A BETTER AND INCREASINGLY EFFICIENT DRUG SCREENING SYSTEM
5.10.3 PRE-EMPLOYMENT TESTING-LONG TERM CARE INDUSTRY
5.10.4 HAIR TESTING VS. URINALYSIS (TRANSPORTATION INDUSTRY)
5.10.5 RANDOM TESTING (MANUFACTURING/AUTOMOTIVE)
5.10.6 CONTRACTOR TESTING (OIL/GAS)
5.10.7 KINGS TRANSPORT-DRUG AND ALCOHOL TESTING
6 DRUG SCREENING MARKET, BY PRODUCT & SERVICE (Page No. - 72)
6.1 INTRODUCTION
TABLE 7 DRUG SCREENING INDUSTRY, BY PRODUCT & SERVICE, 2019–2026 (USD MILLION)
6.2 DRUG SCREENING SERVICES
6.2.1 ADVANCED DRUG SCREENING TESTS & SERVICES TO DRIVE THE GROWTH OF THIS SEGMENT
TABLE 8 DRUG SCREENING SERVICES MARKET, BY REGION, 2019–2026 (USD MILLION)
6.3 DRUG SCREENING PRODUCTS
TABLE 9 DRUG SCREENING PRODUCT MARKET, BY TYPE, 2019–2026 (USD MILLION)
6.3.1 ANALYTICAL INSTRUMENTS
TABLE 10 DRUG SCREENING PRODUCT MARKET FOR ANALYTICAL INSTRUMENTS, BY TYPE, 2019–2026 (USD MILLION)
TABLE 11 DRUG SCREENING PRODUCTS MARKET FOR ANALYTICAL INSTRUMENTS, BY REGION, 2019–2026 (USD MILLION)
6.3.1.1 Breathalyzers
6.3.1.1.1 Law enforcement agencies widely use breathalyzers
TABLE 12 BREATHALYZERS MARKET, BY TYPE, 2019–2026 (USD MILLION)
TABLE 13 BREATHALYZERS MARKET, BY REGION, 2019–2026 (USD MILLION)
6.3.1.1.2 Fuel-cell breathalyzers
TABLE 14 FUEL-CELL BREATHALYZERS MARKET, BY REGION, 2019–2026 (USD MILLION)
6.3.1.1.3 Semiconductor breathalyzers
TABLE 15 SEMICONDUCTOR BREATHALYZERS MARKET, BY REGION, 2019–2026 (USD MILLION)
6.3.1.1.4 Other breathalyzers
TABLE 16 OTHER BREATHALYZERS MARKET, BY REGION, 2019–2026 (USD MILLION)
6.3.1.2 Immunoassay analyzers
6.3.1.2.1 North America is the largest market for immunoassay analyzers
TABLE 17 IMMUNOASSAY ANALYZERS MARKET, BY REGION, 2019–2026 (USD MILLION)
6.3.1.3 Chromatography instruments
6.3.1.3.1 Chromatography techniques show higher accuracy than immunoassays
TABLE 18 CHROMATOGRAPHY INSTRUMENTS MARKET, BY REGION, 2019–2026 (USD MILLION)
6.3.2 RAPID TESTING DEVICES
TABLE 19 DRUG SCREENING PRODUCT MARKET FOR RAPID TESTING DEVICES, BY TYPE, 2019–2026 (USD MILLION)
TABLE 20 DRUG SCREENING PRODUCT MARKET FOR RAPID TESTING DEVICES, BY REGION, 2019–2026 (USD MILLION)
6.3.2.1 Urine testing devices
6.3.2.1.1 Urine testing provides results within minutes and is used in a wide range of applications
TABLE 21 URINE TESTING DEVICES MARKET, BY TYPE, 2019–2026 (USD MILLION)
TABLE 22 URINE TESTING DEVICES MARKET, BY REGION, 2019–2026 (USD MILLION)
6.3.2.1.2 Drug testing cups
TABLE 23 DRUG TESTING CUPS MARKET, BY REGION, 2019–2026 (USD MILLION)
6.3.2.1.3 Dip cards
TABLE 24 DIP CARDS MARKET, BY REGION, 2019–2026 (USD MILLION)
6.3.2.1.4 Drug testing cassettes
TABLE 25 DRUG TESTING CASSETTES MARKET, BY REGION, 2019–2026 (USD MILLION)
6.3.2.2 Oral fluid testing devices
6.3.2.2.1 Short detection windows, noninvasive nature, and low chance of sample tampering ensures the demand for oral fluid testing
TABLE 26 ORAL FLUID TESTING DEVICES MARKET, BY REGION, 2019–2026 (USD MILLION)
6.3.3 CONSUMABLES
TABLE 27 DRUG SCREENING CONSUMABLES MARKET, BY TYPE, 2019–2026 (USD MILLION)
TABLE 28 DRUG SCREENING CONSUMABLES MARKET, BY REGION, 2019–2026 (USD MILLION)
6.3.3.1 Assay kits
6.3.3.1.1 Immunoassay kits provide a rapid and inexpensive method to screen samples
TABLE 29 ASSAY KITS MARKET, BY REGION, 2019–2026 (USD MILLION)
6.3.3.2 Sample collection devices
6.3.3.2.1 Sample collection devices see wide usage in drug testing laboratories
TABLE 30 SAMPLE COLLECTION DEVICES MARKET, BY REGION, 2019–2026 (USD MILLION)
6.3.3.3 Calibrators & controls
TABLE 31 CALIBRATORS & CONTROLS MARKET, BY REGION, 2019–2026 (USD MILLION)
6.3.3.4 Other consumables
TABLE 32 OTHER CONSUMABLES MARKET, BY REGION, 2019–2026 (USD MILLION)
7 DRUG SCREENING MARKET, BY SAMPLE TYPE (Page No. - 87)
7.1 INTRODUCTION
TABLE 33 DRUG SCREENING INDUSTRY, BY SAMPLE TYPE, 2019–2026 (USD MILLION)
7.2 URINE SAMPLES
7.2.1 EASE OF COLLECTION AND NONINVASIVENESS HAS SUPPORTED THE USE OF URINE SAMPLES
TABLE 34 MARKET FOR URINE SAMPLES, BY REGION, 2019–2026 (USD MILLION)
7.3 BREATH SAMPLES
7.3.1 BREATH ALCOHOL TESTS SEE WIDE USAGE IN WORKPLACE TESTING AND LAW ENFORCEMENT APPLICATIONS
TABLE 35 MARKET FOR BREATH SAMPLES, BY REGION, 2019–2026 (USD MILLION)
7.4 ORAL FLUID SAMPLES
7.4.1 NONINVASIVE SAMPLE COLLECTION AND LOW CHANCE OF ADULTERATION HAVE SUPPORTED THE USAGE OF ORAL FLUID SAMPLES
TABLE 36 MARKET FOR ORAL FLUID SAMPLES, BY REGION, 2019–2026 (USD MILLION)
7.5 HAIR SAMPLES
7.5.1 HAIR SAMPLES CAN PROVIDE INSIGHTS INTO LONG-TERM DRUG USE
TABLE 37 MARKET FOR HAIR SAMPLES, BY REGION, 2019–2026 (USD MILLION)
7.6 OTHER SAMPLES
TABLE 38 DRUG SCREENING MARKET FOR OTHER SAMPLES, BY REGION, 2019–2026 (USD MILLION)
8 DRUG SCREENING MARKET, BY END USER (Page No. - 93)
8.1 INTRODUCTION
TABLE 39 DRUG SCREENING INDUSTRY, BY END USER, 2019–2026 (USD MILLION)
8.2 DRUG TESTING LABORATORIES
8.2.1 DRUG TESTING LABORATORIES TO EXHIBIT THE HIGHEST GROWTH RATE DURING THE FORECAST PERIOD
TABLE 40 MARKET FOR DRUG TESTING LABORATORIES, BY REGION, 2019–2026 (USD MILLION)
8.3 WORKPLACES
8.3.1 THE RISING NUMBER OF DRUG ABUSE CASES HAS RESULTED IN AN INCREASE IN WORKPLACE TESTING
TABLE 41 MARKET FOR WORKPLACES, BY REGION, 2019–2026 (USD MILLION)
TABLE 42 US: MARKET, BY WORKPLACE TYPE, 2019–2026 (USD MILLION)
8.4 CRIMINAL JUSTICE SYSTEMS & LAW ENFORCEMENT AGENCIES
8.4.1 URINE IS THE MOST COMMONLY USED SAMPLE IN CRIMINAL JUSTICE SYSTEMS
TABLE 43 MARKET FOR CRIMINAL JUSTICE SYSTEMS & LAW ENFORCEMENT AGENCIES, BY REGION, 2019–2026 (USD MILLION)
8.5 HOSPITALS
8.5.1 RISING INCIDENCE OF DRUG ABUSE HAS RESULTED IN AN INCREASE IN EMERGENCY DEPARTMENT VISITS
TABLE 44 DRUG SCREENING INDUSTRY FOR HOSPITALS, BY REGION, 2019–2026 (USD MILLION)
8.6 DRUG TREATMENT CENTERS
8.6.1 AVAILABILITY OF GOVERNMENT SUPPORT IS A KEY GROWTH DRIVER FOR REHABILITATION CENTERS
TABLE 45 MARKET FOR DRUG TREATMENT CENTERS, BY REGION, 2019–2026 (USD MILLION)
8.7 INDIVIDUAL USERS
8.7.1 PERSONAL BREATHALYZERS ARE WITNESSING INCREASING ADOPTION DUE TO STRINGENT DUI REGULATIONS
TABLE 46 MARKET FOR INDIVIDUAL USERS, BY REGION, 2019–2026 (USD MILLION)
8.8 PAIN MANAGEMENT CENTERS
8.8.1 RISING SUBSTANCE ABUSE HAS SUPPORTED DRUG TESTING IN PAIN MANAGEMENT APPLICATIONS
TABLE 47 MARKET FOR PAIN MANAGEMENT CENTERS, BY REGION, 2019–2026 (USD MILLION)
8.9 SCHOOLS AND COLLEGES
8.9.1 DRUG ABUSE TESTING PROGRAMS HAVE BEEN INTRODUCED IN SCHOOLS TO CURB DRUG ABUSE
TABLE 48 MARKET FOR SCHOOLS AND COLLEGES, BY REGION, 2019–2026 (USD MILLION)
9 DRUG SCREENING MARKET, BY REGION (Page No. - 101)
9.1 INTRODUCTION
TABLE 49 DRUG SCREENING INDUSTRY, BY REGION, 2019–2026 (USD MILLION)
9.2 NORTH AMERICA
FIGURE 22 NORTH AMERICA: DRUG SCREENING MARKET SNAPSHOT
TABLE 50 NORTH AMERICA: MARKET, BY COUNTRY, 2019–2026 (USD MILLION)
TABLE 51 NORTH AMERICA: MARKET, BY PRODUCT & SERVICE, 2019–2026 (USD MILLION)
TABLE 52 NORTH AMERICA: DRUG SCREENING PRODUCT MARKET, BY TYPE, 2019–2026 (USD MILLION)
TABLE 53 NORTH AMERICA: ANALYTICAL INSTRUMENTS MARKET, BY TYPE, 2019–2026 (USD MILLION)
TABLE 54 NORTH AMERICA: BREATHALYZERS MARKET, BY TYPE, 2019–2026 (USD MILLION)
TABLE 55 NORTH AMERICA: RAPID TESTING DEVICES MARKET, BY TYPE, 2019–2026 (USD MILLION)
TABLE 56 NORTH AMERICA: URINE TESTING DEVICES MARKET, BY TYPE, 2019–2026 (USD MILLION)
TABLE 57 NORTH AMERICA: CONSUMABLES MARKET, BY TYPE, 2019–2026 (USD MILLION)
TABLE 58 NORTH AMERICA: MARKET, BY SAMPLE TYPE, 2019–2026 (USD MILLION)
TABLE 59 NORTH AMERICA: DRUG SCREENING INDUSTRY, BY END USER, 2019–2026 (USD MILLION)
9.2.1 US
9.2.1.1 The US holds the largest share of the drug screening market in North America
TABLE 60 US: DRUG SCREENING MARKET, BY PRODUCT & SERVICE, 2019–2026 (USD MILLION)
TABLE 61 US: DRUG SCREENING PRODUCT MARKET, BY TYPE, 2019–2026 (USD MILLION)
TABLE 62 US: ANALYTICAL INSTRUMENTS MARKET, BY TYPE, 2019–2026 (USD MILLION)
TABLE 63 US: BREATHALYZERS MARKET, BY TYPE, 2019–2026 (USD MILLION)
TABLE 64 US: RAPID TESTING DEVICES MARKET, BY TYPE, 2019–2026 (USD MILLION)
TABLE 65 US: URINE TESTING DEVICES MARKET, BY TYPE, 2019–2026 (USD MILLION)
TABLE 66 US: CONSUMABLES MARKET, BY TYPE, 2019–2026 (USD MILLION)
TABLE 67 US: MARKET, BY SAMPLE TYPE, 2019–2026 (USD MILLION)
TABLE 68 US: DRUG SCREENING INDUSTRY, BY END USER, 2019–2026 (USD MILLION)
9.2.2 CANADA
9.2.2.1 The high rate of DUI-related accidental deaths is expected to drive the use of breathalyzers in this market
TABLE 69 CANADA: DRUG SCREENING MARKET, BY PRODUCT & SERVICE, 2019–2026 (USD MILLION)
TABLE 70 CANADA: DRUG SCREENING PRODUCT MARKET, BY TYPE, 2019–2026 (USD MILLION)
TABLE 71 CANADA: ANALYTICAL INSTRUMENTS MARKET, BY TYPE, 2019–2026 (USD MILLION)
TABLE 72 CANADA: BREATHALYZERS MARKET, BY TYPE, 2019–2026 (USD MILLION)
TABLE 73 CANADA: RAPID TESTING DEVICES MARKET, BY TYPE, 2019–2026 (USD MILLION)
TABLE 74 CANADA: URINE TESTING DEVICES MARKET, BY TYPE, 2019–2026 (USD MILLION)
TABLE 75 CANADA: CONSUMABLES MARKET, BY TYPE, 2019–2026 (USD MILLION)
TABLE 76 CANADA: MARKET, BY SAMPLE TYPE, 2019–2026 (USD MILLION)
TABLE 77 CANADA: DRUG SCREENING INDUSTRY, BY END USER, 2019–2026 (USD MILLION)
9.3 EUROPE
TABLE 78 EUROPE: DRUG SCREENING MARKET, BY COUNTRY, 2019–2026 (USD MILLION)
TABLE 79 EUROPE: MARKET, BY PRODUCT & SERVICE, 2019–2026 (USD MILLION)
TABLE 80 EUROPE: DRUG SCREENING PRODUCT MARKET, BY TYPE, 2019–2026 (USD MILLION)
TABLE 81 EUROPE: ANALYTICAL INSTRUMENTS MARKET, BY TYPE, 2019–2026 (USD MILLION)
TABLE 82 EUROPE: BREATHALYZERS MARKET, BY TYPE, 2019–2026 (USD MILLION)
TABLE 83 EUROPE: RAPID TESTING DEVICES MARKET, BY TYPE, 2019–2026 (USD MILLION)
TABLE 84 EUROPE: URINE TESTING DEVICES MARKET, BY TYPE, 2019–2026 (USD MILLION)
TABLE 85 EUROPE: CONSUMABLES MARKET, BY TYPE, 2019–2026 (USD MILLION)
TABLE 86 EUROPE: MARKET, BY SAMPLE TYPE, 2019–2026 (USD MILLION)
TABLE 87 EUROPE: DRUG SCREENING INDUSTRY, BY END USER, 2019–2026 (USD MILLION)
9.3.1 GERMANY
9.3.1.1 The rising number of drug-related deaths in Germany drives the demand for drug screening products & services
TABLE 88 GERMANY: DRUG SCREENING MARKET, BY PRODUCT & SERVICE, 2019–2026 (USD MILLION)
TABLE 89 GERMANY: DRUG SCREENING PRODUCT MARKET, BY TYPE, 2019–2026 (USD MILLION)
TABLE 90 GERMANY: ANALYTICAL INSTRUMENTS MARKET, BY TYPE, 2019–2026 (USD MILLION)
TABLE 91 GERMANY: BREATHALYZERS MARKET, BY TYPE, 2019–2026 (USD MILLION)
TABLE 92 GERMANY: RAPID TESTING DEVICES MARKET, BY TYPE, 2019–2026 (USD MILLION)
TABLE 93 GERMANY: URINE TESTING DEVICES MARKET, BY TYPE, 2019–2026 (USD MILLION)
TABLE 94 GERMANY: CONSUMABLES MARKET, BY TYPE, 2019–2026 (USD MILLION)
TABLE 95 GERMANY: MARKET, BY SAMPLE TYPE, 2019–2026 (USD MILLION)
TABLE 96 GERMANY: DRUG SCREENING INDUSTRY, BY END USER, 2019–2026 (USD MILLION)
9.3.2 FRANCE
9.3.2.1 Cannabis and cocaine are the most widely used illicit substances in France
TABLE 97 FRANCE: DRUG SCREENING MARKET, BY PRODUCT & SERVICE, 2019–2026 (USD MILLION)
TABLE 98 FRANCE: DRUG SCREENING PRODUCT MARKET, BY TYPE, 2019–2026 (USD MILLION)
TABLE 99 FRANCE: ANALYTICAL INSTRUMENTS MARKET, BY TYPE, 2019–2026 (USD MILLION)
TABLE 100 FRANCE: BREATHALYZERS MARKET, BY TYPE, 2019–2026 (USD MILLION)
TABLE 101 FRANCE: RAPID TESTING DEVICES MARKET, BY TYPE, 2019–2026 (USD MILLION)
TABLE 102 FRANCE: URINE TESTING DEVICES MARKET, BY TYPE, 2019–2026 (USD MILLION)
TABLE 103 FRANCE: CONSUMABLES MARKET, BY TYPE, 2019–2026 (USD MILLION)
TABLE 104 FRANCE: MARKET, BY SAMPLE TYPE, 2019–2026 (USD MILLION)
TABLE 105 FRANCE: DRUG SCREENING INDUSTRY, BY END USER, 2019–2026 (USD MILLION)
9.3.3 UK
9.3.3.1 Favorable government support is a key growth driver for the UK market
TABLE 106 UK: DRUG SCREENING MARKET, BY PRODUCT & SERVICE, 2019–2026 (USD MILLION)
TABLE 107 UK: DRUG SCREENING PRODUCT MARKET, BY TYPE, 2019–2026 (USD MILLION)
TABLE 108 UK: ANALYTICAL INSTRUMENTS MARKET, BY TYPE, 2019–2026 (USD MILLION)
TABLE 109 UK: BREATHALYZERS MARKET, BY TYPE, 2019–2026 (USD MILLION)
TABLE 110 UK: RAPID TESTING DEVICES MARKET, BY TYPE, 2019–2026 (USD MILLION)
TABLE 111 UK: URINE TESTING DEVICES MARKET, BY TYPE, 2019–2026 (USD MILLION)
TABLE 112 UK: CONSUMABLES MARKET, BY TYPE, 2019–2026 (USD MILLION)
TABLE 113 UK: MARKET, BY SAMPLE TYPE, 2019–2026 (USD MILLION)
TABLE 114 UK: DRUG SCREENING INDUSTRY, BY END USER, 2019–2026 (USD MILLION)
9.3.4 ITALY
9.3.4.1 Cannabis is the most widely used illicit drug among adolescents in Italy
TABLE 115 ITALY: DRUG SCREENING MARKET, BY PRODUCT & SERVICE, 2019–2026 (USD MILLION)
TABLE 116 ITALY: DRUG SCREENING PRODUCT MARKET, BY TYPE, 2019–2026 (USD MILLION)
TABLE 117 ITALY: ANALYTICAL INSTRUMENTS MARKET, BY TYPE, 2019–2026 (USD MILLION)
TABLE 118 ITALY: RAPID TESTING DEVICES MARKET, BY TYPE, 2019–2026 (USD MILLION)
TABLE 119 ITALY: MARKET, BY SAMPLE TYPE, 2019–2026 (USD MILLION)
TABLE 120 ITALY: DRUG SCREENING INDUSTRY, BY END USER, 2019–2026 (USD MILLION)
9.3.5 SPAIN
9.3.5.1 Cannabis and cocaine are the most widely used drugs in Spain among adolescents and adults
TABLE 121 SPAIN: DRUG SCREENING MARKET, BY PRODUCT & SERVICE, 2019–2026 (USD MILLION)
TABLE 122 SPAIN: DRUG SCREENING PRODUCT MARKET, BY TYPE, 2019–2026 (USD MILLION)
TABLE 123 SPAIN: ANALYTICAL INSTRUMENTS MARKET, BY TYPE, 2019–2026 (USD MILLION)
TABLE 124 SPAIN: RAPID TESTING DEVICES MARKET, BY TYPE, 2019–2026 (USD MILLION)
TABLE 125 SPAIN: MARKET, BY SAMPLE TYPE, 2019–2026 (USD MILLION)
TABLE 126 SPAIN: DRUG SCREENING INDUSTRY, BY END USER, 2019–2026 (USD MILLION)
9.3.6 ROE
TABLE 127 ROE: DRUG SCREENING MARKET, BY PRODUCT & SERVICE, 2019–2026 (USD MILLION)
TABLE 128 ROE: DRUG SCREENING PRODUCT MARKET, BY TYPE, 2019–2026 (USD MILLION)
TABLE 129 ROE: ANALYTICAL INSTRUMENTS MARKET, BY TYPE, 2019–2026 (USD MILLION)
TABLE 130 ROE: BREATHALYZERS MARKET, BY TYPE, 2019–2026 (USD MILLION)
TABLE 131 ROE: RAPID TESTING DEVICES MARKET, BY TYPE, 2019–2026 (USD MILLION)
TABLE 132 ROE: URINE TESTING DEVICES MARKET, BY TYPE, 2019–2026 (USD MILLION)
TABLE 133 ROE: CONSUMABLES MARKET, BY TYPE, 2019–2026 (USD MILLION)
TABLE 134 ROE: MARKET, BY SAMPLE TYPE, 2019–2026 (USD MILLION)
TABLE 135 ROE: DRUG SCREENING INDUSTRY, BY END USER, 2019–2026 (USD MILLION)
9.4 ASIA PACIFIC (APAC)
FIGURE 23 APAC: DRUG SCREENING MARKET SNAPSHOT
TABLE 136 APAC: MARKET, BY COUNTRY, 2019–2026 (USD MILLION)
TABLE 137 APAC: MARKET, BY PRODUCT & SERVICE, 2019–2026 (USD MILLION)
TABLE 138 APAC: DRUG SCREENING PRODUCT MARKET, BY TYPE, 2019–2026 (USD MILLION)
TABLE 139 APAC: ANALYTICAL INSTRUMENTS MARKET, BY TYPE, 2019–2026 (USD MILLION)
TABLE 140 APAC: BREATHALYZERS MARKET, BY TYPE, 2019–2026 (USD MILLION)
TABLE 141 APAC: RAPID TESTING DEVICES MARKET, BY TYPE, 2019–2026 (USD MILLION)
TABLE 142 APAC: URINE TESTING DEVICES MARKET, BY TYPE, 2019–2026 (USD MILLION)
TABLE 143 APAC: CONSUMABLES MARKET, BY TYPE, 2019–2026 (USD MILLION)
TABLE 144 APAC: MARKET, BY SAMPLE TYPE, 2019–2026 (USD MILLION)
TABLE 145 APAC: DRUG SCREENING INDUSTRY, BY END USER, 2019–2026 (USD MILLION)
9.4.1 CHINA
9.4.1.1 China accounted for the largest share of the drug screening market in the APAC region in 2020
TABLE 146 CHINA: DRUG SCREENING MARKET, BY PRODUCT & SERVICE, 2019–2026 (USD MILLION)
TABLE 147 CHINA: DRUG SCREENING PRODUCT MARKET, BY TYPE, 2019–2026 (USD MILLION)
TABLE 148 CHINA: ANALYTICAL INSTRUMENTS MARKET, BY TYPE, 2019–2026 (USD MILLION)
TABLE 149 CHINA: BREATHALYZERS MARKET, BY TYPE, 2019–2026 (USD MILLION)
TABLE 150 CHINA: RAPID TESTING DEVICES MARKET, BY TYPE, 2019–2026 (USD MILLION)
TABLE 151 CHINA: URINE TESTING DEVICES MARKET, BY TYPE, 2019–2026 (USD MILLION)
TABLE 152 CHINA: CONSUMABLES MARKET, BY TYPE, 2019–2026 (USD MILLION)
TABLE 153 CHINA: MARKET, BY SAMPLE TYPE, 2019–2026 (USD MILLION)
TABLE 154 CHINA: DRUG SCREENING INDUSTRY, BY END USER, 2019–2026 (USD MILLION)
9.4.2 JAPAN
9.4.2.1 Stringent laws for drug abuse and the growing awareness of drug addiction are key growth drivers in Japan
TABLE 155 JAPAN: DRUG SCREENING MARKET, BY PRODUCT & SERVICE, 2019–2026 (USD MILLION)
TABLE 156 JAPAN: DRUG SCREENING PRODUCT MARKET, BY TYPE, 2019–2026 (USD MILLION)
TABLE 157 JAPAN: ANALYTICAL INSTRUMENTS MARKET, BY TYPE, 2019–2026 (USD MILLION)
TABLE 158 JAPAN: BREATHALYZERS MARKET, BY TYPE, 2019–2026 (USD MILLION)
TABLE 159 JAPAN: RAPID TESTING DEVICES MARKET, BY TYPE, 2019–2026 (USD MILLION)
TABLE 160 JAPAN: URINE TESTING DEVICES MARKET, BY TYPE, 2019–2026 (USD MILLION)
TABLE 161 JAPAN: CONSUMABLES MARKET, BY TYPE, 2019–2026 (USD MILLION)
TABLE 162 JAPAN: MARKET, BY SAMPLE TYPE, 2019–2026 (USD MILLION)
TABLE 163 JAPAN: DRUG SCREENING INDUSTRY, BY END USER, 2019–2026 (USD MILLION)
9.4.3 INDIA
9.4.3.1 The increasing burden of DUI-road cases in the country to drive the growth of the drug screening market
TABLE 164 INDIA: DRUG SCREENING MARKET, BY PRODUCT & SERVICE, 2019–2026 (USD MILLION)
TABLE 165 INDIA: DRUG SCREENING PRODUCT MARKET, BY TYPE, 2019–2026 (USD MILLION)
TABLE 166 INDIA: ANALYTICAL INSTRUMENTS MARKET, BY TYPE, 2019–2026 (USD MILLION)
TABLE 167 INDIA: BREATHALYZERS MARKET, BY TYPE, 2019–2026 (USD MILLION)
TABLE 168 INDIA: RAPID TESTING DEVICES MARKET, BY TYPE, 2019–2026 (USD MILLION)
TABLE 169 INDIA: URINE TESTING DEVICES MARKET, BY TYPE, 2019–2026 (USD MILLION)
TABLE 170 INDIA: CONSUMABLES MARKET, BY TYPE, 2019–2026 (USD MILLION)
TABLE 171 INDIA: MARKET, BY SAMPLE TYPE, 2019–2026 (USD MILLION)
TABLE 172 INDIA: DRUG SCREENING INDUSTRY, BY END USER, 2019–2026 (USD MILLION)
9.4.4 REST OF ASIA PACIFIC (ROAPAC)
TABLE 173 ROAPAC: DRUG SCREENING MARKET, BY PRODUCT & SERVICE, 2019–2026 (USD MILLION)
TABLE 174 ROAPAC: DRUG SCREENING PRODUCT MARKET, BY TYPE, 2019–2026 (USD MILLION)
TABLE 175 ROAPAC: ANALYTICAL INSTRUMENTS MARKET, BY TYPE, 2019–2026 (USD MILLION)
TABLE 176 ROAPAC: BREATHALYZERS MARKET, BY TYPE, 2019–2026 (USD MILLION)
TABLE 177 ROAPAC: RAPID TESTING DEVICES MARKET, BY TYPE, 2019–2026 (USD MILLION)
TABLE 178 ROAPAC: URINE TESTING DEVICES MARKET, BY TYPE, 2019–2026 (USD MILLION)
TABLE 179 ROAPAC: CONSUMABLES MARKET, BY TYPE, 2019–2026 (USD MILLION)
TABLE 180 ROAPAC: MARKET, BY SAMPLE TYPE, 2019–2026 (USD MILLION)
TABLE 181 ROAPAC: DRUG SCREENING INDUSTRY, BY END USER, 2019–2026 (USD MILLION)
9.5 REST OF THE WORLD (ROW)
TABLE 182 ROW: DRUG SCREENING MARKET, BY REGION, 2019–2026 (USD MILLION)
TABLE 183 ROW: MARKET, BY PRODUCT & SERVICE, 2019–2026 (USD MILLION)
TABLE 184 ROW: DRUG SCREENING PRODUCT MARKET, BY TYPE, 2019–2026 (USD MILLION)
TABLE 185 ROW: ANALYTICAL INSTRUMENTS MARKET, BY TYPE, 2019–2026 (USD MILLION)
TABLE 186 ROW: BREATHALYZERS MARKET, BY TYPE, 2019–2026 (USD MILLION)
TABLE 187 ROW: RAPID TESTING DEVICES MARKET, BY TYPE, 2019–2026 (USD MILLION)
TABLE 188 ROW: URINE TESTING DEVICES MARKET, BY TYPE, 2019–2026 (USD MILLION)
TABLE 189 ROW: CONSUMABLES MARKET, BY TYPE, 2019–2026 (USD MILLION)
TABLE 190 ROW: MARKET, BY SAMPLE TYPE, 2019–2026 (USD MILLION)
TABLE 191 ROW: DRUG SCREENING INDUSTRY, BY END USER, 2019–2026 (USD MILLION)
9.5.1 LATAM
9.5.1.1 Increasing incidence of drug overdose and favorable government support are key growth drivers in this region
TABLE 192 LATAM: DRUG SCREENING MARKET, BY PRODUCT & SERVICE, 2019–2026 (USD MILLION)
TABLE 193 LATAM: DRUG SCREENING PRODUCT MARKET, BY TYPE, 2019–2026 (USD MILLION)
TABLE 194 LATAM: ANALYTICAL INSTRUMENTS MARKET, BY TYPE, 2019–2026 (USD MILLION)
TABLE 195 LATAM: BREATHALYZERS MARKET, BY TYPE, 2019–2026 (USD MILLION)
TABLE 196 LATAM: RAPID TESTING DEVICES MARKET, BY TYPE, 2019–2026 (USD MILLION)
TABLE 197 LATAM: URINE TESTING DEVICES MARKET, BY TYPE, 2019–2026 (USD MILLION)
TABLE 198 LATAM: CONSUMABLES MARKET, BY TYPE, 2019–2026 (USD MILLION)
TABLE 199 LATAM: MARKET, BY SAMPLE TYPE, 2019–2026 (USD MILLION)
TABLE 200 LATAM: DRUG SCREENING INDUSTRY, BY END USER, 2019–2026 (USD MILLION)
9.5.2 MIDDLE EAST & AFRICA
9.5.2.1 Rising drug abuse and growing emphasis on drug abuse testing supports the market growth in the MEA region
TABLE 201 MEA: DRUG SCREENING MARKET, BY PRODUCT & SERVICE, 2019–2026 (USD MILLION)
TABLE 202 MEA: DRUG SCREENING PRODUCT MARKET, BY TYPE, 2019–2026 (USD MILLION)
TABLE 203 MEA: ANALYTICAL INSTRUMENTS MARKET, BY TYPE, 2019–2026 (USD MILLION)
TABLE 204 MEA: BREATHALYZERS MARKET, BY TYPE, 2019–2026 (USD MILLION)
TABLE 205 MEA: RAPID TESTING DEVICES MARKET, BY TYPE, 2019–2026 (USD MILLION)
TABLE 206 MEA: URINE TESTING DEVICES MARKET, BY TYPE, 2019–2026 (USD MILLION)
TABLE 207 MEA: CONSUMABLES MARKET, BY TYPE, 2019–2026 (USD MILLION)
TABLE 208 MEA: MARKET, BY SAMPLE TYPE, 2019–2026 (USD MILLION)
TABLE 209 MEA: DRUG SCREENING INDUSTRY, BY END USER, 2019–2026 (USD MILLION)
10 COMPETITIVE LANDSCAPE (Page No. - 162)
10.1 OVERVIEW
FIGURE 24 KEY DEVELOPMENTS OF PROMINENT PLAYERS OPERATING IN THE DRUG SCREENING MARKET (2018-2021)
10.2 MARKET RANKING
FIGURE 25 DRUG SCREENING SERVICES MARKET RANKING, BY KEY PLAYER, 2020
FIGURE 26 RAPID TESTING DEVICES MARKET RANKING, BY KEY PLAYER, 2020
10.3 COMPANY EVALUATION QUADRANT
10.3.1 STARS
10.3.2 EMERGING LEADERS
10.3.3 PERVASIVE PLAYERS
10.3.4 PARTICIPANTS
FIGURE 27 DRUG SCREENING INDUSTRY: COMPANY EVALUATION QUADRANT, 2020 (OVERALL MARKET)
10.4 COMPANY EVALUATION QUADRANT FOR EMERGING PLAYERS
10.4.1 PROGRESSIVE COMPANIES
10.4.2 STARTING BLOCKS
10.4.3 RESPONSIVE COMPANIES
10.4.4 DYNAMIC COMPANIES
FIGURE 28 DRUG SCREENING MARKET: COMPANY EVALUATION QUADRANT, 2020 (EMERGING PLAYERS)
10.5 COMPETITIVE BENCHMARKING
10.5.1 OVERALL COMPANY FOOTPRINT
TABLE 210 OVERALL COMPANY FOOTPRINT
10.5.2 COMPANY PRODUCT AND SERVICE FOOTPRINT
TABLE 211 COMPANY PRODUCT AND SERVICE FOOTPRINT
10.5.3 COMPANY PRODUCTS FOOTPRINT
TABLE 212 COMPANY PRODUCT FOOTPRINT
10.5.4 COMPANY REGION FOOTPRINT
TABLE 213 COMPANY REGION FOOTPRINT
10.6 COMPETITIVE SCENARIO
TABLE 214 PRODUCT LAUNCHES & APPROVALS (JANUARY 2018 -JUNE2021)
TABLE 215 DEALS (JANUARY 2018-AUGUST 2021)
TABLE 216 OTHER DEVELOPMENTS (JANUARY 2018– JUNE 2021)
11 COMPANY PROFILES (Page No. - 174)
11.1 KEY PLAYERS
(Business Overview, Products/Services/Solutions Offered, MnM View, Key Strengths and Right to Win, Strategic Choices Made, Weaknesses and Competitive Threats, Recent Developments)*
11.1.1 LABCORP
TABLE 217 LABCORP: BUSINESS OVERVIEW
FIGURE 29 LABCORP: COMPANY SNAPSHOT (2020)
11.1.2 QUEST DIAGNOSTICS
TABLE 218 QUEST DIAGNOSTICS: BUSINESS OVERVIEW
FIGURE 30 QUEST DIAGNOSTICS: COMPANY SNAPSHOT (2020)
11.1.3 ABBOTT LABORATORIES
TABLE 219 ABBOTT LABORATORIES: BUSINESS OVERVIEW
FIGURE 31 ABBOTT LABORATORIES: COMPANY SNAPSHOT (2020)
11.1.4 ORASURE TECHNOLOGIES
TABLE 220 ORASURE TECHNOLOGIES: BUSINESS OVERVIEW
FIGURE 32 ORASURE TECHNOLOGIES: COMPANY SNAPSHOTS (2020)
11.1.5 ALFA SCIENTIFIC DESIGNS
TABLE 221 ALFA SCIENTIFIC DESIGNS: BUSINESS OVERVIEW
11.1.6 THERMO FISHER SCIENTIFIC
TABLE 222 THERMO FISHER SCIENTIFIC: BUSINESS OVERVIEW
FIGURE 33 THERMO FISHER SCIENTIFIC: COMPANY SNAPSHOTS (2020)
11.1.7 DRÄGERWERK
TABLE 223 DRÄGERWERK: BUSINESS OVERVIEW
FIGURE 34 DRÄGERWERK: COMPANY SNAPSHOT (2020)
11.1.8 LIFELOC TECHNOLOGIES
TABLE 224 LIFELOC TECHNOLOGIES: BUSINESS OVERVIEW
FIGURE 35 LIFELOC: COMPANY SNAPSHOT (2020)
11.1.9 MPD INC.
TABLE 225 MPD INC: BUSINESS OVERVIEW
11.1.10 OMEGA LABORATORIES
TABLE 226 OMEGA LABORATORIES: BUSINESS OVERVIEW
11.1.11 PREMIER BIOTECH
TABLE 227 PREMIER BIOTECH: BUSINESS OVERVIEW
11.1.12 PSYCHEMEDICS
TABLE 228 PSYCHEMEDICS: BUSINESS OVERVIEW
FIGURE 36 PSYCHEMEDICS: COMPANY SNAPSHOT (2020)
*Business Overview, Products/Services/Solutions Offered, MnM View, Key Strengths and Right to Win, Strategic Choices Made, Weaknesses and Competitive Threats, Recent Developments might not be captured in case of unlisted companies.
11.2 OTHER PLAYERS
11.2.1 ROCHE
11.2.2 SHIMADZU
11.2.3 SIEMENS HEALTHINEERS
11.2.4 AMERICAN BIO MEDICA CORPORATION
11.2.5 ACM GLOBAL LABORATORIES
11.2.6 CAREHEALTH AMERICA CORP
11.2.7 CLINICAL REFERENCE LABORATORY
11.2.8 INTOXIMETERS
11.2.9 SCITECK, INC.
11.2.10 ACCUSOURCE
11.2.11 CORDANT HEALTH SOLUTIONS
11.2.12 SYNENS
11.2.13 MILLENNIUM HEALTH
12 APPENDIX (Page No. - 216)
12.1 DISCUSSION GUIDE
12.2 KNOWLEDGE STORE: MARKETSANDMARKETS’ SUBSCRIPTION PORTAL
12.3 AVAILABLE CUSTOMIZATIONS
12.4 RELATED REPORTS
12.5 AUTHOR DETAILS
This study involved four major activities in estimating the current size of the drug screening market. Exhaustive secondary research was carried out to collect information on the market, its peer markets, and its parent market. The next step was to validate these findings, assumptions, and sizing with industry experts across the value chain through primary research. Both top-down and bottom-up approaches were employed to estimate the complete market size. After that, market breakdown and data triangulation procedures were used to estimate the market size of segments and subsegments.
Secondary Research
Secondary research was used mainly to identify and collect information for the extensive, technical, market-oriented, and commercial study of the drug screening market. The secondary sources used for this study include World Health Organization (WHO), National Institute on Drug Abuse (NIDA), National Institute on Alcohol Abuse and Alcoholism (NIAAA), Substance Abuse and Mental Health Services Administration (SAMHSA), European Monitoring Centre for Drugs and Drug Addiction (EMCDDA), Asia-Pacific Society for Alcohol and Addiction Research (APSAAR), National Institute on Drug Abuse (NIDA), Federation of Indian NGOs for Drugs and AIDS Prevention (FINGODAP), International Journal of Drug Policy, American Journal of Drug and Alcohol Abuse, Annual Reports, SEC Filings, Investor Presentations, Expert Interviews, and MarketsandMarkets Analysis. These sources were also used to obtain key information about major players, market classification, and segmentation according to industry trends, regional/country-level markets, market developments, and technology perspectives.
Primary Research
In-depth interviews were conducted with various primary respondents, including key industry participants, subject-matter experts (SMEs), C-level executives of key market players, and industry consultants, among other experts, to obtain and verify the critical qualitative and quantitative information as well as assess future prospects of the market. Various primary sources from both the supply and demand sides of the market were interviewed to obtain qualitative and quantitative information. The following is a breakdown of the primary respondents:
To know about the assumptions considered for the study, download the pdf brochure
Market Size Estimation
Both top-down and bottom-up approaches were used to estimate and validate the total size of the drug screening market as well as to estimate the market size of various other dependent submarkets. These methods were also used extensively to estimate the size of various subsegments in the market. The research methodology used to estimate the market size includes the following:
- The key players in the industry and market have been identified through extensive secondary research
- The revenues generated from the drug screening business of leading players have been determined through primary and secondary research
- All percentage shares, splits, and breakdowns have been determined using secondary sources and verified through primary sources
Data Triangulation
After arriving at the overall market size from the market size estimation process, the total market was split into several segments and subsegments. To complete the overall market engineering process and arrive at the exact statistics for all segments and subsegments, data triangulation and market breakdown procedures were employed, wherever applicable. The data was triangulated by studying various factors and trends from both the demand and supply sides.
Report Objectives
- To define, describe, and forecast the global drug screening market based on the product and service, sample type, end user and region
- To provide detailed information regarding the major factors influencing the growth of the market (such as drivers, restraints, challenges, and opportunities)
- To strategically analyze micromarkets with respect to individual growth trends, future prospects, and contributions to the overall drug screening market
- To analyze opportunities in the market for stakeholders and provide details of the competitive landscape for market leaders
- To forecast the size of the market segments with respect to five main regions, namely, North America, Europe, Asia Pacific, and the Rest of the World
- To strategically profile the key players and comprehensively analyze their product portfolios, market positions, and core competencies
- To track and analyze competitive developments such as acquisitions, product and services launches, approvals, expansions, agreements, partnerships, and R&D activities in the drug screening market.
Available Customizations
With the given market data, MarketsandMarkets offers customizations as per the company’s specific needs. The following customization options are available for this report:
Company Information
- An additional five company profiles
Growth opportunities and latent adjacency in Drug Screening Market